

NicoElNino
Currently, it appears that the market is attempting to stage a comeback in the hopes of a Fed pivot. The most recent inflation reading (for November) came cooler than expected, and this provided some more optimism. The Fed concluded its December meeting and announced a 50 basis-point rate increase, in line with expectations. Fed Chair Powell also indicated a terminal rate of 5% before the pause; however, the Fed will be open to revising it upwards based on future data. Moreover, the Fed gave no indication of a rate cut in the year 2023. The full impact of all these rate increases has not made it to the real economy yet. Furthermore, the yield curve (2-yr treasury yield versus 10-year yield) has been inverted for some time and more than it has ever been. The possibility of at least a mild recession in 2023 is getting more and more likely.
So, is the recent optimism the start of a bull run, or would it prove to be a bear market rally? In our opinion, the market was getting a bit ahead of itself. As Yogi Berra put it, “it is really tough to make predictions, especially about the future.” (Note: This phrase is also attributed to Danish physicist Neils Bohr).
During the good times (bull runs), investing seems to be easy. But a good portfolio strategy must account for eventual correction and drawdowns. An investor must know his/her tolerance for drawdowns to be able to avoid making really bad mistakes. Most investors, some due to emotional makeup and others because of their stage in life, can not afford to have strategies that result in high volatility and deep drawdowns. So, most broad market indexes are not suitable for such investors due to their pattern of a roller-coaster ride with constant booms and busts.
Retirees have an additional problem. Since they need to withdraw income on a regular basis, they may be forced to sell when the prices are low. New retirees can also face the problem of sequential risk if the market happens to go into a deep correction for multiple years in the early phase of retirement, as it did during the period 2000-2003. These are some of the issues that we set out to resolve with the Near-Perfect Portfolio (or NPP) strategy.
The NPP strategy described in this article should be of interest to any long-term investor, but especially to the following audiences:
- Income and conservative investors who don’t like the roller-coaster ride of the stock market and rather sleep relatively well even during the depth of a correction.
- Retirees or near-retirees may want to avoid the sequential risk of the stock market.
- Folks who are already 50-plus or approaching 50 would prefer a strategy that would offer lower volatility while maintaining higher returns in the long term.
- Investors who want to take control of their investments are prepared to spend at least a few hours a month managing their portfolios.
That said, everyone’s situation is different, and one size does not fit all, so it is always a good idea to analyze any new strategy and see if it would suit your specific goals, needs, and temperament.
We started to write about this portfolio strategy in early 2020, which we call NPP strategy. Since nothing is perfect, especially so in the investment world, hence the name Near-Perfect Portfolio. In fact, it is hard to find anything that is even near-perfect, so sure, we are aiming high. Generally speaking, we’re looking for a strategy that performs reasonably well during the bull markets, preserves capital when the market throws a fit or performs poorly, and provides a decent enough income stream on a consistent basis. This is the basis of the Near-Perfect Portfolio.
We follow the NPP strategy in our Marketplace service, “High-Income DIY Portfolios,” but from time to time, we like to provide updates and the progress of the NPP portfolio here on the SA public platform for the benefit of our regular readers.
Why Do We Need A Strategy Like NPP?
Here are some of the key reasons:
- We want a strategy that can avoid (to a large extent) the roller coaster ride of the stock market and index investing.
- It is almost impossible to predict the market correctly, so we would want a strategy that works fairly well in most environments.
- The S&P 500 had an extraordinary streak of high performance during the past 13 years (until 2021), and it is unlikely to continue in the next decade. We want a strategy that could adjust to such a scenario.
- If you are a retiree or near-retiree or otherwise a conservative investor, you cannot afford large or deep drawdowns in your portfolios, as that may require years to come back even. Also, fresh retirees would like to avoid the risk of a “sequence of returns” at all costs.
- The S&P 500 currently provides a yield that is less than 1.6%, so index investing would not be an ideal option for most income investors. We want a strategy that could provide a respectable 5% income, if needed, without causing portfolio depletion.
- In summary, we want a strategy that produces low volatility and minimal drawdowns (ideally less than 60% of the S&P 500), preserves capital, provides a decent income, and reasonable total returns over the long term. These are exactly the objectives of the NPP strategy.
Goals of Near-Perfect Portfolio
To be more precise, we expect our Near-Perfect Portfolio to achieve these three goals:
- Preserve capital by limiting the drawdowns to less than 20%.
- Provide a consistent income of roughly 5% to those who need to withdraw.
- Grow the capital for the long term at an annualized rate of 10% or better (including the income).
We must caution that these strategies need some work on an ongoing basis and may not suit highly passive investors. In addition, they require a long-term outlook and patience.
NPP: A Combination of Divergent Strategies
We are currently in an environment that is testing the limits even for diversified portfolios. We need to diversify not only in different sectors of the economy but also in different types of asset classes. The stock market is inherently volatile, so we also have to structure our portfolios in such a way that we can avoid high volatility. High volatility and deep drawdowns bring in all kinds of emotions and issues, including selling at the wrong time, fear of missing out, and above all, overall low performance. So, for additional protection, we recommend diversifying in terms of types of investment strategies. We try to combine strategies that are likely to perform in divergent ways under different market conditions. This helps bring down the portfolio volatility and improve overall performance. The NPP portfolio combines monthly rotational strategies with some buy-and-hold DGI (dividend growth investing) and high-income strategies to perform well under different market conditions.
Note: All the tables and charts included in this article are sourced from Author’s work unless specified otherwise underneath the image. The stock market data, wherever used, is sourced from public websites like Yahoo Finance, Google Finance, Morningstar, etc.
3-Bucket NPP Demo Portfolio
We have had this portfolio in its loose form since the beginning of 2020 (in our Marketplace service). It basically meant that we had all the components available, and it was left to the user how to structure the overall portfolio. But that changed when we actually launched a real-time Demo portfolio as of Jan-01-2022 within our Marketplace service. All assets or positions for the portfolio were first acquired on Jan-03-2022 (the first trading day of the year).
Note: As a full disclosure, we are personally invested in the demo NPP portfolio.
There are three components (or buckets) of this portfolio. We allocated $100,000 to the demo portfolio as of 1st Jan. 2022. Please note that this is an amount used for demo purposes; however, one could use any amount, higher or lower, as per the individual situation using the below allocations:
Bucket 1: DGI Bucket (40% of the assets, $40,000 was allocated)
Bucket 2: Rotational Bucket (45% of the asset, $45,000 was allocated)
Bucket 3: CEF High-Income Bucket (15% of the asset, $15,000 was allocated.)
The month-to-month real-life performance of this portfolio in the year 2022 is presented in the below chart. Obviously, the year 2022 has turned out to be very challenging for almost all types of investments. As you can see in the chart, both the S&P500 and the NPP have had negative returns in the year 2022, but the S&P500 has been much more volatile and has resulted in deeper drawdowns in many instances. However, the NPP strategy, due to its lower volatility, has resulted in limited drawdowns, at times 50% less or less than 2/3rd of the S&P500.
Chart-1
Author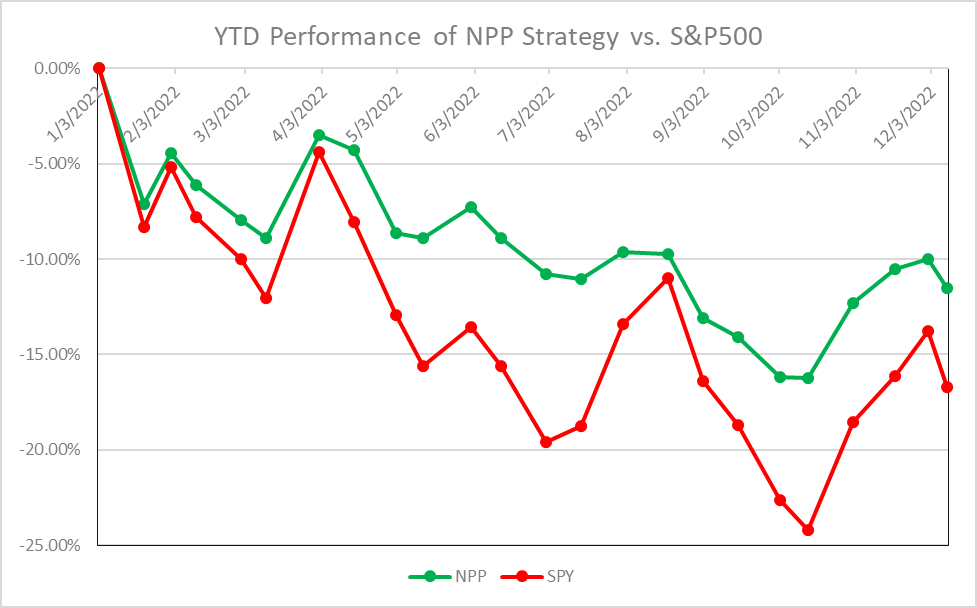
If we were to invest in this portfolio, starting on Jan. 01, 2008, this would have handily beat the S&P500. The below charts demonstrate the comparison based on the backtested results.
Chart-2: Performance Comparison with S&P500 since 2008:
Author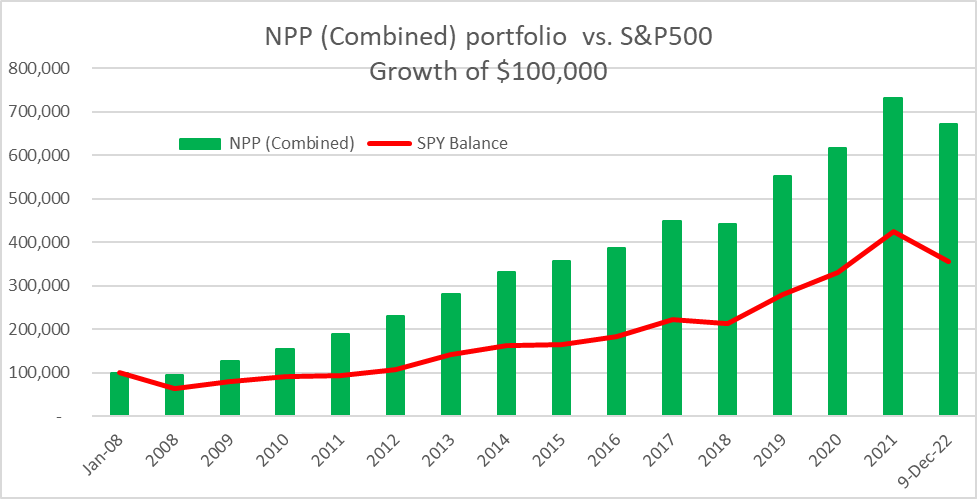
Chart-2B: Performance Comparison with 6% Income Withdrawals
Now, the below chart is the same as above but with a 6% withdrawal (inflation-adjusted) each year from the portfolio. This chart is a real eye-opener in the sense of how a very deep drawdown (see S&P500) can ruin the future prospects of any portfolio. So, it is very important, especially for retirees who withdraw income from their portfolios, that they invest in strategies that result in low volatility and limited drawdowns. It is amazing to see how the S&P 500 could never really recover from its drawdown in 2008 due to annual withdrawals, in spite of an extraordinary bull run between 2010 and 2021. However, the NPP portfolio did pretty well during the same circumstances, with the same amount of withdrawals. The difference is due to much smaller drawdowns in the case of NPP in comparison to S&P500.
Chart-2B
Author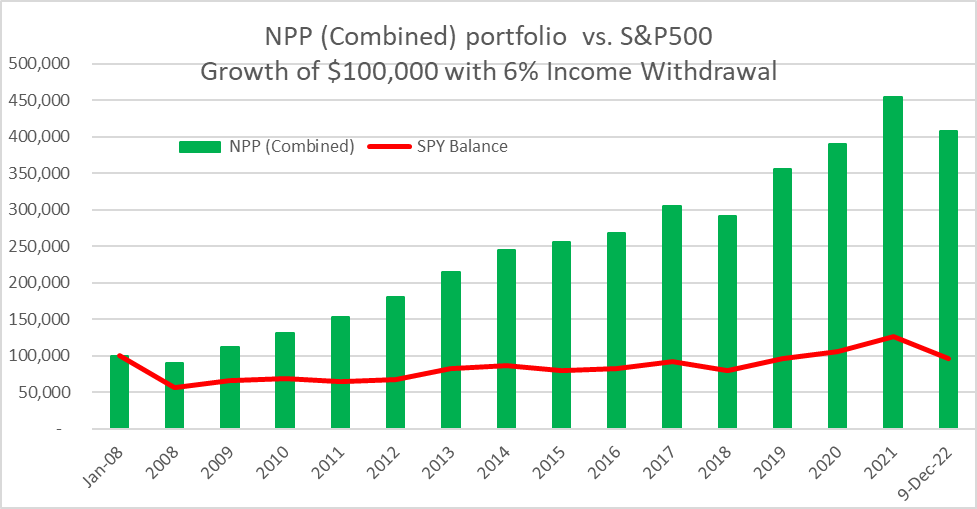
Note: For backtested performance analysis, a few stocks/securities had to be replaced with suitable alternatives, as they did not have a history all the way back to 2008. For example, AbbVie (ABBV) was replaced with its parent co. Abbott Labs (ABT), prior to the year 2013 (prior to spinoff).
Bucket-1: DGI-Core
The goals of this DGI Bucket are:
- Long-term investments 3%-4% dividend income
- Long-term total return in line with the broader market
- Drawdowns to be about 70% (or less) of the broader market
For this part of the portfolio, our focus was to select stocks that tend to do well in both good times and bad, for example, during recessions/corrections. This is especially important if you are a retiree. There was not much reason to change or replace any of the positions in this portfolio. We agree there are many other stocks that would be equally appealing, but we only have 15 positions in the portfolio, and the goal here is to hold the positions for the long term unless something fundamentally changes with a company.
The following stocks were selected at the beginning of 2022 and maintained as buy-and-hold positions. No changes were made during the year.
AbbVie Inc., Amgen (AMGN), Clorox (CLX), Digital Realty (DLR), Enbridge (ENB), Fastenal (FAST), Home Depot (HD), Johnson & Johnson (JNJ), Lockheed Martin (LMT), Altria (MO), Microsoft (MSFT), NextEra Energy (NEE), National Retail Prop (NNN), Texas Instruments (TXN), and Verizon (VZ).
Table-1:
Author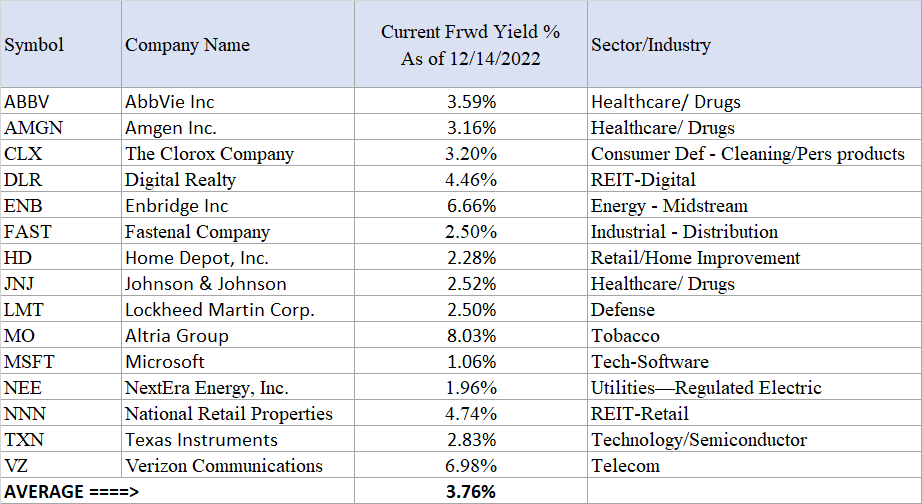
The average current yield from this group of 15 stocks is quite attractive at 3.76% compared to 1.55% from S&P 500. If you still have some years before retirement, reinvesting the dividends for a few years would take the yield on cost up to 5% easily.
Bucket-2: Rotational Bucket
This is our insurance bucket (or hedging bucket), which should help in preserving our capital in times of crisis or panic. In addition, it should reduce the volatility of the overall portfolio and still provide a very decent return. We expect this bucket to outperform the S&P500 in terms of total returns with a long-term focus.
Note: A word of caution for new investors – just because we’re allocating 45% of the portfolio to this strategy, we are not recommending that you change to this strategy overnight with large sums of money. Rather, it should be done gradually over time in smaller steps. Further, for large capital portfolios, we recommend using more than one such strategy.
A Rotation Strategy for the Bull as well as Bear markets:
In the Rotational bucket, we normally rotate between a fixed set of securities on a periodic basis (usually every month) based on the relative performance of each security during the previous period of defined length.
This portfolio is designed in such a way that it aims to preserve capital with minimal drawdowns during corrections and panic situations while providing excellent returns during bull periods. Due to much lower volatility, this portfolio is likely to outperform the S&P 500 over long periods of time. However, at times, it may underperform to some extent.
This specific strategy is based on eight diverse securities, but we will hold only two of them at any given time based on relative positive momentum/performance over the previous three months. Basically, we will select the two top-performing funds. The performance is measured in terms of total returns, including any dividends or distributions. The rotation is on a monthly basis. The eight securities are:
- Vanguard High Dividend Yield ETF (VYM)
- Vanguard Dividend Appreciation ETF (VIG)
- iShares MSCI EAFE Value ETF (EFV)
- iShares MSCI EAFE Growth ETF (EFG)
- Cohen & Steers Quality Income Realty Fund (RQI)
- iShares 20+ Year Treasury Bond ETF (TLT)
- iShares 1-3 Year Treasury Bond ETF (SHY)
- ProShares Short 20+ Year Treasury Bond ETF (TBF)
Note: In our real-life demo portfolio, the security TBF was introduced/added starting the month of May 2022.
Bucket-3: CEF High Income Bucket
We allocated only 15% of the funds to this bucket, but depending upon individual situations and income needs; one could invest up to 25% of the funds in this bucket. In this bucket, we invested in 11 high-income investment funds; most of them are CEFs (Closed-End Funds). However, in the energy sector, we picked an individual stock (Magellan Midstream Partners (MMP)), being a partnership. Please be aware that a partnership usually issues a K-1 form (partnership income) at tax time instead of dividend income.
The basic idea here was to select the very best funds, one from each of the many asset classes. The average yield of the portfolio presented below is very attractive at roughly 9%.
The funds/securities are: (CHI), (UTF), (UTG), (PDI), (BBN), (FFC), (BST), (HQL), (MMP), (USA), and (RQI).
Table-2:
Author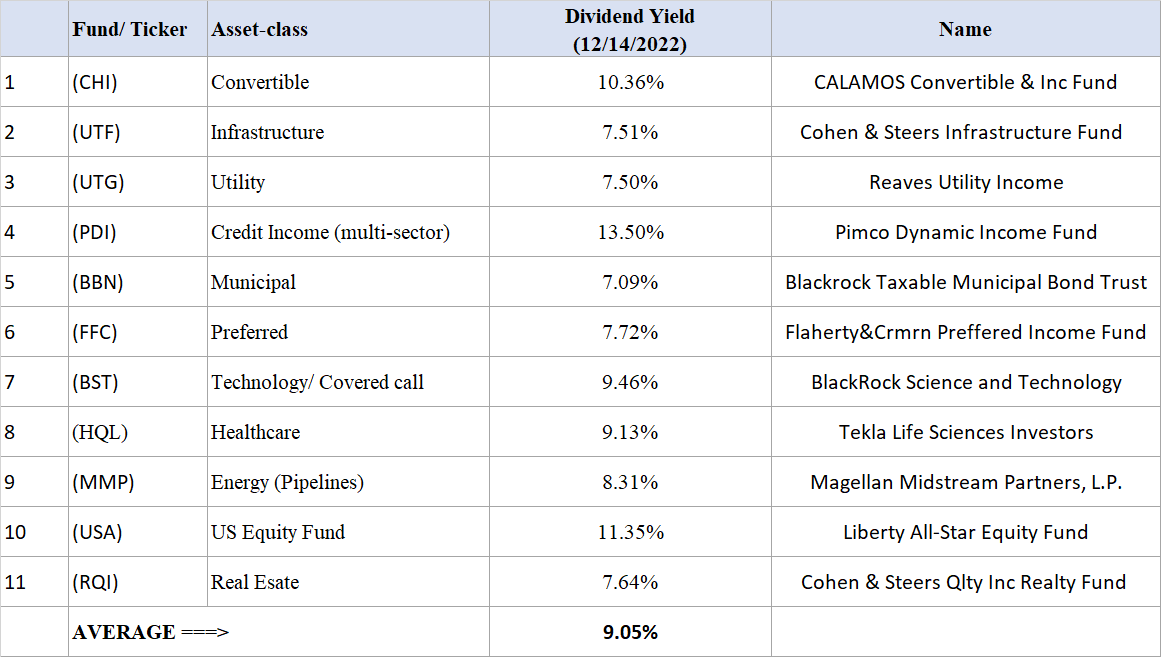
CAGR and Drawdowns:
Before you adopt a new strategy, it is important to see how that strategy would have behaved in the past over a long period of time under different market conditions.
During the good times, it is natural that most folks do not think much about drawdowns. However, even though, corrections and resulting drawdowns are part of investing in markets as they happen with regular frequency. Broad market indexes like S&P 500 had a drawdown (loss from top to bottom) of over 45%, 50%, and 30%, respectively, during the dotcom crash (2000-2002), financial crisis (2008-2009), and Covid-19 crash (Jan-March 2020). Sometimes a downturn can end quickly, as we experienced during the Covid-19 crash, but at other times it can be long, slow, and painful, for example, like what we witnessed from 2000-2002.
However, as demonstrated earlier, very deep drawdowns can ruin the prospects of any portfolio, so our focus in the NPP strategy is to limit the drawdowns. In addition to the level of tolerance to drawdowns, there is always the inherent risk of negative sequential returns during the early years of retirement.
So, let’s compare the drawdown performance of our NPP strategy and the S&P 500 during some of the worst times during the last 15 years (based on backtesting). We are not in a position to go beyond 2008 due to a lack of reliable data; nevertheless, it would cover the financial crisis and a few other deep correction periods.
List of drawdown timeframes:
- Jan-2008 to Mar-2009 (Financial and Housing crash)
- Oct-2018 to Dec-2018 (Crash of 2018)
- Jan-2020 to Mar-2020 (Pandemic crash)
- Jan-2022 to Dec. 09, 2022 (the current period)
Table-3:
Author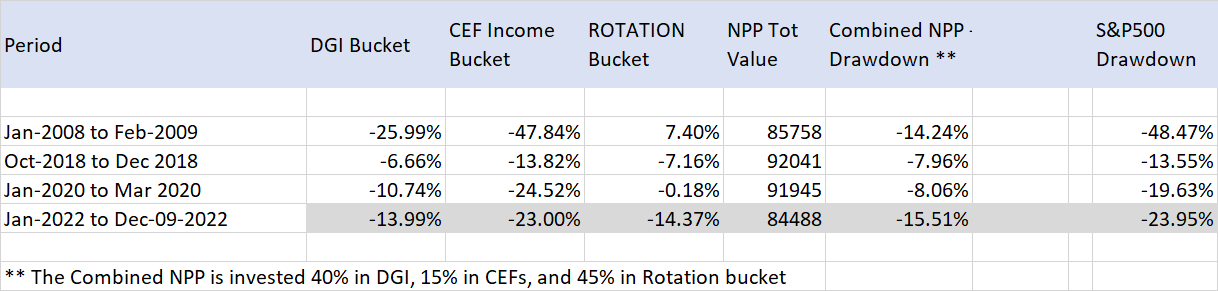
As you can see above, the drawdown of the NPP portfolio was less than half of the S&P 500 most times. During the current downturn, it is about two-thirds of the S&P 500’s drawdown. However, the current downturn is still in progress, so it may be premature to draw any conclusions.
Below is the performance of the NPP strategy and comparison with the S&P500 (based on backtesting results since 2008).
Table-3B:
|
As of 09-DEC-2022 |
CAGR** |
|
CAGR of DGI bucket since 2008: |
13.69% |
|
CAGR of CEF-High-Income bucket since 2008: |
10.09% |
|
CAGR of ROTATION bucket since 2008: |
14.43% |
|
CAGR of Combined NPP portfolio since 2008: |
13.60% |
|
CAGR of the S&P 500 since 2008: |
8.88% |
** CAGR – Compound Annual Growth Rate
Concluding Thoughts
We are going through some of the most challenging times right now, including 40-year high inflation, a war in Europe causing an already bad situation worse, the rapid rise in interest rates after more than a decade of zero interest rates, and trillions of dollars of quantitative easing. Also, by the end of 2021, stock market valuations had reached a record high after 13 years of bull run and causing a lot of frothiness. So, the question is how to preserve wealth without compromising or missing on the upside. We believe our NPP strategy addresses some of these questions and issues squarely and rather successfully. What we need is a well-rounded, diversified, and multi-asset investment strategy. NPP is one such diverse investing approach with three baskets, which should provide lower volatility, wealth preservation, and long-term growth. Above all, the combined portfolio should generate a very decent income of 5% and provide protection from bigger drawdowns.
The main idea of this series of articles is to get the readers to think, explore and research a multi-basket investment approach. These are especially suitable for folks who want to avoid the constant roller-coaster ride of the broader market indexes and rather have a stress-free investment approach. However, that said, these strategies require a long-term investment horizon, discipline, and some time/effort on a monthly basis, especially in managing the Rotational part of the portfolio. Please note that the Rotational strategies don’t work very well in a taxable account. They work best inside a tax-deferred account.
Be the first to comment