

Julie Clopper
This story was originally published for subscribers of Reading The Markets on August 12 and has been updated as of the morning of August 16.
Amazon’s (NASDAQ:AMZN) stock has soared by nearly 40% since the June lows. The big rally has followed quarterly results that showed better than expected revenue and better revenue guidance.
But despite this better-than-expected revenue, the company posted another decline in its trailing 12-month operating cash flow, falling to $35.5 billion. That is the lowest the value has been since October 2019. Historically, the stock price has followed the trailing 12-month operating cash flow metric very closely, with the recent rally being a significant divergence.
Bloomberg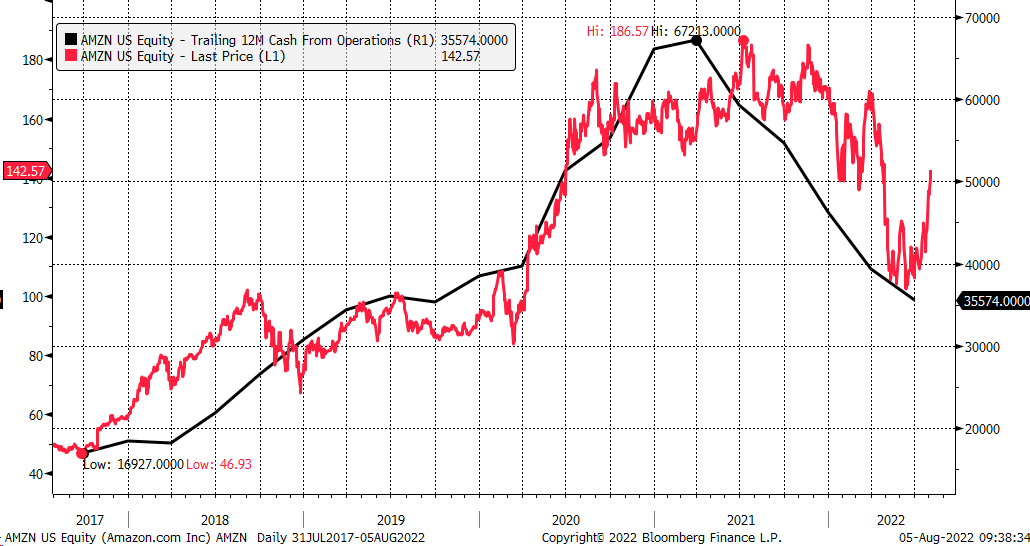
The stock’s market cap now trades at more than 40 times operating free cash flow over the past 12 months, a value much higher than the historical average of 28 going back to 2014 and more than two standard deviations above that average.
Bloomberg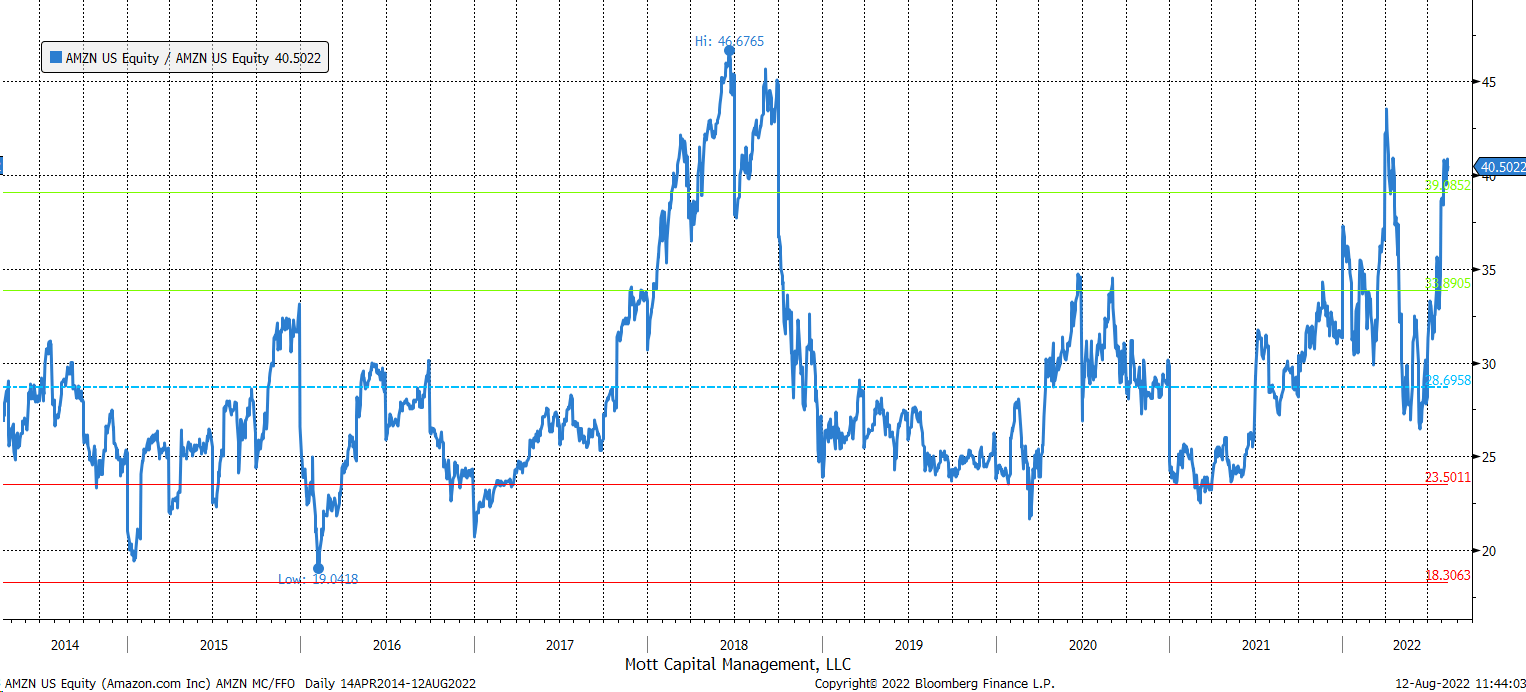
It is hard to say that the stock price anticipates free cash flow from operations. Historically, that is not what happens. Typically the stock trends with changes in free cash flow from operations, not in front of it. The one time the stock ran up in front of the metric was in 2018, and ultimately the stock returned to an average valuation in a reversion to the mean.
Going back to 2010, based on a historical average of around 28.5, the stock today would be worth approximately $99. It would suggest a greater risk that the stock’s recent move higher is now very overextended and seems unlikely to last.
Bloomberg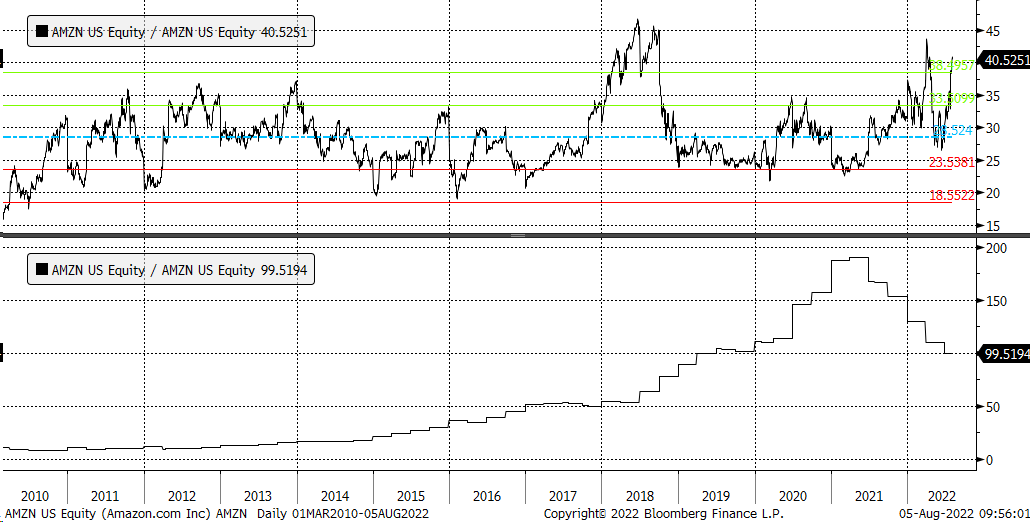
Betting On AMZN’s Decline
Options data shows that someone is making a big bet that Amazon’s stock will crater by the middle of September. The open interest for the September 16, $140 puts and calls rose by around 15,000 contracts. The data shows the put contracts traded on the “ASK” and bought for $4.55 per contract. The option bet would imply that Amazon would fall below $135.45 by the middle of September. It is a huge bearish bet, too, with the trader paying premiums of around $6.8 million.
Technical Resistance
Amazon’s stock has recently risen to an area of resistance around $145. That is where the stock closed before the disastrous first quarter results that sent the shares plunging in April. As a result, the stock has now filled that gap, and typically when a gap is filled a stock resumes its previous trend. In this case, the previous trend for Amazon had been lower. The stock’s RSI has also hit overbought levels, rising above 70.
Should resistance around $145 continue, it may result in Amazon giving back much of its post-earnings gains and moving to around $125. Should the stock be able to push even higher, and break out above $145, then it could rally to about $160.
However, given the overbought levels and the completion of the gap fill, it seems more likely that shares could reverse lower.
Trading View
Perhaps Amazon’s business may have turned the corner, and cash flow from operations will begin to turn higher, but that has not happened to this point. Additionally, even if operating cash flow turns, the question will be how long it will take for them to recover; because the value of the stock on a cash flow basis is extremely high, suggesting there needs to be some retracement in the equity price.
Join Reading The Markets Risk-Free With A Two-Week Trial!
(*The Free Trial offer is not available in the App store)
Reading the Markets helps readers cut through all the noise delivering stock ideas and market updates, and looking for opportunities.
We use a repeated and detailed process of watching the fundamental trends, technical charts, and options trading data. The process helps isolate and determine where a stock, sector, or market may be heading over various time frames.

Be the first to comment