jandara
Investment Thesis
The First Trust Capital Strength ETF (NASDAQ:FTCS) is one of only a handful of large-cap blend ETFs to outperform the S&P 500 Index over the last ten years. With logical screens covering cash on hand, debt load, return on equity, and volatility, FTCS was designed for investors seeking to avoid so-called junk stocks found in broad-based ETFs like SPY. However, my analysis uncovered some surprising facts, including a poor three-year track record and a growth profile that doesn’t square with its relatively high valuation. Furthermore, its constituents face a challenging earnings season, where disappointing results could trigger another valuation squeeze. I believe it’s best to stay clear of FTCS for now, hope for substantial changes at the subsequent quarterly reconstitution, and re-assess if its price falls further.
FTCS ETF Overview
Strategy Discussion
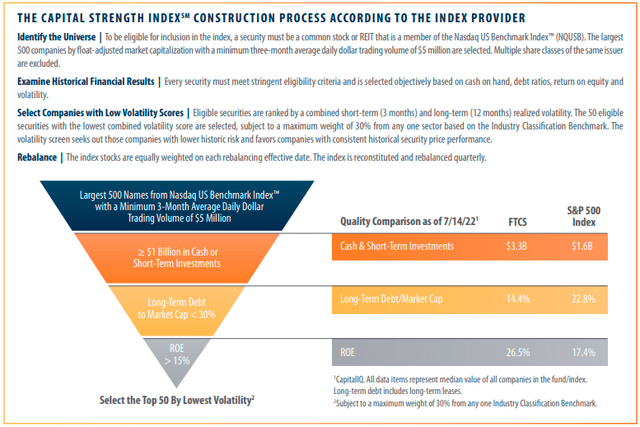
FTCS tracks the Capital Strength Index, selecting 50 of the largest companies from the Nasdaq US Benchmark Index that meet specific criteria for cash on hand, long-term debt as a percentage of market capitalization, return on equity, and realized volatility. The construction process is below, but one key feature is the quarterly reconstitutions. The most recent annual report shows that turnover ranged from 85% to 133% between 2017 and 2021. In other words, there’s a high probability that FTCS’s composition will be entirely different next year.
These screens are logical, but at least the cash one seems unnecessary as applied to today’s large-cap stocks. To illustrate, the top 49 companies in the SPDR S&P 500 Trust ETF (SPY) have at least one billion in cash. Union Pacific (UNP) is where the streak ends at $834 million. In total, 213 S&P 500 constituents have cash on hand below $1 billion, but they represent just 14.95% of the ETF. This type of screen seems better suited for small- or mid-cap companies where sufficient cash on hand is often an issue.
The long-term debt screen eliminates several diversified banks but also household names like Verizon Communications (VZ), AT&T (T), NextEra Energy (NEE), CVS (CVS), and IBM (IBM). It’s also worth mentioning that as a stock price rapidly declines, that raises the ratio and puts the company up for elimination at the subsequent reconstitution. That could happen to Parker-Hannifin (PH) and Intercontinental Exchange (ICE) next quarter, as their ratios sit at 29.78% and 35.72% after recently price declines in the last month.
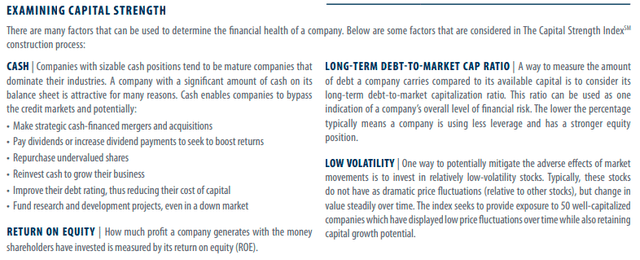
Finally, the return on equity screen is arguably the most effective screen, resulting in the exclusion of top stocks like Amazon (AMZN), Berkshire Hathaway (BRK.B), and Walt Disney (DIS). The three screens together eliminate three-quarters of S&P 500 Index stocks but only 45% of the weight. I’m not sure all this effort is worth it, but the Index then adds a fourth component: selecting only 50 companies with the lowest realized volatility. Generally, I expect this to favor sectors like Industrials, Health Care, Consumer Staples, and even Technology in bull markets since the ROE screen wouldn’t be as effective in eliminating poor-performing companies. For those inclined, First Trust provides descriptions for each of the screens used and their implied benefits below.
Performance History
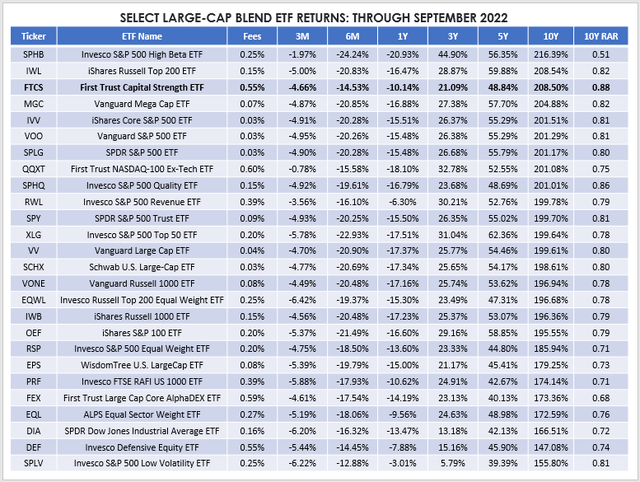
As mentioned, FTCS has a solid long-term track record and has outperformed SPY over the last ten years. Here’s a snapshot of returns for 26 U.S. large-cap broad-based ETFs with at least ten years of trading history, selected based on FactSet’s classification system.
As shown, FTCS’s 208.50% total return through September 2022 is 7-9% higher than ETFs tracking the S&P 500 Index (IVV, VOO, SPLG, SPY) and only slightly behind the iShares Russell Top 200 ETF (IWL). The Invesco S&P 500 High Beta ETF (SPHB) was the best performer, as expected in a mostly bullish market. However, FTCS’s ten-year risk-adjusted returns were the best because of the low-volatility component. The main downside is that FTCS’s outperformance has softened over the last few years. Its three-year total return of 21.09% was the fourth worst, and its 0.36 three-year return to risk ratio was the eighth worst in this 26 ETF sample.
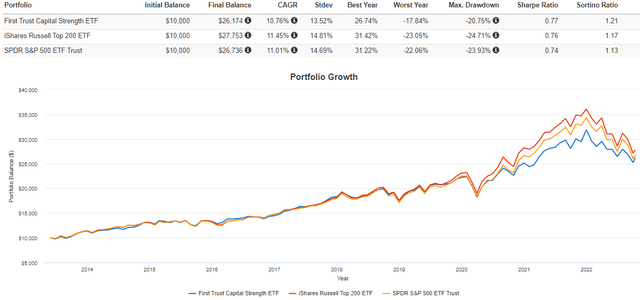
There’s also the fact that FTCS didn’t start tracking its current Index until June 2013, meaning the ten-year return figures are slightly misleading. Here’s how FTCS has performed since that date through October 13, 2022.
FTCS gained an annualized 10.76% compared to 11.45% and 11.01% for IWL and SPY, but its risk-adjusted returns (Sharpe and Sortino Ratios) were still better over this longer time frame. The ETF should continue offering some downside protection in a bear market, but this needs to be balanced with what’s often an undiversified portfolio. Let’s look at its composition next.
FTCS Analysis
Sector Exposures and Top Holdings
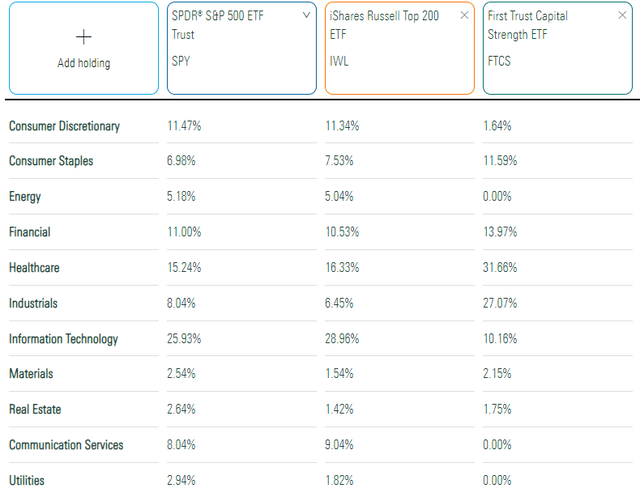
Currently, FTCS has 31.66% exposure to Health Care stocks, which is technically over the 30% limit and something the Index will correct at the next rebalancing date. Industrials are also approaching this cap at 27.07%, so at least right now, it’s overconcentrated. Financials, Consumer Staples, and Technology are in the 10-14% range, but the ETF has negligible exposures to the remaining six sectors.
I would remind investors that these sector allocations will likely change dramatically over time. Per the fund’s annual report, FTCS had 25.40% exposure to Technology as of December 31, 2021. Now at 10.16%, it’s a clear bet against the sector, whose stocks likely didn’t pass the low-volatility screen.
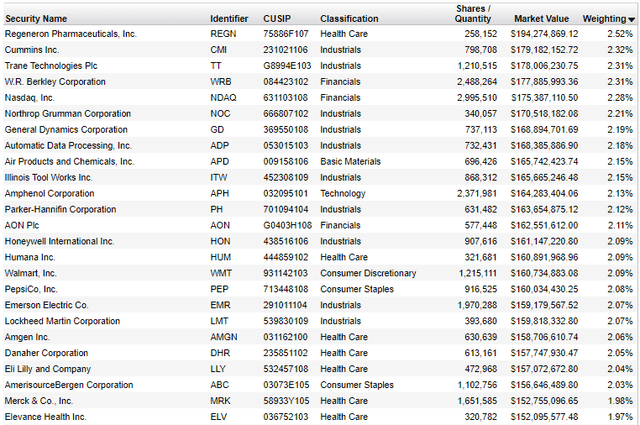
Of the top ten holdings as of December 31, 2021, only Zoetis (ZTS), Abbott Laboratories (ABT), UnitedHealth Group (UNH), and Automatic Data Processing (ADP) remain. Current top holdings include Regeneron Pharmaceuticals (REGN), Cummins (CMI), and Trane Technologies (TT).
Fundamental Analysis By Industry
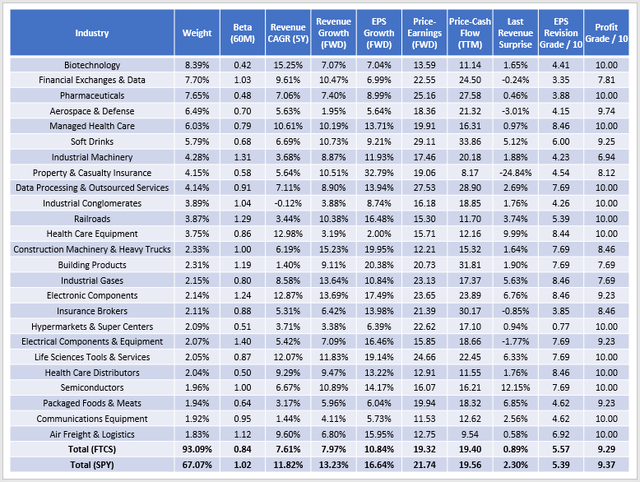
With only 50 holdings, you can expect only so much diversification with FTCS. However, it’s at least spread out across 29 GICS industries, with 93.09% of the weight inside the top 25. SPY is much better at 67.07%, and my read is that FTCS is best suited as a complementary ETF. In my view, using it as an alternative to SPY is too risky.
This table highlights FTCS’s 0.84 five-year beta, its most unique feature. You can find this volatility range in almost two-dozen other large-cap ETFs, but most are value- or dividend-oriented and trade at much cheaper valuations. FTCS trades at 19.32x forward earnings and 19.40x trailing cash flow, which isn’t much cheaper than SPY and places it close to ETFs like the ProShares S&P 500 Dividend Aristocrats ETF (NOBL). For a low-beta ETF, FTCS is expensive.
That premium is for safety because FTCS’s growth features aren’t impressive. Current constituents grew sales at an annualized 7.61% rate over the last five years compared to 11.82% for SPY. Weak growth in the Industrials sector is a primary cause, with FTCS’s 13 holdings averaging just 4.15% growth. Below is a sample of growth rates for FTCS’s top and bottom three stocks in this sector.
The estimated sales growth for FTCS isn’t much better at 7.97%, and the ETF is nearly six points behind SPY’s estimated earnings growth (10.84% vs. 16.64%). This level of growth is unusual. Even comparing FTCS with 23 other large-cap ETFs with betas between 0.80 and 0.90, FTCS’s earnings growth is third-worst. Unless significant changes are made at the next quarterly reconstitution, there’s a good chance FTCS will substantially underperform if markets rebound.
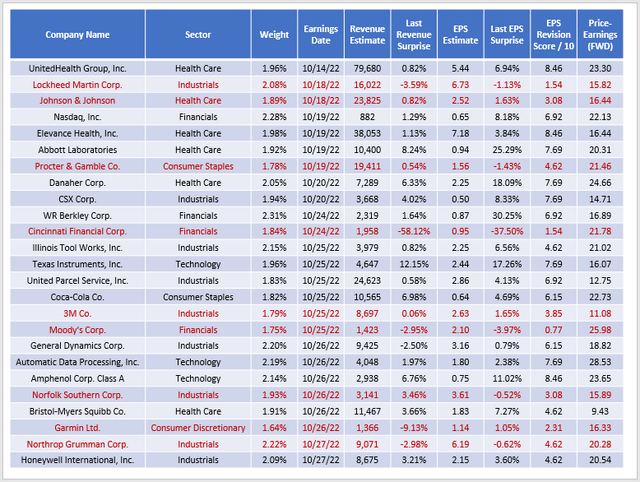
FTCS’s constituents also face a challenging earnings season, given mostly disappointing results in Q2. Its components had a weighted-average 0.89% revenue surprise compared to 2.30% for SPY. According to Seeking Alpha’s Quant System, they enjoy a slightly better EPS Revision Grade, which I’ve normalized on a scale of 1-10 (5.57 vs. 5.39). However, over the next two weeks, here’s what lies ahead for 25 of FTCS’s top holdings. I’ve highlighted the ones I feel are in danger based on poor last quarter results and their EPS Revision Scores.
There are a lot of Industrials names highlighted. For example, two-thirds of analysts covering Lockheed Martin (LMT) have downgraded the next quarter’s EPS estimates in the last three months, and the company missed sales and earnings estimates last quarter. Credit Suisse lowered its rating on LMT to “Underperform” on Wednesday based on valuation. Meanwhile, JPMorgan Chase did the same for Northrop Grumman this morning, highlighting its expensive valuation (20.28x forward earnings, 16.50x forward EBITDA). In short, there’s a lot of pressure on this sector, and risk-averse investors may want to consider holding off on purchasing FTCS until the month closes.
Investment Recommendation
Despite a strong long-term track record, FTCS hasn’t performed well over the last three years. It’s also undiversified and has a relatively expensive valuation for the growth provided. The main attraction is its low volatility, but that’s easy to come by among value and dividend-focused ETFs. In most cases, investors will also receive a better balance between growth and valuation. Therefore, I’m rating FTCS as a hold to reflect my lack of enthusiasm for the fund, and I look forward to discussing this further in the comments section below. Thank you for reading.





Be the first to comment