

Teamjackson
Key takeaway
Amazon (NASDAQ:AMZN) delivered Q3 revenue of $127.1 billion (+15% YoY/+19% ex-FX) that was in line with consensus but operating income of $2.5 billion (-48% YoY) came in 17% below the Street’s $3 billion. Net income contracted 9% to $2.87 billion which included a pre-tax valuation gain of $1.1 billion from the Rivian (RIVN) investment. EPS of $0.28 was down 8% against $0.31 in 3Q21. Overall, Q3 results were largely below expectations and Q4 guidance of revenue between $140-$148 billion (+2-8% YoY incl. 460bps FX impact) and operating income between $0 and $4 are both below consensus of $155 billion and $5 billion. While AWS continues as the most meaningful value driver, slowing revenue and EBIT growth suggests markets will be looking for a lower valuation multiple or even shift the valuation framework from SOTP to P/E.
Company data, consensus estimates, Albert Lin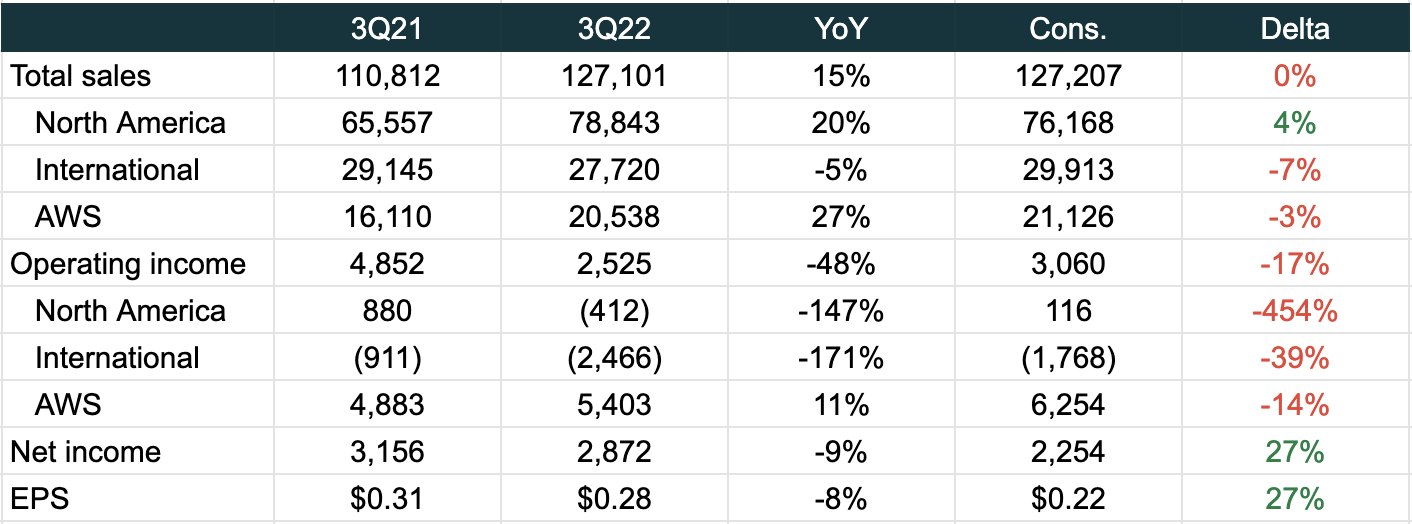
E-Commerce
Q3 North America revenue of $78.8 billion (+20% YoY) beat consensus by 4% while International revenue of $27.7 billion (-5% YoY) was 7% lower than consensus. Prime Day was an important contributor (~4%) to total Q3 revenue growth of 15%, but the event was a drag on margins given heavy product discounts and higher mix of device sales (eg. Kindle, TVs, streaming sticks, etc.) that typically don’t make money.
Company data, consensus estimates, Albert Lin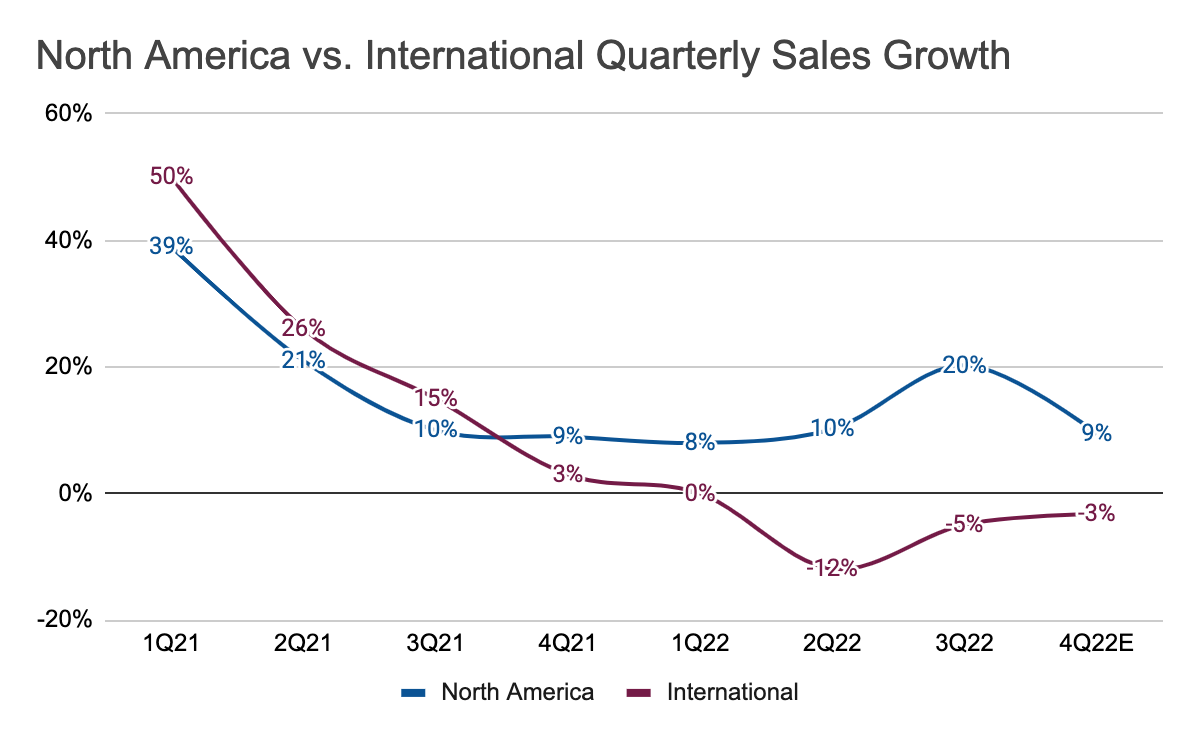
On the margin front, management highlighted a $1 billion cost improvement in both North America and International driven by better fixed cost leverage and warehouse capacity utilization. International again had trouble achieving profitability as performance in more established markets like Europe and Japan were offset by losses in emerging markets. An energy crisis in Europe continued to weigh on results, as management noted higher fuel costs in the region vs. the US.
Company data, consensus estimates, Albert Lin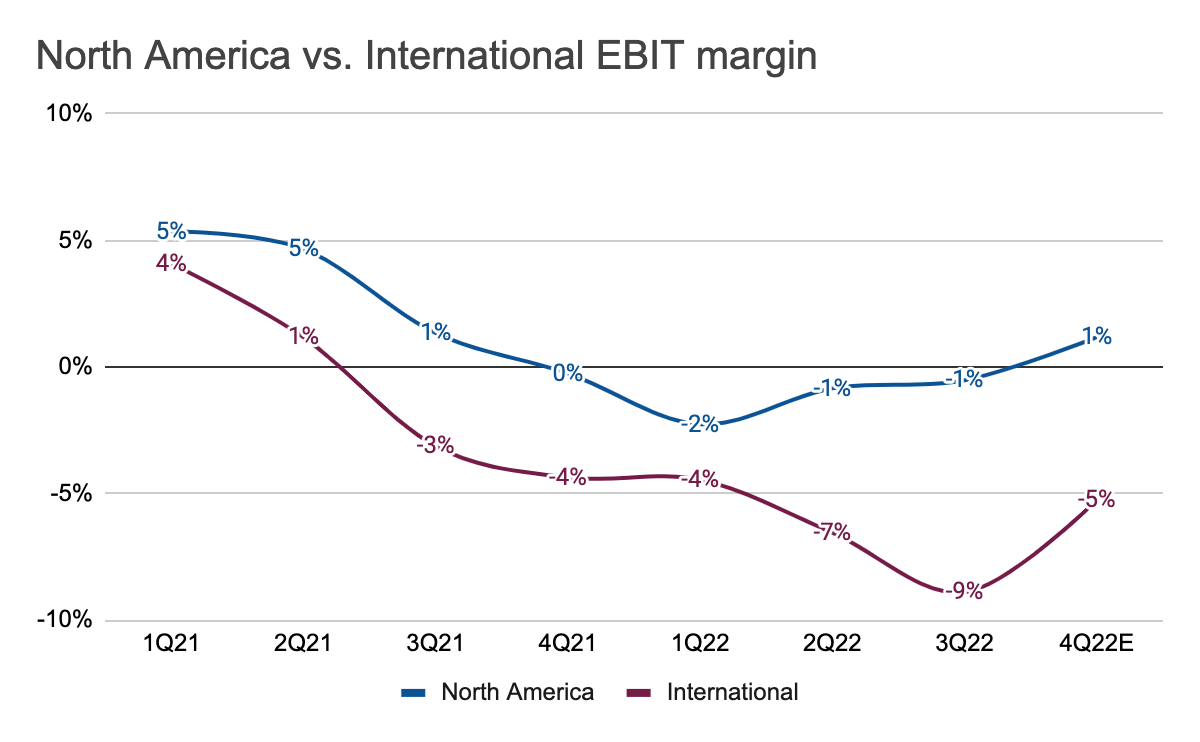
Additionally, operating income was pressured by increased content and marketing spend from Prime Video, including Rings of Power and NFL Thursday Night Football in the US. Discontinued operations such as Amazon Care, Fabric.com, and Amazon Explore also impacted the bottom-line with one-time charges.
3P Seller Services saw revenue grew 18% YoY (23% ex-FX) to $28.7 billion, where 58% of all units sold in Q3 were from 3P sellers vs. 56% in 3Q21, the largest % in company history. Subscription revenue grew 9.3% YoY (14% e-FX) to $8.9 billion. Rings of Power attracted more sign-ups than any other Amazon originals, while Thursday Night Football had 15 million viewers for the first game and drove the fastest sign-ups in 3 hours.
Advertising was again a bright spot, where revenue increased 25% YoY (30% ex-FX) to $9.5 billion. This was significantly better than most digital advertising peers that have recently reported underwhelming results in a slowing digital ad environment. In Q3, Meta (META) saw its core advertising business fell 3.7% YoY (analysis here), while Google’s (GOOG) Search business grew 4% (here). The relatively stronger performance from Amazon Advertising clearly shows that lower-funnel ad campaigns driven by purchase intent are least likely to be cut in a recessionary environment.
Company data, consensus estimates, Albert Lin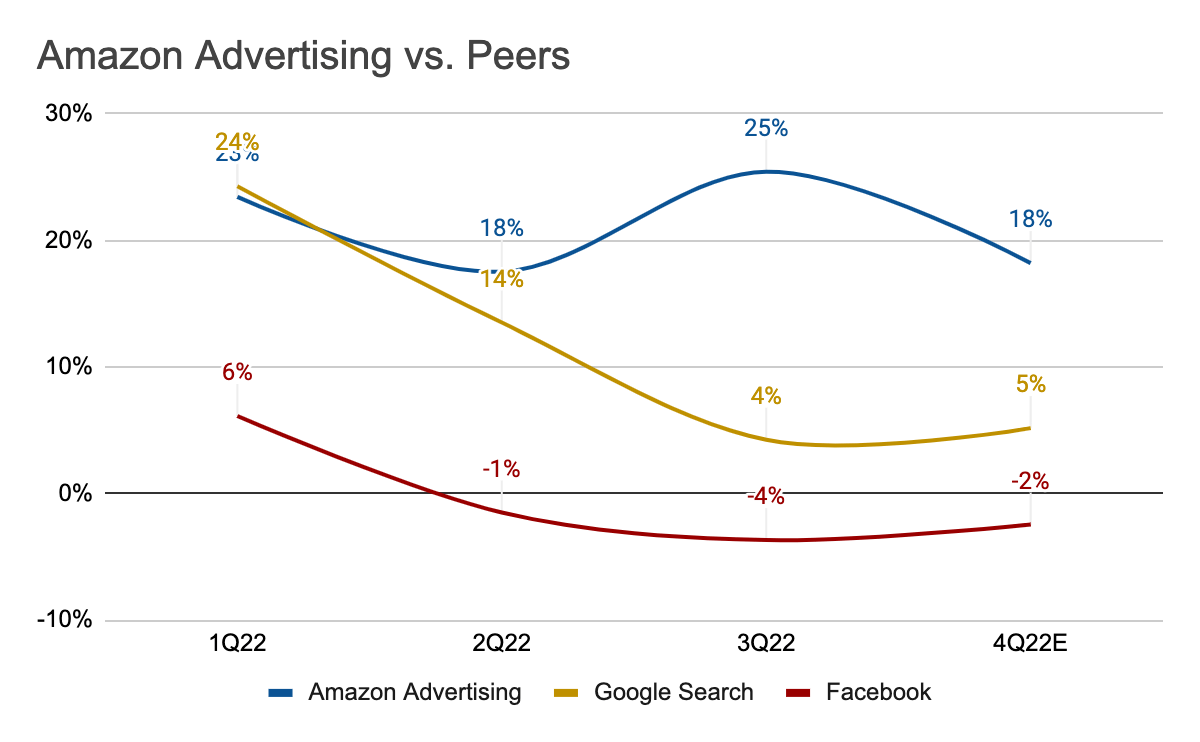
Overall, Amazon’s e-commerce business (~85% of revenue) is facing a challenging environment characterized by slower consumer demand, higher energy costs especially in Europe, and ongoing investments in emerging markets that will continue to weigh on margins. 3P unit sales are likely to increase steadily, which should help support a very lucrative advertising business. However, 4Q22 consensus top-line growth of 5.5% (NA+International) reflects a soft demand outlook and a deceleration from 12.5% in 3Q22, despite the launch of a second Prime Day in October.
While the margin profile is expected to improve from -2.7% in Q3 to -0.7% in Q4 (NA+International) as Amazon continues to right-size its operations, investors will likely remain cautious given the macro outlook for 2023 remains largely negative, suggesting a lower multiple for the retail business. Though increasing global e-commerce penetration remains a structural story, Amazon will understandably see slower growth in mature markets like the US, the UK, Germany and Japan in a post-Covid environment, while efforts in newer markets face more well-established local competition.
AWS
Q3 AWS revenue of $20.5 billion (+27% YoY/28% ex-FX) was 3% below Street expectations and represented the first <30% YoY growth in 7 quarters. On the conference call, management mentioned that AWS growth moderated to mid-20%’s exiting the quarter and customers were becoming more cost sensitive, moving to lower-priced tiers for storage and shifting workloads to Amazon’s proprietary Graviton chips. In terms of industry verticals, management highlighted financial services (mortgage, crypto, etc.) as an area that saw a pullback in volume demand.
Company data, consensus estimates, Albert Lin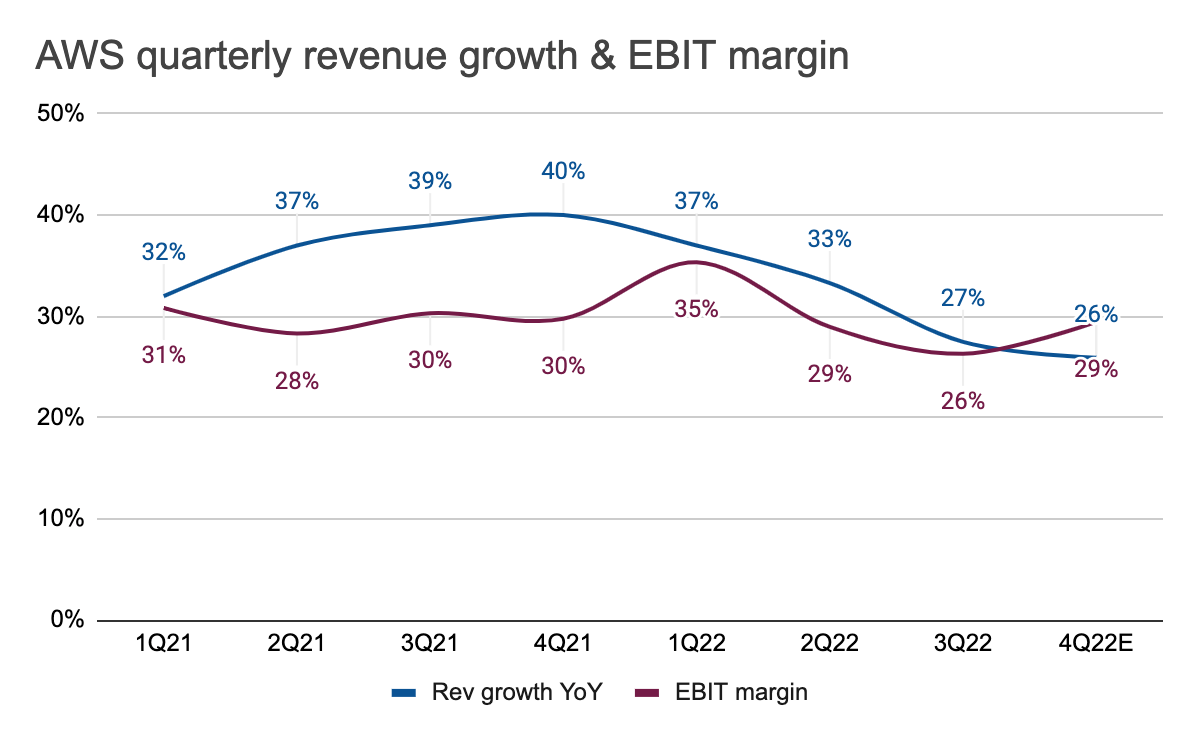
“We’ve been working with customers to lower their bills. Just like all companies, they want to lower their spend when they’re faced with uncertainty in the market.” – Amazon 3Q22 earnings call
AWS backlog stood at $104 billion at the end of the quarter, up 57% YoY. While this number may provide investors with a peace of mind, it’s important to understand that these long-term commitments should not be interpreted as near-term revenues, as year-1 usage amongst customers could come in below contract commitments. This is also the reason why there’s usually a gap between AWS sales and backlog. Nevertheless, AWS is very well positioned to become a $100 billion business in 2023.
Jefferies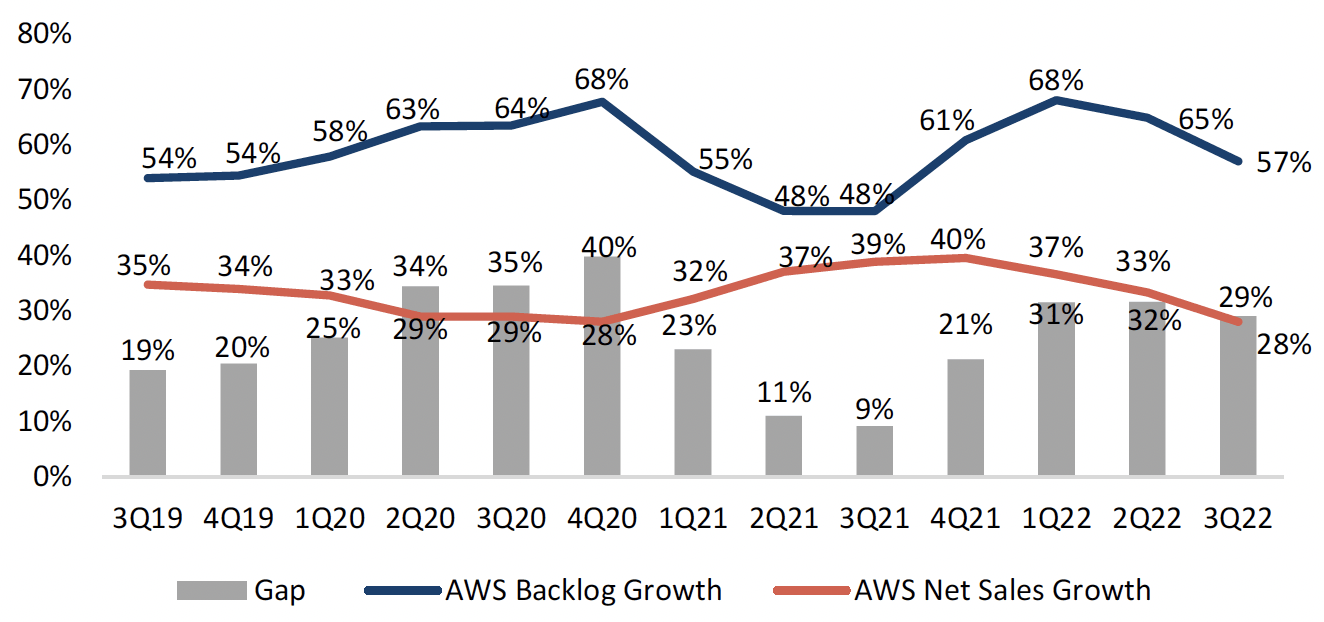
Margin-wise, AWS operating income of $5.4 billion was 14% below consensus and represented 11% YoY growth vs. 27% growth on the top-line. The lower EBIT margin (26% vs. 30% in 3Q21) was a result of a 300bp impact from headcount/stock-based comp and 100bp from higher electricity costs. While AWS is experiencing some margin headwinds, the business remains the most important value driver that represents 100% of Amazon’s operating income.
Company data, consensus estimates, Albert Lin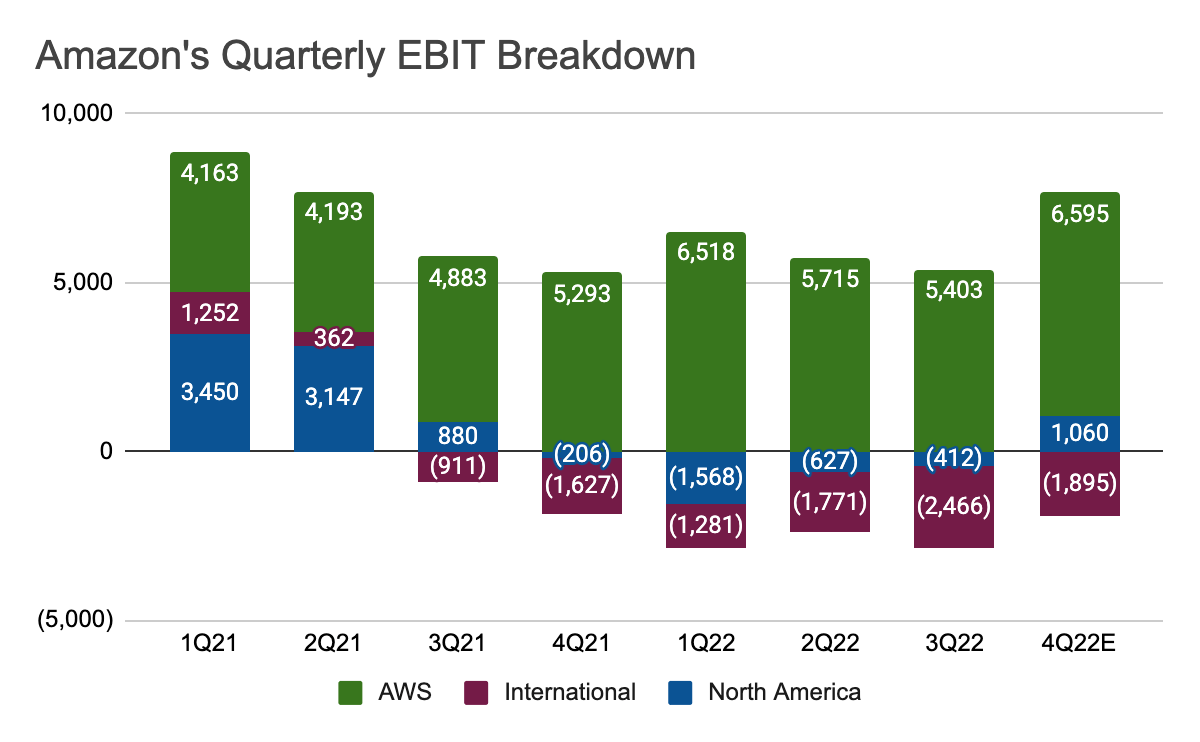
Valuation
Markets are used to valuing Amazon using the SOTP approach by separating Amazon’s businesses and valuing each of them individually. While there are all kinds of ways of doing this, I see Amazon being valued based on (1) the retail business and (2) AWS. For the retail segment (NA+International), Amazon’s days of 20%+ growth are behind us so markets are likely to value the business in a more conservative way. Therefore, I see a 1x P/S multiple for retail, a premium to Walmart’s (WMT) 0.6x 2023 multiple that reflects Amazon’s structural e-commerce growth offset by a more volatile margin profile. Based on the Street’s $477 billion revenue estimate for 2023 (NA+International), this comes down to a fair value of $46 per share.
For AWS, markets are likely to move to the lower end of the valuation range as revenue slows down to the mid-20%’s or potentially lower. I’ve previously used Microsoft’s (MSFT) P/S multiple of 8x as a proxy to value AWS at ~$800 billion or $80/share based on 2023 revenue of just over $100 billion. However, considering the business is not immune to macroeconomic pressure, I believe a 6x P/S multiple would be more cautious. This comes down to a fair value of ~$60 based on 2023 revenue of $102 billion.
Company data, consensus estimates, Albert Lin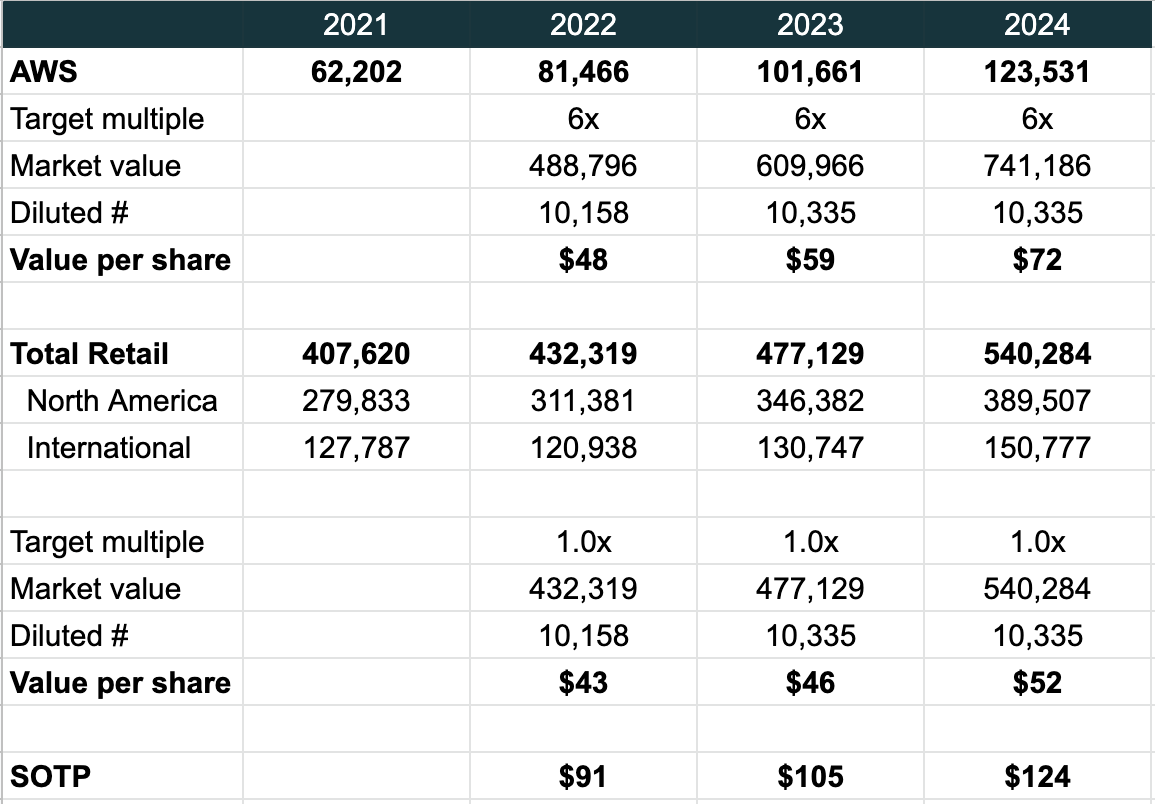
Altogether, we have fair value of $105/share based on Amazon’s 2023 estimates, with AWS accounting for 56% of the target price. Based on Friday’s closing price of $103.4, the upside seems limited. As a result, I would be more constructive on the stock should prices decline further into the $80-$90 range. That said, there’s also the risk that market’s valuation framework may shift from SOTP to P/E given the current macro narrative. In that scenario, Amazon is trading at an excessive 2023 P/E of ~55x, which is a massive premium to big tech peers including Microsoft (21x) Apple (AAPL) (23x), and Google (GOOG) (GOOGL) (17x).
Conclusion
Amazon is a dominant force in e-commerce and cloud but is not immune to macro challenges that may suggest lower investor enthusiasm on the valuation front. Based on a simple SOTP approach that values Amazon’s retail business at 1x and AWS at 6x 2023 revenue estimates, I believe Amazon has a fair value of $105, which implies limited upside and further price discounts necessary for markets to see an attractive risk/reward profile. Taking a conservative stance on identifying a potential entry point for the stock, I think $80 is the right place to start.
Be the first to comment