


sefa ozel
Amazon (NASDAQ:AMZN) is an amazing story and I have followed it from its beginning. I had some knowledge of the book publishing industry and underestimated Bezos and his leap from books to all of retail and even the cloud and streaming. Bezos was truly a genius CEO, not something I expected of a Wall Street analyst. I guess that is why he left Wall Street.
Now Bezos is no longer CEO. Even if he were, it might not help. However, look at how many times the founder of Starbucks (SBUX) has come back to save the company. I don’t think Bezos will come back, although he did it once.
Everyone loves using Amazon. Some have never known any other way to shop. Even the competition tries to give you that Amazon experience when you shop online. Costco (COST) and Walmart (WMT) are still untouched by Amazon. Of course all of retail is now facing a worldwide recession in 2023. They will all have to weather the storm and batten down the hatches.
Small investors sometimes suffer from the delusion that just because they love a company and its products and services, that it’s a good investment. It’s sometimes true, but not always. Companies just become so enormous and no longer can grow at greater than 20% each year. Apple (AAPL) is only growing at 8%.
AMZN growth is slowing and a worldwide recession presents real challenges for it going forward, as does inflation and supply line disruption. Therefore it’s no surprise that its price is dropping, looking for a bottom. However, in the past, AMZN has shown its amazing ability to cut costs and increase profits. It can easily revert from growth to higher profits to hit bottom and bounce back up.
AMZN is going down and looking for a bottom and we want to know how low it’s going. Here’s the monthly chart. The red, vertical line, Sell Signal occurred back in 2021 and was triggered by the Full STO signal shown at the bottom of the chart. Also shown at the bottom of the chart, AMZN:$SPX shows that AMZN was already underperforming the Index at the time of the Sell Signal. It has continued to underperform the Index since 2021, forcing portfolio managers to dump it. They won’t start buying until it starts outperforming the Index again.
You can see that AMZN had a nice bounce up from the $101 bottom to $147. Now it is back down retesting the bottom. Due to the dim outlook for 2023, we expect price to break below the current $101 bottom and go to $75 to form a bottom. We still have not seen the exhaustion selling with very high volume that usually marks the bottom. Although volume was almost four times average volume on Friday’s 6.8% drop in price.
Here’s the monthly chart showing the Sell Signals that were put in place in 2021. When they change to a Buy Signals, we will put AMZN back in our Model Portfolio.
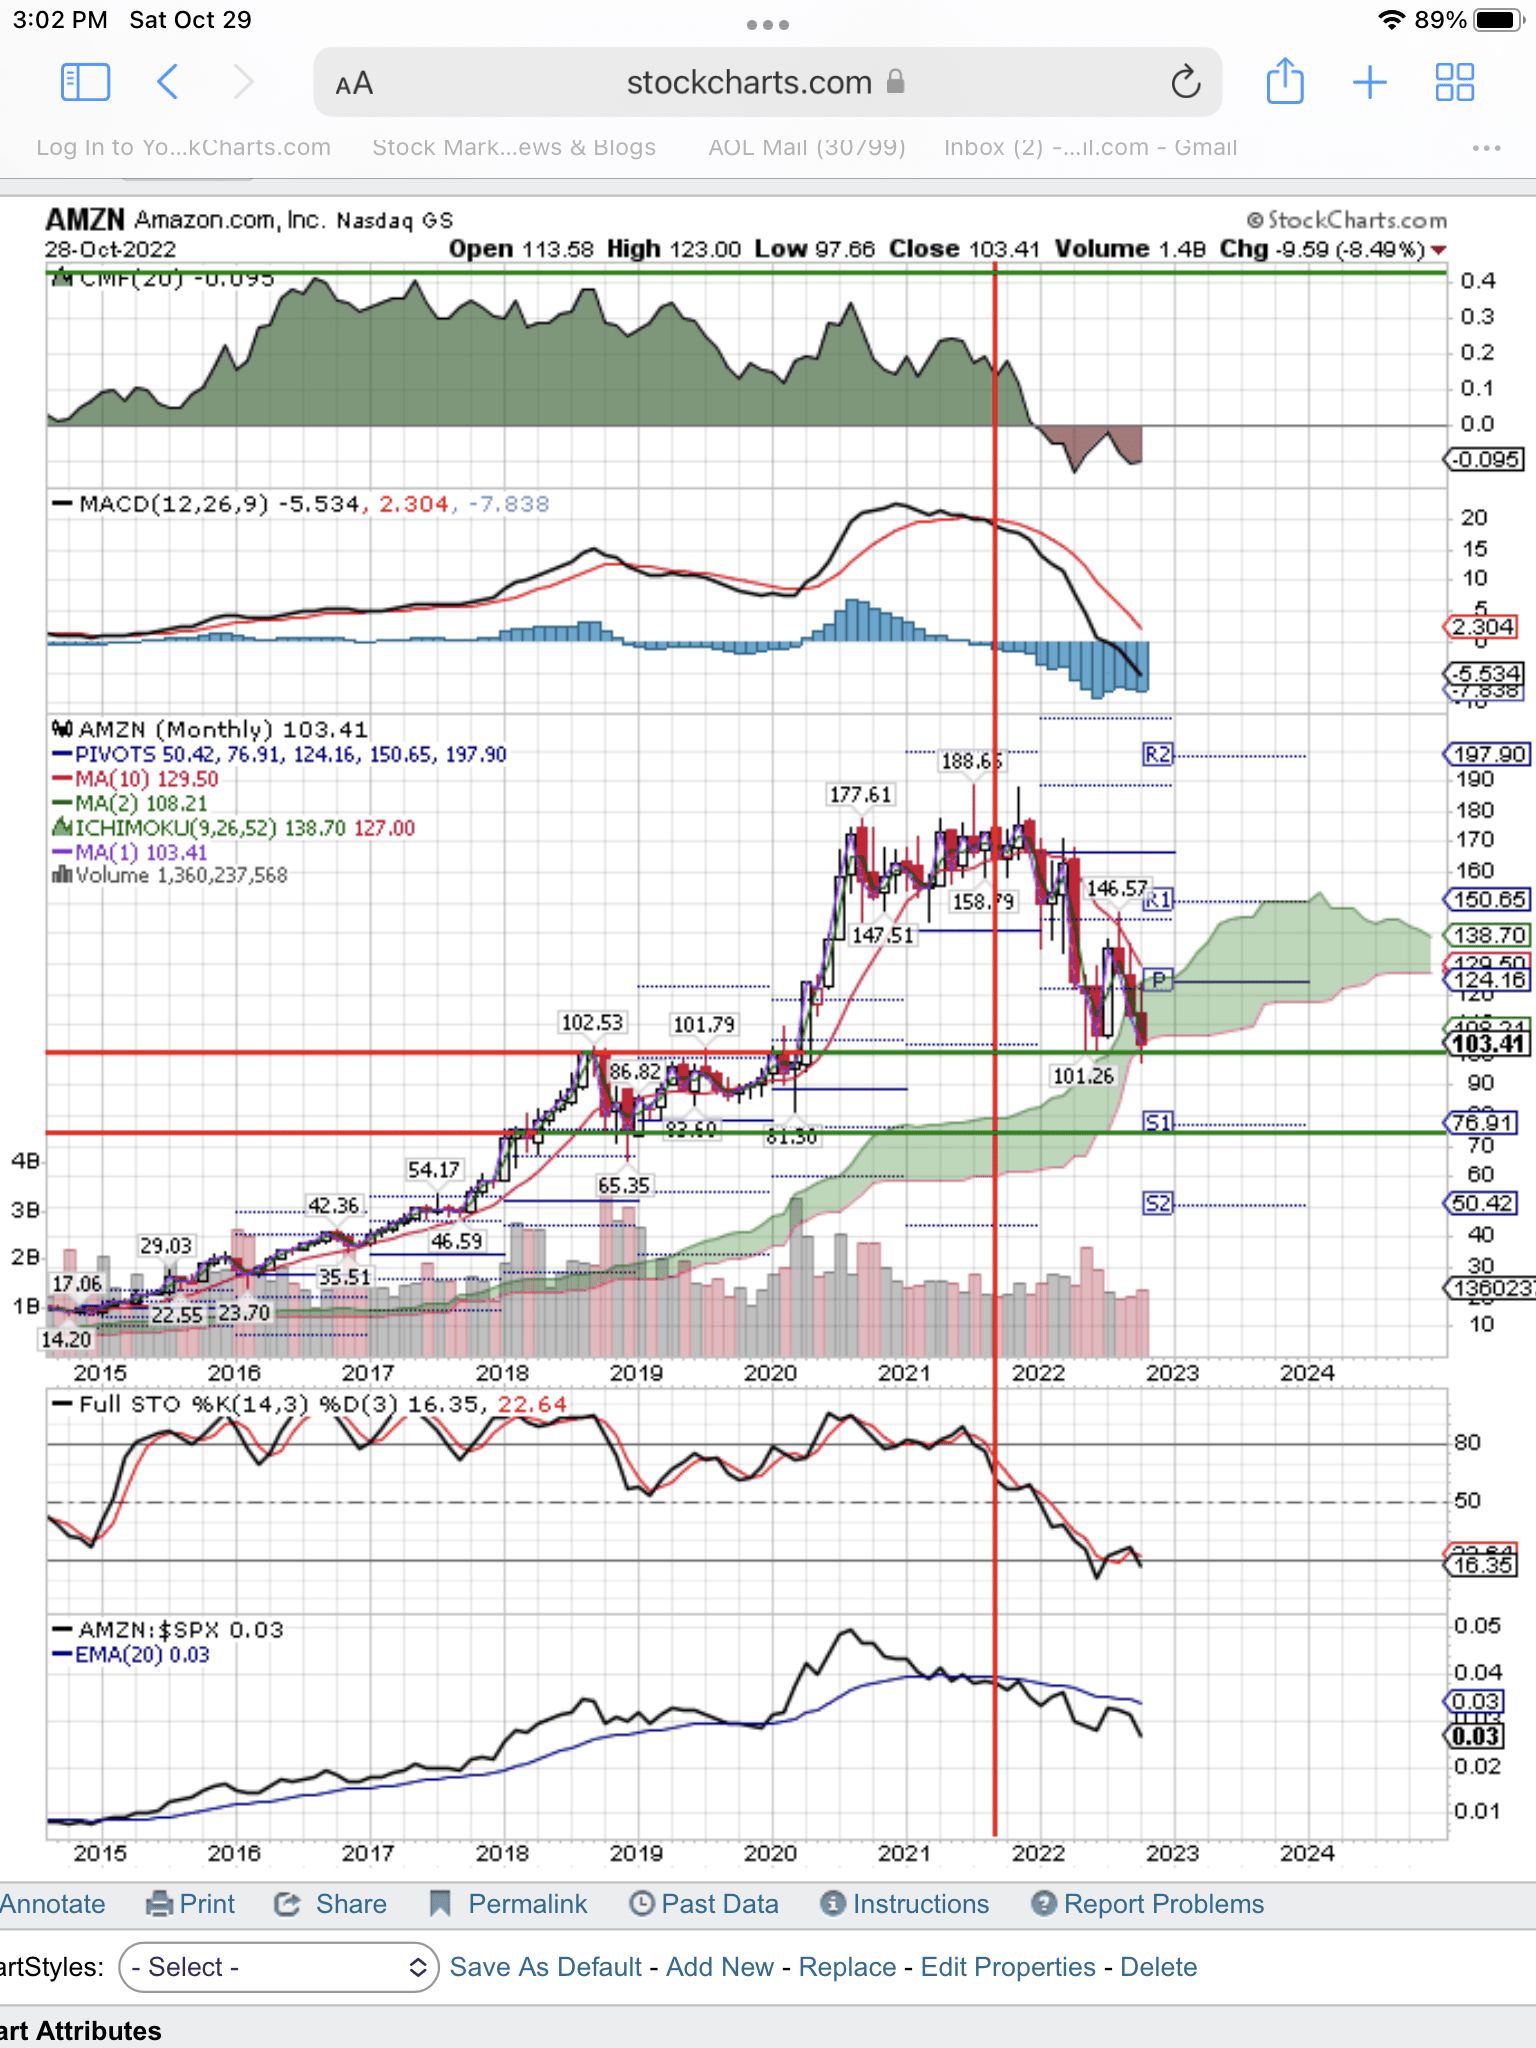
AMZN Testing $101 bottom (StockCharts.com)
In conclusion, AMZN just reported 15% growth in revenues. Let’s be generous and give it 25 PE on next year’s estimate earnings of $2.26. That gives us a price target of $57. Keep in mind that 90 days ago that earnings estimate was $2.50. Those earnings estimates are dropping. So you can see our target on the chart of $75 is quite possible in 2023. Wait for the bottom and the Buy Signal on the chart.
Be the first to comment