

4kodiak/iStock Unreleased via Getty Images
Amazon.com, Inc. (NASDAQ:AMZN) recently announced an 80% increase in its targeted number of layoffs. In October, the company said it would downsize by 10,000 employees worldwide. But as its stock price continued to erode, Amazon announced a second round of layoffs in January, bringing the total number of reductions to 18,000. Overall, the cuts amount to just 1.2% of Amazon’s total workforce.
The small number of Amazon employees who have unionized may grow in 2023, which could drive up labor costs. In 2022, workers at one of Amazon’s warehouses in Queens voted to unionize. However, votes to unionize in Albany and Staten Island failed. While it was a mixed bag of success for the Amazon Labor Union, the group says it will continue to bring organizing efforts to other facilities and that it wasn’t “going to rest until we rightfully get what we deserve.”
Amazon Web Services won two high-profile military contracts in 2022. The company landed a five-year cloud services deal with the United States Navy valued at $723.9 million. The Navy deal came just a few weeks after Amazon announced it was one of four vendors selected for a $9 billion dollar contract for cloud computing as part of Joint Warfighting Cloud Capability program. While Amazon’s delivery, video service, and personal assistant device, Alexa, get most people’s attention, Amazon Web Services (“AWS”) drives the company’s profitability. Amazon Web Services was responsible for $5.4 billion in operating profit in the third quarter of 2022, while the remainder of the company had $2.9 billion in operating losses.
When considering these current stories about Amazon, we need to determine which news topics will have a long-term and ongoing effect on the company and its share price. While the company has lost nearly half its value in 2022, many believe the stock price decline will be short-lived. Conversely, Amazon’s warehouse and infrastructure expansion has positioned the company with excess capacity that will allow it to grow without additional capital expenditures for years to come.
While current news stories, good or bad, can sway our opinion about investing in a company, it’s good to analyze the fundamentals of the company and to see where it’s been in the past and in which direction it’s heading.
This article will focus on the long-term fundamentals of the company, which tend to give us a better picture of the company as a viable investment. I also analyze the value of the company versus the price and help you to determine if AMZN is currently trading at a bargain price. I provide various situations which help estimate the company’s future returns. In closing, I will tell you my personal opinion about whether I’m interested in taking a position in this company and why.
Snapshot of the Company
A fast way for me to get an overall understanding of the condition of the business is to use the BTMA Stock Analyzer’s company rating score. Amazon has high scores for 10 Year Price Per Share, ROE, Earnings per share, Ability to Recover from a Market Crash or Downturn, and Gross Margin Percent. AMZN has a mediocre score for ROIC. It has a low score for PEG Ratio. A low PEG Ratio score indicates that the company may not be experiencing high growth consistently over the past 5 years. In summary, these findings show us that AMZN seems to have above-average fundamentals since most categories produce good scores.
Before jumping to conclusions, we’ll have to look closer into individual categories to see what’s going on.
BTMA Stock Analyzer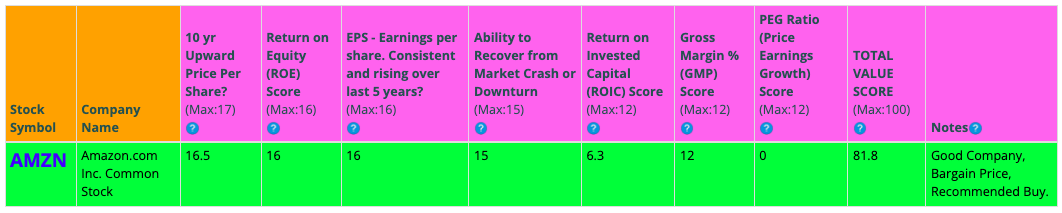
Fundamentals
Let’s examine the price per share history first. In the chart below, we can see that price per share has been mostly consistent at increasing over the last 10 years. From 2013 through 2021, share price grew by more than 10 times. But it was a rough 2022, with the stock’s price decreasing almost 50%. Overall, share price average has grown by about 571.45% over the past 10 years, or a Compound Annual Growth Rate of 20.97%. This is an excellent return.
Amazon’s wild stock price fall in 2022 is another tale of the COVID boom-to-bust cycle for so-called Pandemic “plays” by investors who helped propel Amazon’s stock price up by more than 80% from 2020 to 2021. Faced with lockdowns, consumers turned to Amazon to deliver products directly to their homes. Amazon’s Whole Foods unit also saw increased demand for its grocery delivery services. Amazon tried to keep up with surging demand by investing in building more warehouses and adding people to staff them. It also expanded its delivery partnership program, adding more third-party contractors to get packages from Amazon’s warehouses to consumers doorsteps. But as the lockdowns lifted, demand for delivery serves waned. Amazon quickly found itself overstaffed and with too much infrastructure. Amazon’s share price fell by almost 50% by the end of 2022, erasing all its valuation growth from the pandemic.
Morningstar.com
Earnings
Looking closer at earnings history, we see that earnings have consistently grown over the past 10 years, with growth every year since 2014.
Consistent earnings make it easier to accurately estimate the future growth and value of the company. So, in this regard, AMZN is a good example of a stock to accurately estimate future growth or current value.
BTMA Stock Analyzer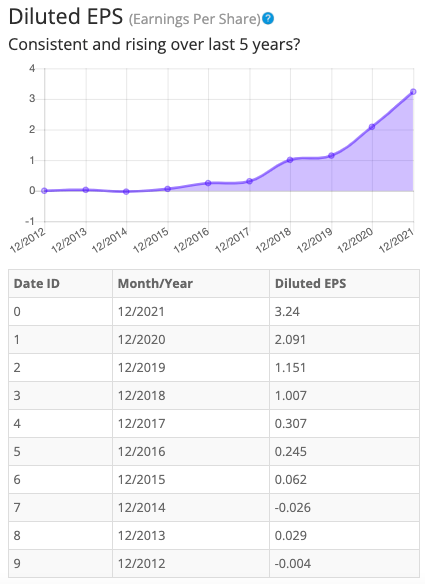
Since earnings and price per share don’t always give the whole picture, it’s good to look at other factors like the gross margins, return on equity, and return on invested capital.
Return on Equity
The return on equity has fluctuated, with a large increase in 2018 before falling in 2019. ROE rebounded in 2021 and grew marginally in 2021. Average ROE is above expectations at around 23.14% between 2017 and 2021. For return on equity (ROE), I look for a 5-year average of 16% or more. So, AMZN easily meet my requirements.
BTMA Stock Analyzer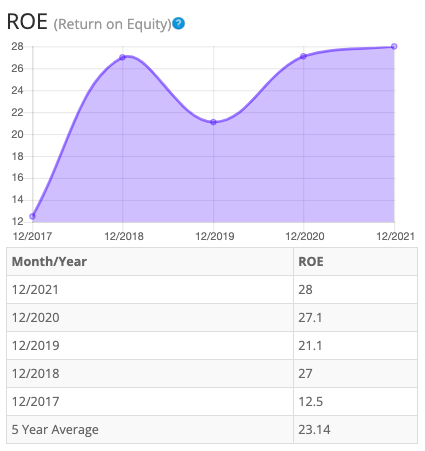
Let’s compare the ROE of this company to its industry. The average ROE of 63 Internet Retail companies is 2.54%.
Therefore, AMZN’s 5-year average of 12.6% and current ROE of 13.2% is well above average.
Return on Invested Capital
The return on invested capital has been inconsistent from 2017 to 2021. ROIC jumped in 2018 before falling in 2019. ROIC grew again in 2020 and remained flat in 2021 but never rebounded to the 2018 levels. 5-year average ROIC is below expectations at around 12.6%. For return on invested capital (ROIC), I also look for a 5-year average of 16% or more. So, AMZN fails to pass this test.
BTMA Stock Analyzer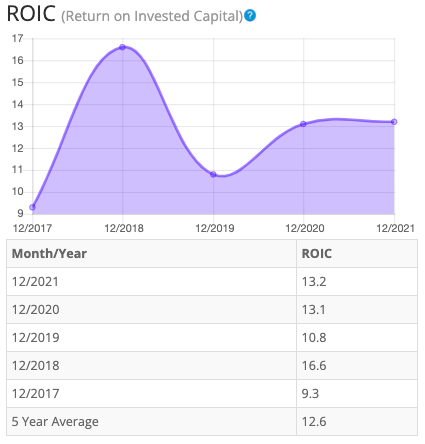
Gross Margin Percent
The gross margin percent (GMP) has mostly increased over the last five years. GMP grew in 2018 and 2019, but then dipped in 2020 before rebounding in 2021. Even at its lowest point in 2017, gross margin percent was at strong levels. Five-year GMP is good at around 39.98%. I typically look for companies with gross margin percent consistently above 30%. So, AMZN has proven that it has the ability to maintain acceptable margins over a long period.
BTMA Stock Analyzer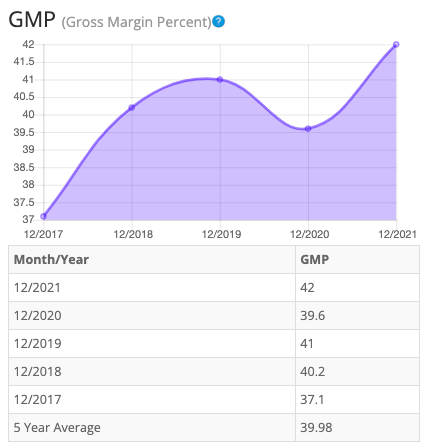
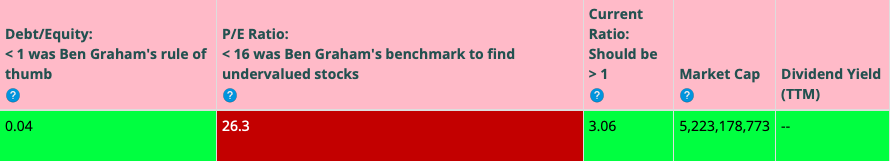
Looking at other fundamentals involving the balance sheet, we can see that the debt-to-equity is less than 1. This is usually a positive indicator, telling us that the company owns more than it owes.
AMZN’s Current Ratio of 0.936 is unsatisfactory, indicating it might not have an adequate ability to use its assets to pay its short-term debt.
Ideally, we’d want to see a Current Ratio of more than 1, so AMZN fails to exceed this amount.
According to the balance sheet, the company appears to be in less-than-ideal financial health. In the long term, the company has just enough assets to cover its debts. In the short term, the company is generating lots of cash, but has been on a spending spree of sorts fulfilling its obligations, investing in infrastructure and retiring some long-term debt.
AMZN does not currently pay a regular dividend.

This analysis wouldn’t be complete without considering the value of the company vs. share price.
Value Vs. Price
The company’s Price-Earnings Ratio of 75.75 indicates that AMZN is selling at a high price when comparing AMZN’s P/E Ratio to a long-term market average P/E Ratio of 15.
The 5-year average P/E Ratio of AMZN is 98.72. This indicates that AMZN could be currently trading at a low price when comparing to its average historical P/E Ratio.
BTMA Stock Analyzer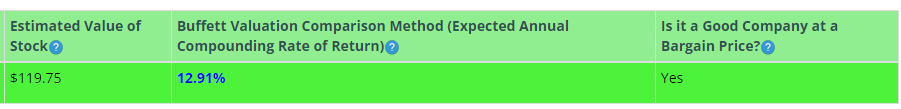
The Estimated Value of the Stock is $119.75, versus the current stock price of $86.08. This indicates that AMZN is currently selling at a bargain price.
For more detailed valuation purposes, I will be using the EPS TTM of 1.09. I’ve used various past averages of growth rates and P/E Ratios to calculate different scenarios of valuation ranges from low to average values. The valuations compare growth rates of EPS, Book Value, and Total Equity.
In the table below, you can see the different scenarios, and in the chart, you will see vertical valuation lines that correspond to the table valuation ranges. The dots on the lines represent the current stock price. If the dot is towards the bottom of the valuation range, this would indicate that the stock is undervalued. If the dot is near the top of the valuation line, this would show an overvalued stock.
BTMA Wealth Builders Club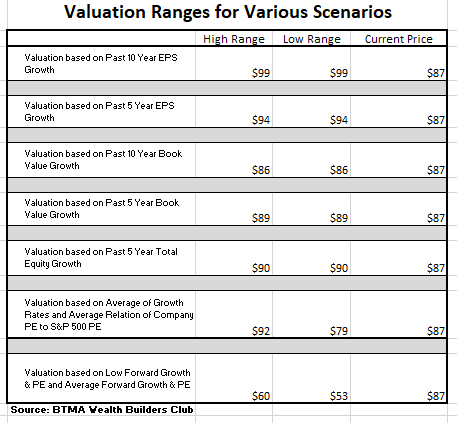
BTMA Wealth Builders Club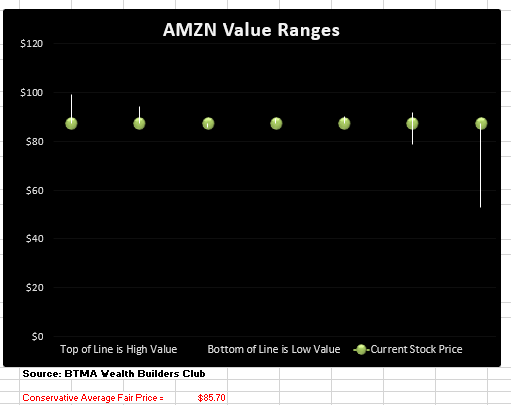
According to this valuation analysis, AMZN is about fairly-priced.
This analysis shows an average valuation of around $85.70 per share versus its current price of about $86.08, this would indicate that Amazon is fairly-priced.
Summarizing the Fundamentals
According to the facts, Amazon.com, Inc. is financially healthy in a long-term sense in having enough equity as compared with debt. In the short-term the current ratio indicates that company may not have enough cash to cover current liabilities. This is somewhat deceiving because of the company’s recent surge in spending on infrastructure and debt retirement.
This company has an impressive earnings record, which shows consistent and improving earnings over a 10-year period.
Other fundamentals are at excellent levels, including Gross Margins. The one fundamental that I’d like to see more improvement with is the ROIC.
In terms of valuation, my analysis shows that the stock is fairly-priced.
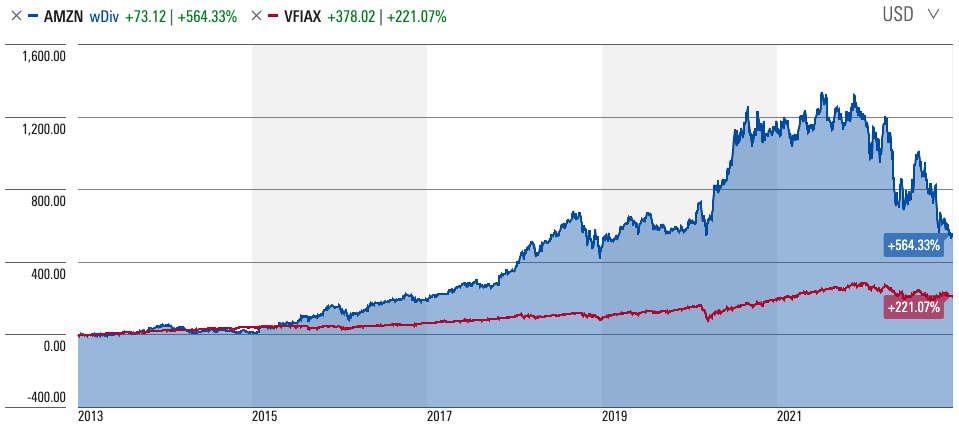
Amazon Vs. The S&P 500
Now, let’s see how AMZN compares versus the US stock market benchmark S&P 500 (SP500) over the past 10 years. From the chart below, we can see that AMZN has easily outperformed the general market. However, if you were to review AMZN’s performance in the last year, it’s fallen at a faster pace than the S&P 500. AMZN, until 2022, had been a high growth stock. And while all the added valuation from the surge during COVID has now evaporated, Amazon will likely continue to grow moving forward.
Forward-Looking Conclusion
Over the next five years, the analysts that follow this company are expecting it to grow earnings at an average annual rate of 26.0%.
In addition, the average one-year price target for this stock is at $137.98, which is about a 60% increase in a year.
The Expected Annual Compounding Rate of Return is 13.04%.
Does Amazon Pass My Checklist?
- Company Rating 70+ out of 100? YES (81.8)
- Share Price Compound Annual Growth Rate > 12%? YES (13.04%)
- Earnings history mostly increasing? YES
- ROE (5-year average 16% or greater)? YES (23.14%)
- ROIC (5-year average 16% or greater)? NO (12.6%)
- Gross Margin % (5-year average > 30%)? YES (39.98%)
- Debt-to-Equity (less than 1)? YES
- Current Ratio (greater than 1)? NO
- Outperformed S&P 500 during most of the past 10 years? YES
- Do I think this company will continue to successfully sell their same main product/service for the next 10 years? YES
Amazon scored 8/10 or 80%. Therefore, Amazon is worth considering as a potential investment!
Is Amazon currently selling at a bargain price?
- Price Earnings (TTM) less than Amazon’s 5-year average P/E Ratio 98.72?YES (TTM 75.75 < 98.72 Five Year Average PE Ratio)
- Estimated Value greater than Current Stock Price? YES (Value $119.69 > $86.08 Stock Price).
Valuation metrics suggest that Amazon might be selling at a bargain price as indicated by the Estimated Value. Also, Amazon’s P/E Ratio TTM is less than the 5-year average P/E Ratio.
For me, the choice is certain. I will certainly add Amazon to my watchlist of stocks to consider investing in because it ticked most of my boxes in my checklist. It’s certainly a good company according to the fundamentals.
Amazon is a deceiving stock to analyze according to normal standards. This is because Amazon is not your normal company. For example, according to standard analysis methods, a P/E Ratio of 15 or less would indicate a bargain-priced stock. But, Amazon’s average P/E Ratio is around 100, therefore, it’s better in some cases to compare Amazon to its own past performance in order to get a better idea of what its current situation is.
As a value investor, considering typical analysis methods, I would say that Amazon is still overpriced and could fall further. But the company is so popular and is usually favorably priced by the market, so it’s unlikely that Amazon’s share price will see large discounts for any extended time.
This could be a good time to grab some shares of this “league of its own” company at a fair price and to possibly buy more if the Amazon should fall more.
Be the first to comment