

benimage/E+ via Getty Images
Investment Thesis
It took a while, but the ALPS Sector Dividend Dogs ETF (NYSEARCA:SDOG) finally outperformed the SPDR S&P 500 ETF (SPY) since my bullish March 2021 review. I’m not here to take a victory lap, though. On the contrary, SDOG was a relatively poor performer among its high-dividend peers. In retrospect, I underestimated the challenges SDOG’s low-growth constituents would experience during a mostly bullish 2021. I hope to right that wrong with this article and provide additional insight into the factors I believe will move markets this year. As the title suggests, sometimes it’s best to let sleeping dogs lie, and I don’t recommend getting involved with SDOG today.
ETF Overview
Strategy & Fund Basics
SDOG tracks the S-Network Sector Dividend Dogs Index, selecting the top five dividend-paying S&P 500 stocks in each of the ten sectors, excluding Real Estate. It takes an equal-weight-by-sector approach, guaranteeing an excellent level of diversification even for such a small fund. However, the Index performs no other screens. S-Network summarizes this simplified approach below. Yield-focused investors will like the virtual guarantee of a high dividend payment each quarter, while those more cautious might be wary of buying into a potential yield trap.
S-Network Global Indexes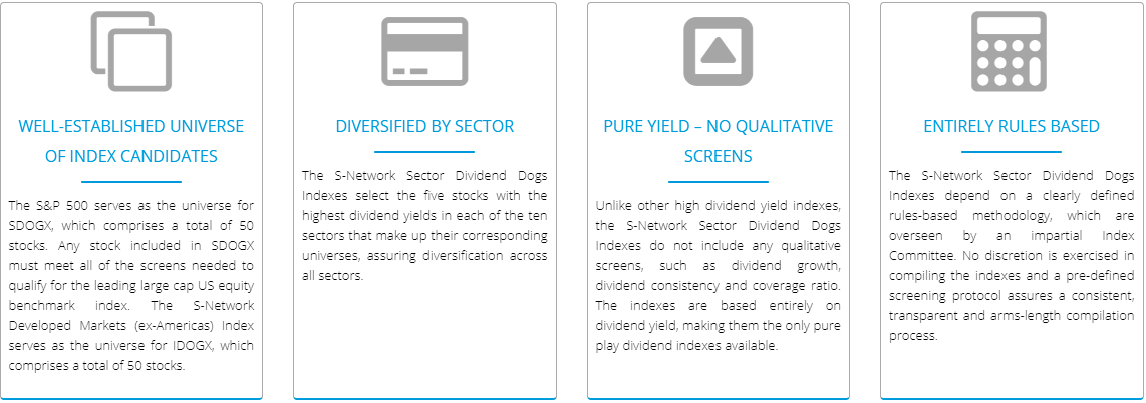
Before we look at the exposure levels, I’ve listed some of SDOG’s descriptive statistics below.
- Current Price: $57.45
- Assets Under Management: $1.31 billion
- Expense Ratio: 0.40%
- Launch Date: June 29, 2012
- Trailing Dividend Yield: 3.48%
- Three-Year Dividend CAGR: 9.01%
- Five-Year Dividend CAGR: 7.10%
- Dividend Frequency: Quarterly
- Five-Year Beta: 1.12
- Number of Securities: 50
- Portfolio Turnover: 54% (48%, 61%, 55%, 77% From 2017-2020)
- Assets in Top Ten: 21.93%
- 30-Day Median Bid-Ask Spread: 0.05%
- Tracked Index: S-Network Sector Dividend Dogs Index
- Short-Term Capital Gains Tax Rate: 40%
- Long-Term Capital Gains Tax Rate: 20%
- Tax Form: 1099
SDOG’s 0.40% expense ratio is pricey for such a straightforward strategy. You may be able to skim the Index to avoid these fees, but you’ll likely incur additional taxes should you wish to rotate into the highest-yielding stocks regularly. As an ETF, this isn’t a concern.
Readers may be surprised at SDOG’s five-year beta of 1.12. Given the amount of turnover the ETF has experienced over the last five years, I can confirm this isn’t the case for the current portfolio. The weighted-average five-year beta is 0.95, meaning SDOG’s expected volatility is slightly less than the market.
Sector Exposures & Top Ten Holdings
SDOG’s sector exposures are below, confirming its equal-weight-by-sector approach. I’ve also included SPY, the Invesco S&P 500 Equal Weight ETF (RSP), and the Invesco Dow Jones Industrial Average Dividend ETF (DJD) for comparison purposes.
Morningstar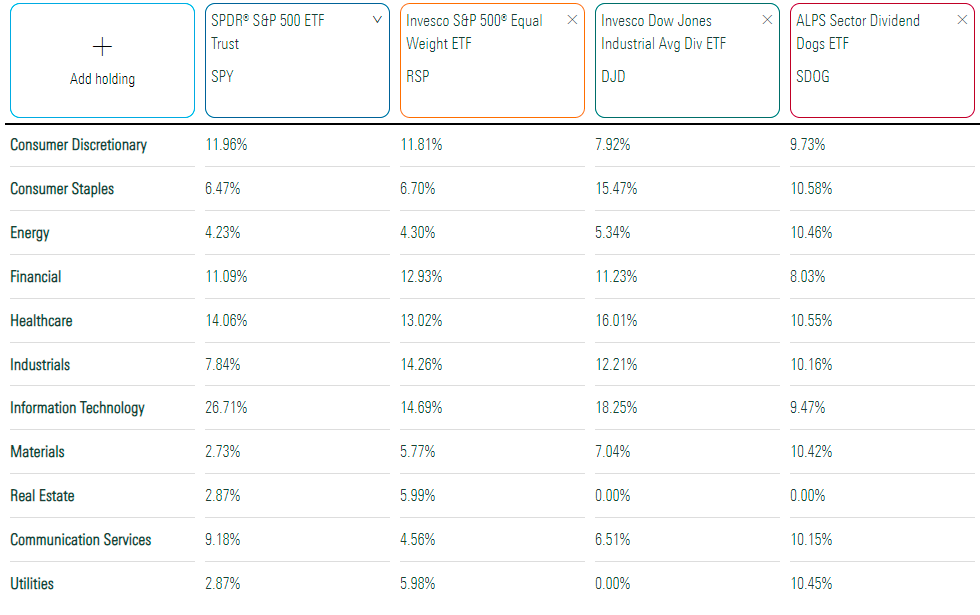
SDOG’s top ten holdings are shown below. However, not much can be gleaned from this list since they all have about the same weights. In my fundamental analysis later, I’ll examine SDOG at the industry level to assess quality and growth potential.
S-Network Global Indexes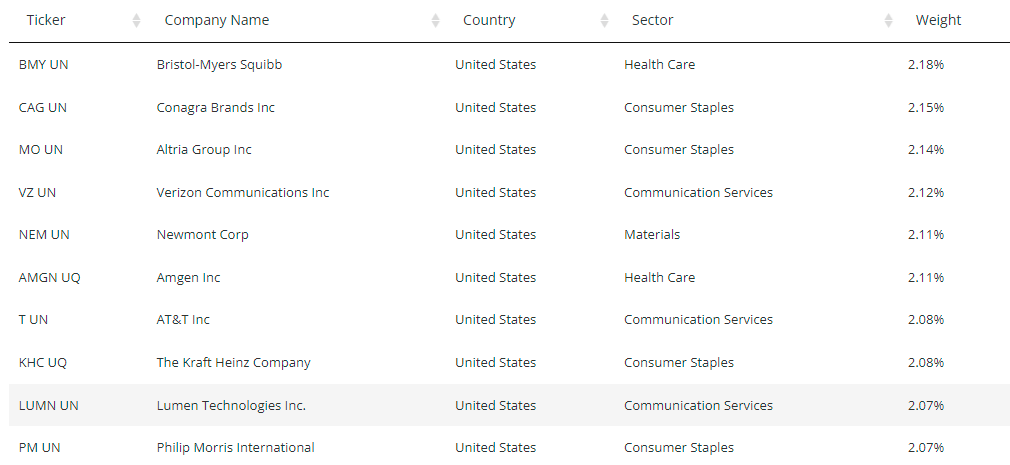
Historical Performance
Since its inception, SDOG has underperformed SPY and RSP by 2.61% and 2.16% per year, respectively. Volatility was higher, as indicated by the standard deviation figure, and the Q1 2020 drawdown was significant at 32.11%. High-dividend ETFs did not perform well during that crash, as investors turned to “pandemic-friendly” stocks rather than the deeply-discounted variety SDOG holds.
Portfolio Visualizer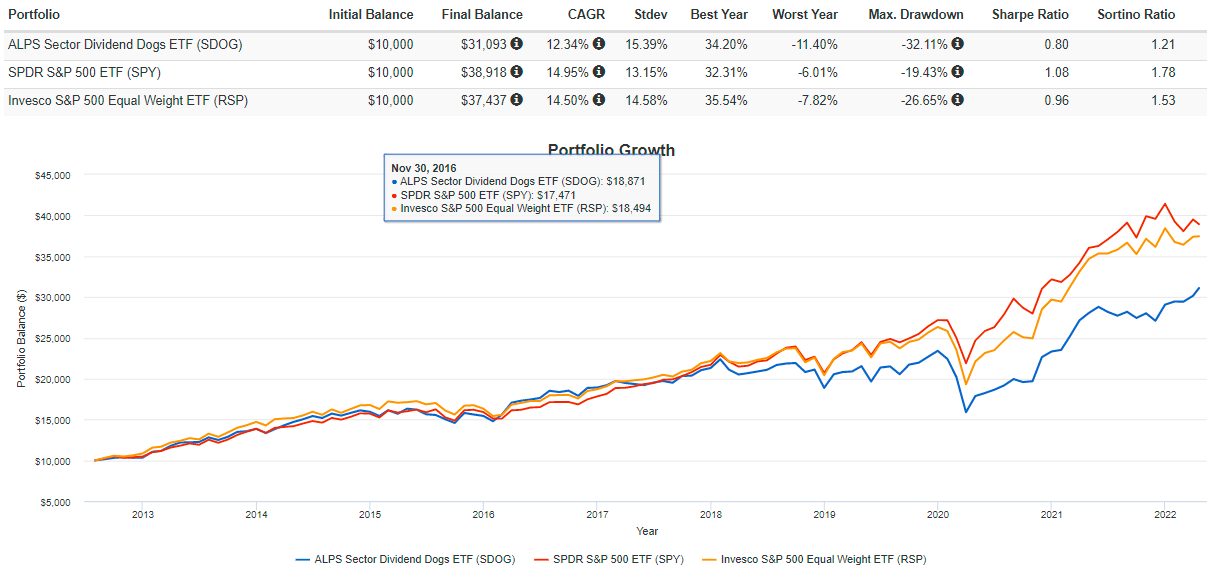
However, high-dividend ETFs have been making a comeback lately. The chart below reflects SDOG’s performance since April 2021, showing an annualized gain of 13.34%. YTD, SDOG has outperformed SPY by 13%, so the strategy seems to have momentum.
Portfolio Visualizer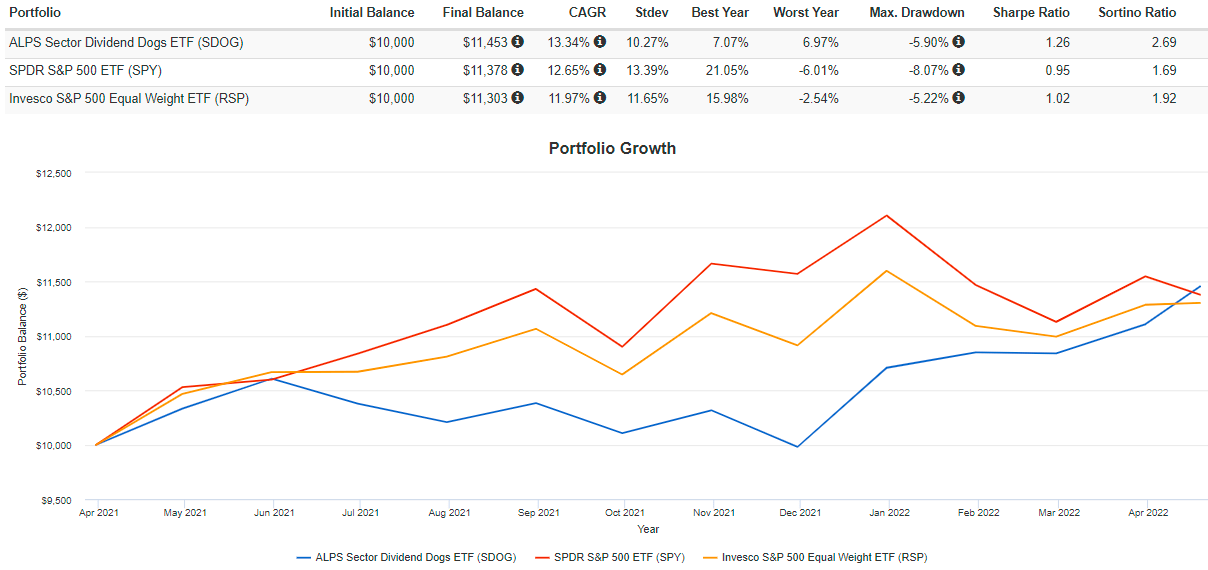
Despite the comeback, SDOG hasn’t performed well against its peers. Below are periodic performances for all the high-dividend U.S. equity ETFs I track. SDOG ranks #12, #16, and #17 out of 21 ETFs in the last three, six, and twelve months. In addition, over the previous nine years (roughly when it launched), SDOG ranks #5 out of 11 ETFs with enough history. SDOG doesn’t stand out no matter what period you analyze, indicating its approach probably isn’t ideal.
The Sunday Investor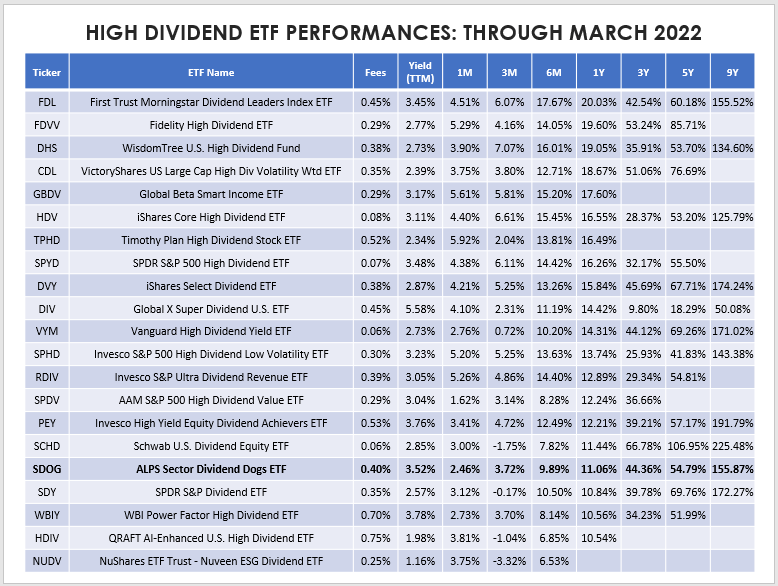
Fundamental Analysis
Snapshot By Industry
Diversifying by sector is one thing, but an industry-level look is more revealing. SDOG has holdings across 32 industries, but the top 20 account for nearly 80% of the ETF. I’ve listed them below, with the Electric Utilities industry accounting for SDOG’s entire exposure to the sector.
The Sunday Investor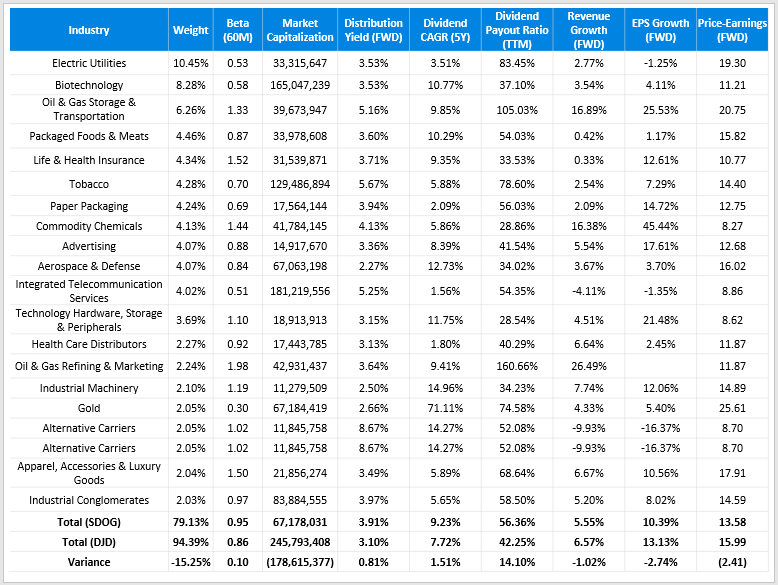
Compared with DJD, SDOG has the edge on dividends. Its constituents currently yield 3.91% (3.51% after fees), which is about the same as the fund’s trailing yield and also one of the highest in its category. You can find higher yields with ETFs like DIV, WBIY, PEY, and FDL, but you’ll still be burdened with an elevated expense ratio. Dividend investors should seek to lower their fees as much as possible since they directly reduce distributions.
SDOG’s constituents also have a slightly better five-year dividend growth rate (9.23% vs. 7.72%), and a lot of the historical growth has come from Energy stocks. Stocks in the Aerospace & Defense industry like Huntington Ingalls Industries (HII) and Lockheed Martin (LMT) are also reliable from a dividend growth perspective, and it’s worth noting that 50% of SDOG’s holdings are also in the Invesco Dividend Achievers Portfolio ETF (PFM). This ETF’s Index requires ten consecutive years of dividend increases, so I think the SDOG’s dividends are in good shape.
While SDOG scores well on yield and dividend growth, it scores poorly on revenue and earnings growth. It’s these two factors I underestimated last year, as my timing of when high-dividend stocks would start outperforming was off. SDOG’s forward revenue growth rate of 5.55% ranks #17 out of 21 high-dividend ETFs listed above. Its 10.39% forward EPS growth rate ranks #13, so while that’s a bit of an improvement, the overall theme is consistent: better options are available.
Finally, SDOG scores well on valuation, with a forward price-earnings ratio of just 13.58. It’s one of the cheapest high-dividend ETFs available, second only to the WBI Power Factor High Dividend ETF (WBIY). While this is a clear advantage, it introduces the same timing risk I previously underestimated. If the market continues its lean into value stocks, SDOG will do well. However, getting the timing right is tricky, and I recommend a more balanced approach.
Snapshot By Company
We’ve covered SDOG’s top 20 industries, but now I’d like to look at historical returns for its holdings. The table below highlights SDOG’s top two stocks from each sector, so hopefully, it’s fairly representative.
The Sunday Investor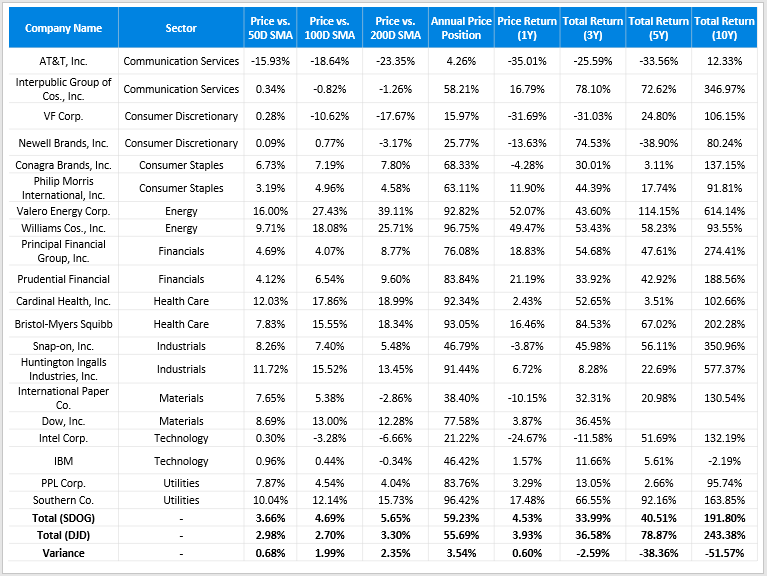
This table shows that SDOG’s and DJD’s components have performed similarly over the last three years. Their weighted-average prices against their moving average prices are nearly the same, as are their total returns for the previous three years (33.99% vs. 36.58%). However, they diverge at the five-year and ten-year mark, suggesting that SDOG’s components were long-term underperformers. AT&T’s figures aren’t entirely accurate due to the spin-off of their media business, but others, including Newell Brands (NWL), Philip Morris (PM), and IBM (IBM), have disappointing track records. You buy them for the dividends, but their single-digit EPS growth rates won’t help much otherwise.
It’s easy to find poor performers in any ETF, but SDOG doesn’t stand out against its peers. After evaluating the historical records for all 21 high-dividend ETFs listed earlier, SDOG ranks #13. If you’re looking for stocks with a great long-term track record, I suggest looking into the Schwab U.S. Dividend Equity ETF (SCHD) or the Vanguard High Dividend Yield ETF (VYM). While past performance doesn’t guarantee future returns, it does suggest a superior strategy. SCHD and VYM have rock-bottom expense ratios, too, so if you can forego an extra percent in yield, it makes sense to buy them.
Investment Recommendation
Last March, I forecasted a comeback for high dividend stocks. It eventually happened, but my timing was off, and that’s the risk I want readers to acknowledge. My current view of the markets is that high dividend and value ETFs will continue to outperform, but that doesn’t mean buying the highest-yielding or cheapest ETF by P/E is the way to go. Insist on buying a fund with solid growth potential, too. Call it a backup plan if the market doesn’t see things your way.
In the last year, I have benefited from having a deeper understanding of all dividend ETFs and am now able to recommend better alternatives. SDOG ranks poorly against its peers in many categories, including estimated revenue and earnings per share growth rates, fees, and performance. It’s the cheapest by P/E, but that’s about it. In my experience, investing at the extremes rarely works out, so I’m downgrading my rating on SDOG to hold, and I hope you can use my list of alternatives to find a better solution.
Be the first to comment