


ThomasVogel/iStock via Getty Images
This article was published on Dividend Kings on Tuesday, Jan. 3, 2023.
2022 was a bad year for stocks, a terrible year for bonds, and a pretty lousy year for investors in general.
In fact, it was the first year in US market history that stocks and bonds fell double digits.
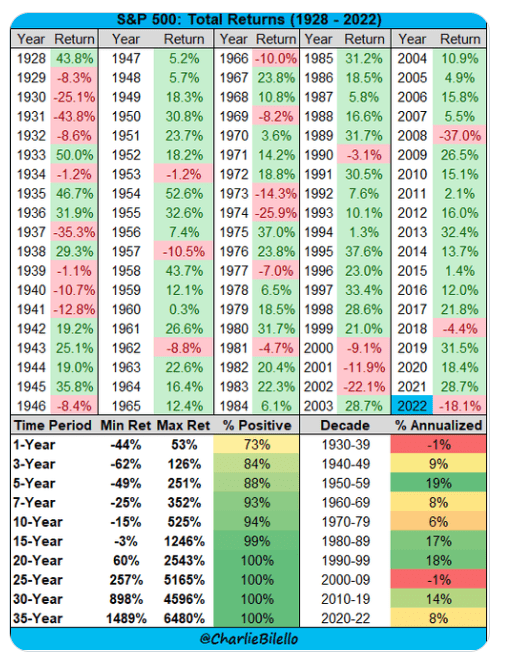
Charlie Bilello
Stocks fell 18%, bonds fell 14%, and there were few places to hide other than energy and managed futures.
But it’s important to remember that over the long-term there’s no better asset class to own. In fact, the worst 35-year return for stocks ever recorded was a 16X return.
So does that mean that 2023 is likely to be a better year for investors? Yes, in the sense that -18% on the S&P is an easy bar to clear. But the first half of 2023 could be rather challenging.
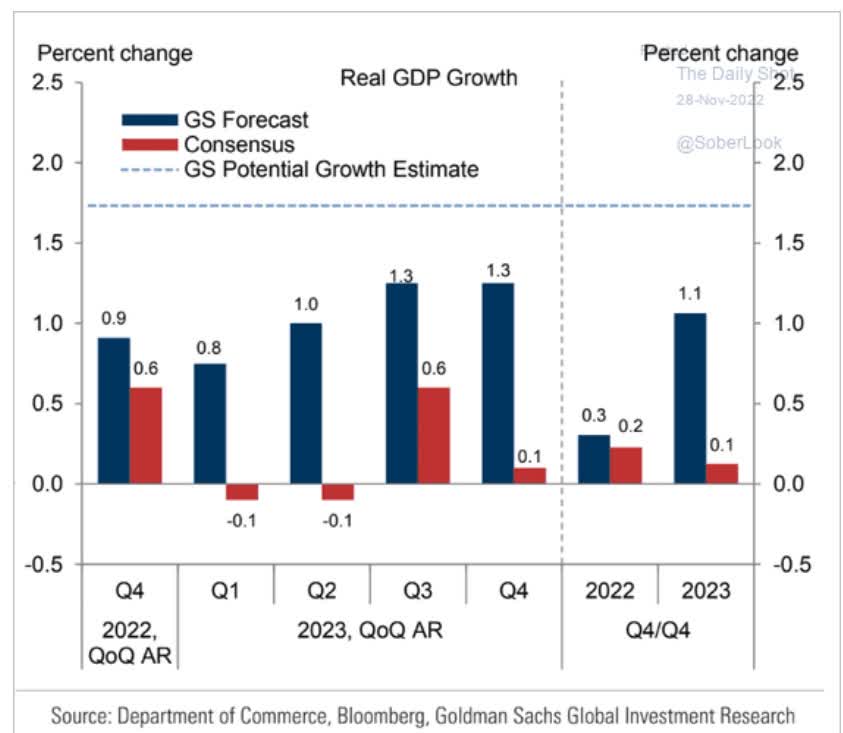
Daily Shot
Economists are expecting the mildest recession in US history to begin in Q1, and both the bond market and economic data agree with this assessment.
The bad news is that economists almost always underestimate the magnitude of recessions. Fortunately, it’s still likely to be a mild recession compared to the average GDP decline of 1.4% since WWII.
So what does the recession mean for earnings and stocks in 2023?
S&P Bear Market Bottom Forecast Range
| Earnings Decline In 2023 | 2023 S&P Earnings | X 25-Year Average PE Of 16.7 | Decline From Current Level |
| 0% | $218.46 | $3,648.28 | 5.0% |
| 5% | $207.54 | $3,465.87 | 9.7% |
| 10% | $196.61 | $3,283.45 | 14.5% |
| 13% (Historically average/median EPS decline) | $190.06 | $3,174.01 | 17.3% |
| 15% | $185.69 | $3,101.04 | 19.2% |
| 20% | $174.77 | $2,918.63 | 24.0% |
(Source: DK S&P 500 Valuation Tool)
The blue-chip economist range for earnings growth in 2023 is between 0% and 20%, far lower than the bottom-up consensus from individual company analysts.
This likely means the S&P has a way to fall before we finally bottom out with a final bear market consensus range of 3,000 to 3,400.
This is expected to happen in the first half of the year, with the consensus being in Q1, following peak earnings pessimism after Q1 earnings season.
Why Q1 earnings season? Because 2023 guidance is likely to be highly conservative, as management teams try to set a low bar they can easily clear this year.
Earnings estimates tend to follow changes in guidance, and by the end of February, we’ll have most of the S&P offering 2023 guidance and should see earnings expectations fall quickly.
The good news is that stocks almost always bottom long before earnings do or even the economy.
Historically the stock market bottoms halfway through a recession, which coincides with the end of Q1, when most blue-chip economists expect the market to bottom and begin a new bull market.
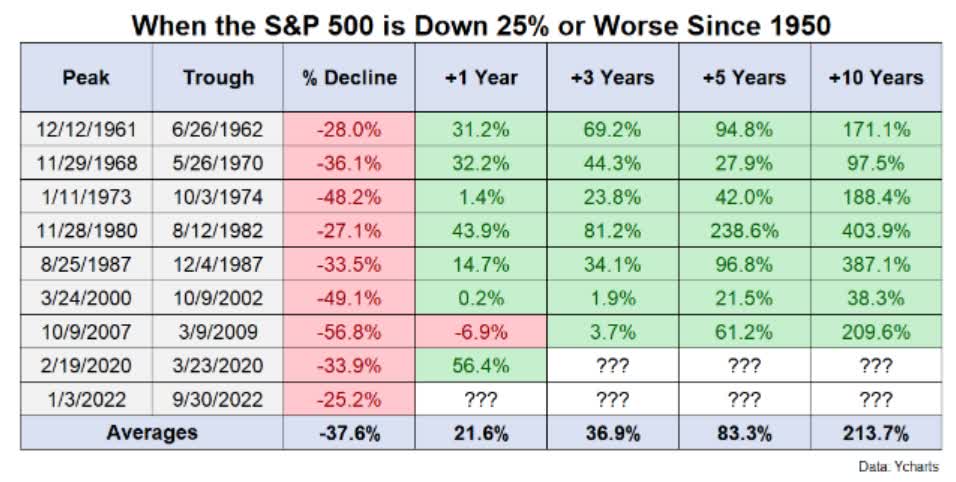
Ben Carlson
The bottom line is that if you buy blue chips in a bear market like this one, you’re likely to be very happy within a year or more. The next bull market could deliver over 3X returns over the coming decade, you just need to be invested to enjoy this bounty.
Today I want to highlight two 5%-plus yielding new year blue-chip bargains, Brookfield Renewable Partners (BEP) (BEPC) and Bank of Nova Scotia (BNS).
BEP and its corporate version BEPC are potentially attractive recession-resistant high-yield options that could do relatively well in a tough start to the year. BNS is a great way to profit from the coming economic recovery and start of a new bull market.
Brookfield Renewable: A Great Way To Cash In On A Potential $150 Trillion Goldrush
Tax Implications
BEP is a K1 issuing limited partnership that yields a safe 5.1%, and BEPC is the corporate version that yields a safe 4.6% and pays qualified dividends.
According to Brookfield, which is a Canadian company, BEP investors should expect approximately a 7.5% distribution withholding in taxable accounts.
BEPC investors should expect a 15% withholding in taxable accounts.
There’s a tax credit available in taxable accounts to recoup the withholding.
Why BEP Is A Potentially Great Choice For The First Half Of 2023
Why is BEP or BEPC a potentially attractive 5% yielding blue-chip option for 2023? Because its business model is that of a green energy utility, one of the most recession-resistant business models on Wall Street.
More exciting is the fact that green energy is a potential $150 trillion investment opportunity over the next 30 years.
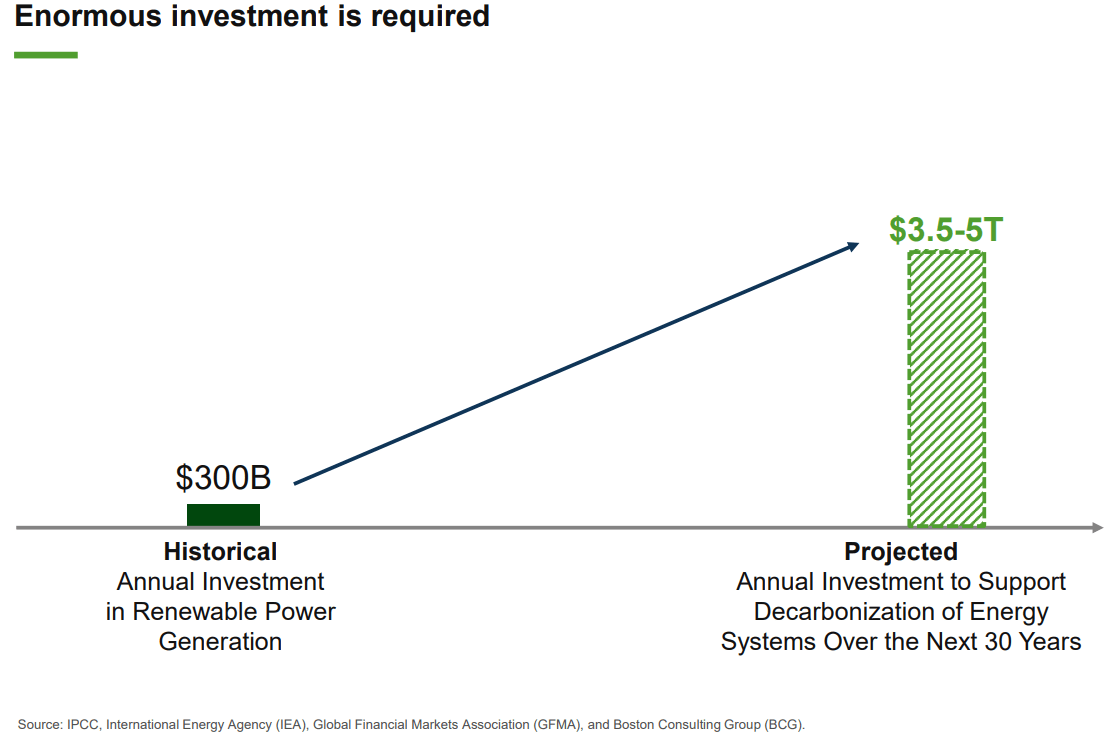
Investor presentation
In the next three decades, Brookfield, and various analyst firms, think that annual investment in green energy could soar by 12X to 17X, to $3.5 to $5 trillion… per year.
With governments around the world burdened by large amounts of debt, most of this essential energy investment will come from the private sector. And when it comes to green energy, no one on earth does it better than Brookfield.
With nearly $68 billion in assets under management across all major technologies, Brookfield Renewable is a leading owner, operator, and developer of clean energy.” – Brookfield Renewable
Brookfield Renewable is part of the $800 billion Brookfield empire and has $68 billion in assets under management.
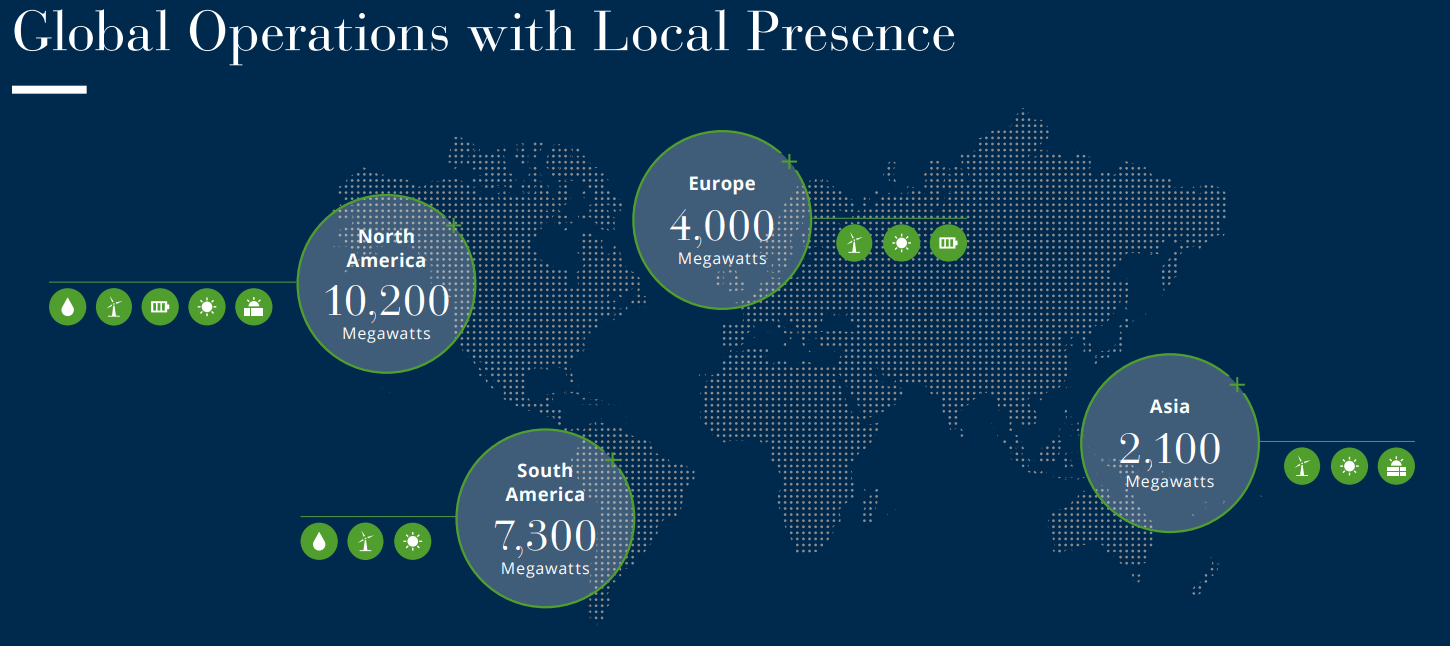
Investor presentation
Brookfield already owns 23.1 GW of green energy capacity worldwide and is one of the earth’s most diversified green energy utilities.
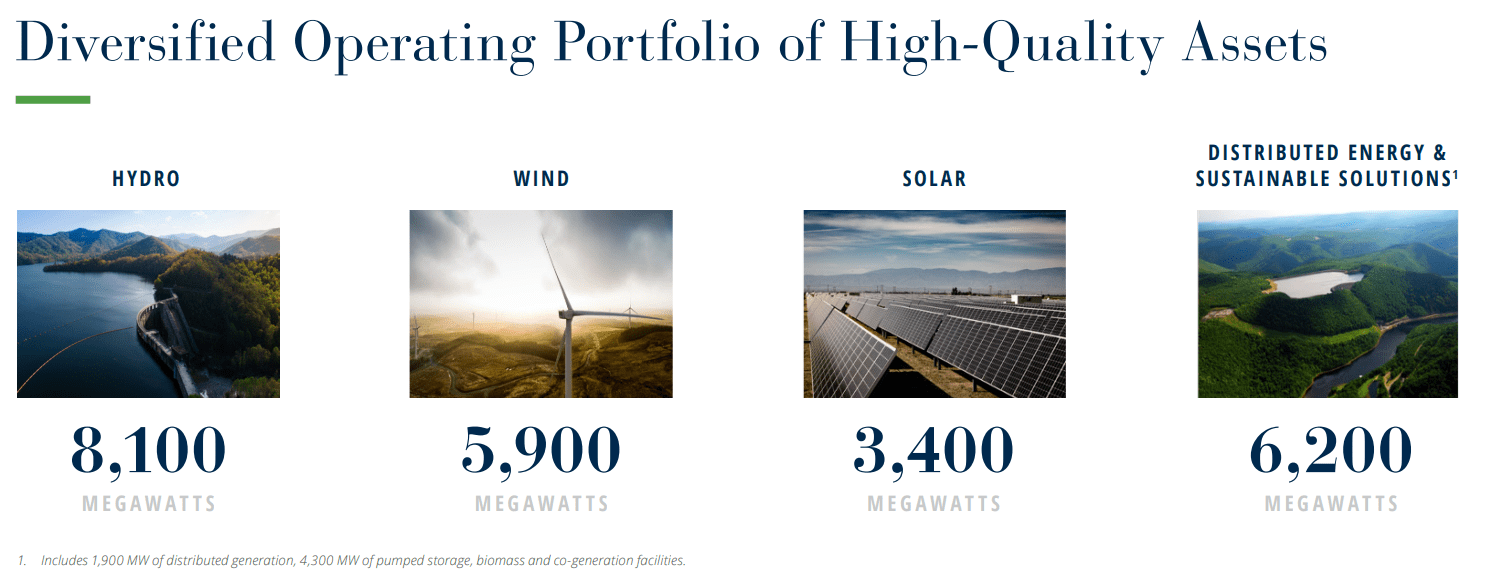
Investor presentation
BEP has its finger in every part of the green energy pie, including hydro, wind, solar, and energy storage.
It sells its power to local utilities under long-term power purchase agreements or PPAs, which have an average of 14 years under contract.
Investor presentation
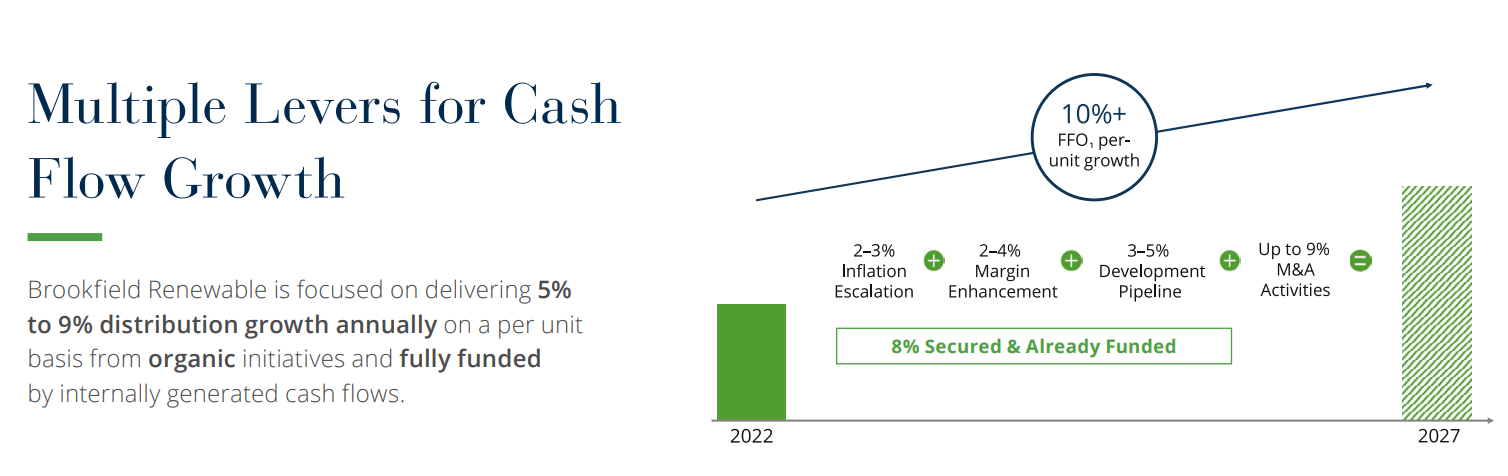
BEP plans to grow its dividends and distributions by 5% to 9% over time as it retains more cash flow to fund faster growth. Growth that management thinks could be double digits over the long term.
Most utilities don’t offer anything close to a 5% yield. And almost none are growing at double-digits (11.2% analyst consensus).
BEP Rolling Returns Since 2005
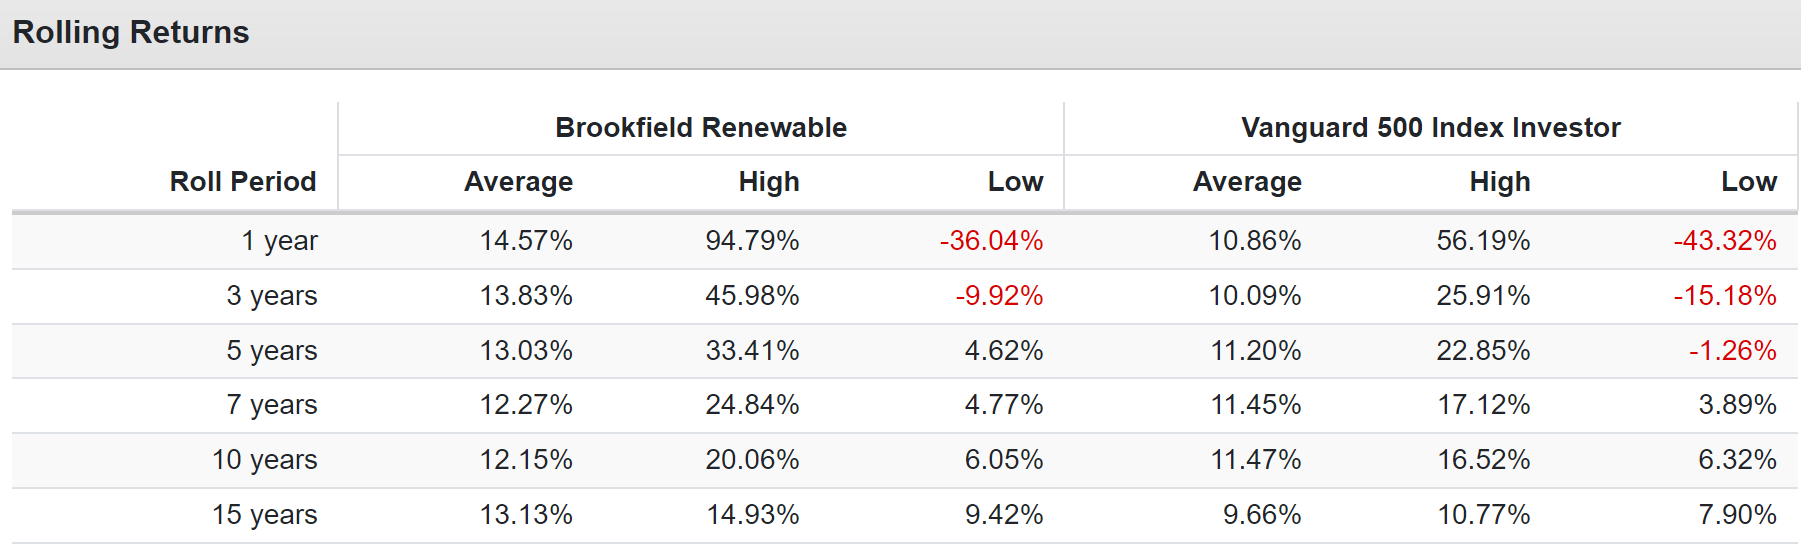
Portfolio Visualizer Premium
BEP is the oldest yieldCo on Wall Street, IPOing 17 years ago. Since then its average annual-rolling return of almost 15% has run circles around the S&P, other utilities, and almost any other investment strategy.
And in the future, management thinks it can keep delivering 15% to 16% annual returns, thanks to a potential $150 trillion gold rush into clean energy.
And we’re not talking about just five or 10 years of returns on par with the greatest investors in history, but potentially 15% to 16% returns for the next 30 to 50 years.
Reasons To Potentially Buy Brookfield Renewable Today
| Metric | Brookfield Renewable |
| Quality | 82% 13/13 Blue-Chip Quality |
| Risk Rating | Very High Risk |
| DK Master List Quality Ranking (Out Of 500 Companies) | 280 |
| DK Master List Quality Percentile | 45% |
| Dividend Growth Streak (Years) | 12 |
| Dividend Yield | 5.1% |
| Dividend Safety Score | 85% |
| Average Recession Dividend Cut Risk | 0.5% |
| Severe Recession Dividend Cut Risk | 1.80% |
| S&P Credit Rating |
BBB+ Stable Outlook |
| 30-Year Bankruptcy Risk | 5.00% |
| LT S&P Risk-Management Global Percentile |
2% Terrible, Very High Risk |
| Fair Value | $31.48 |
| Current Price | $25.34 |
| Discount To Fair Value | 19% |
| DK Rating |
Potential Reasonable Buy |
| P/cash flow | 5.9 |
| Historical P/cash flow | 6 to 7 |
| LT Growth Consensus/Management Guidance | 11.2% |
| 5-year consensus total return potential |
11% to 19% CAGR |
| Base Case 5-year consensus return potential |
18% CAGR (About 3X The S&P 500) |
| Consensus 12-month total return forecast | 45% |
| Fundamentally Justified 12-Month Return Potential | 19% |
| LT Consensus Total Return Potential | 16.3% |
| Inflation-Adjusted Consensus LT Return Potential | 13.9% |
(Source: Dividend Kings Zen Research Terminal)
Brookfield Renewable 2025 Consensus Potential
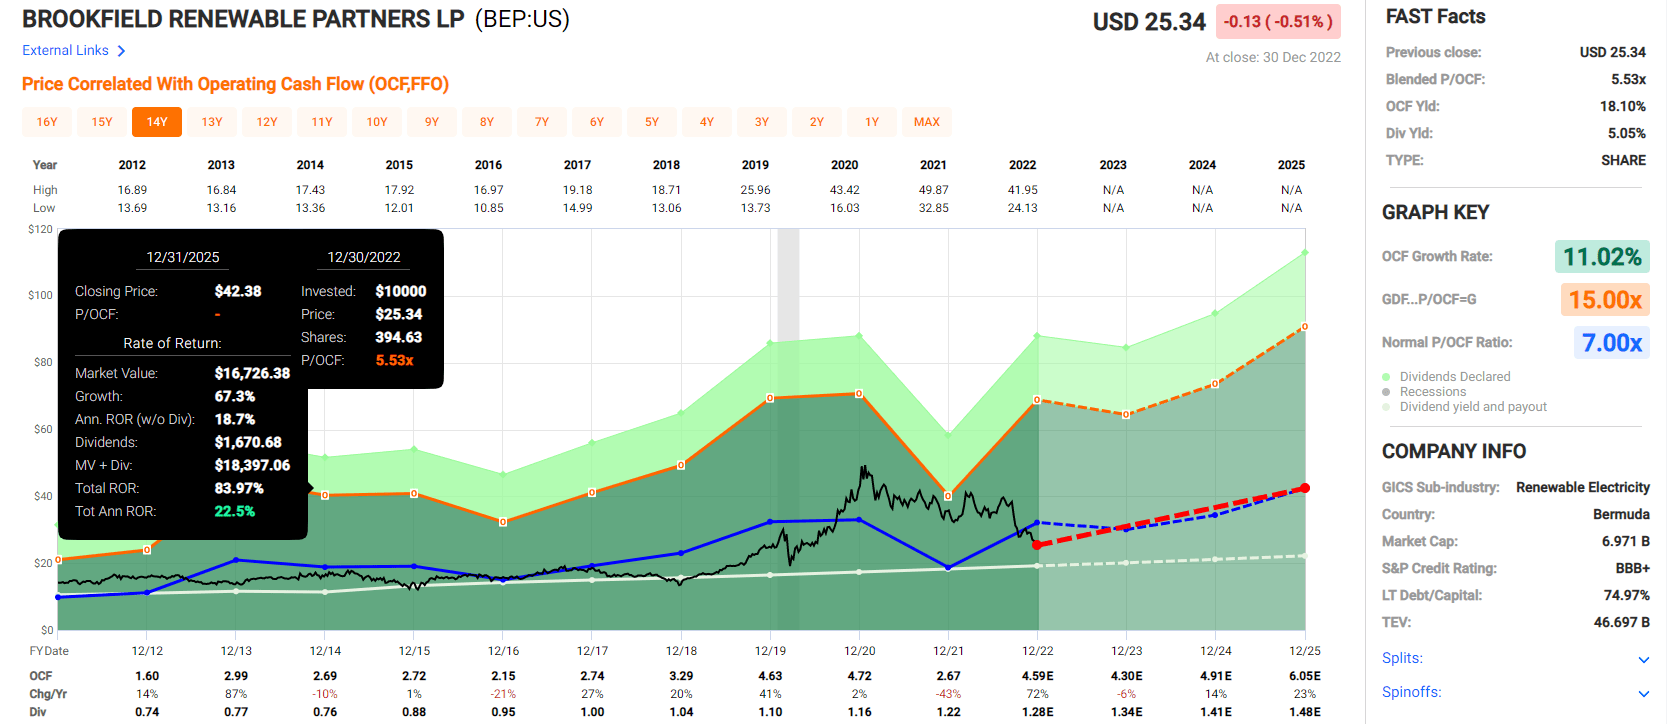
(Source: FAST Graphs, FactSet)
Brookfield Renewable 2028 Consensus Potential
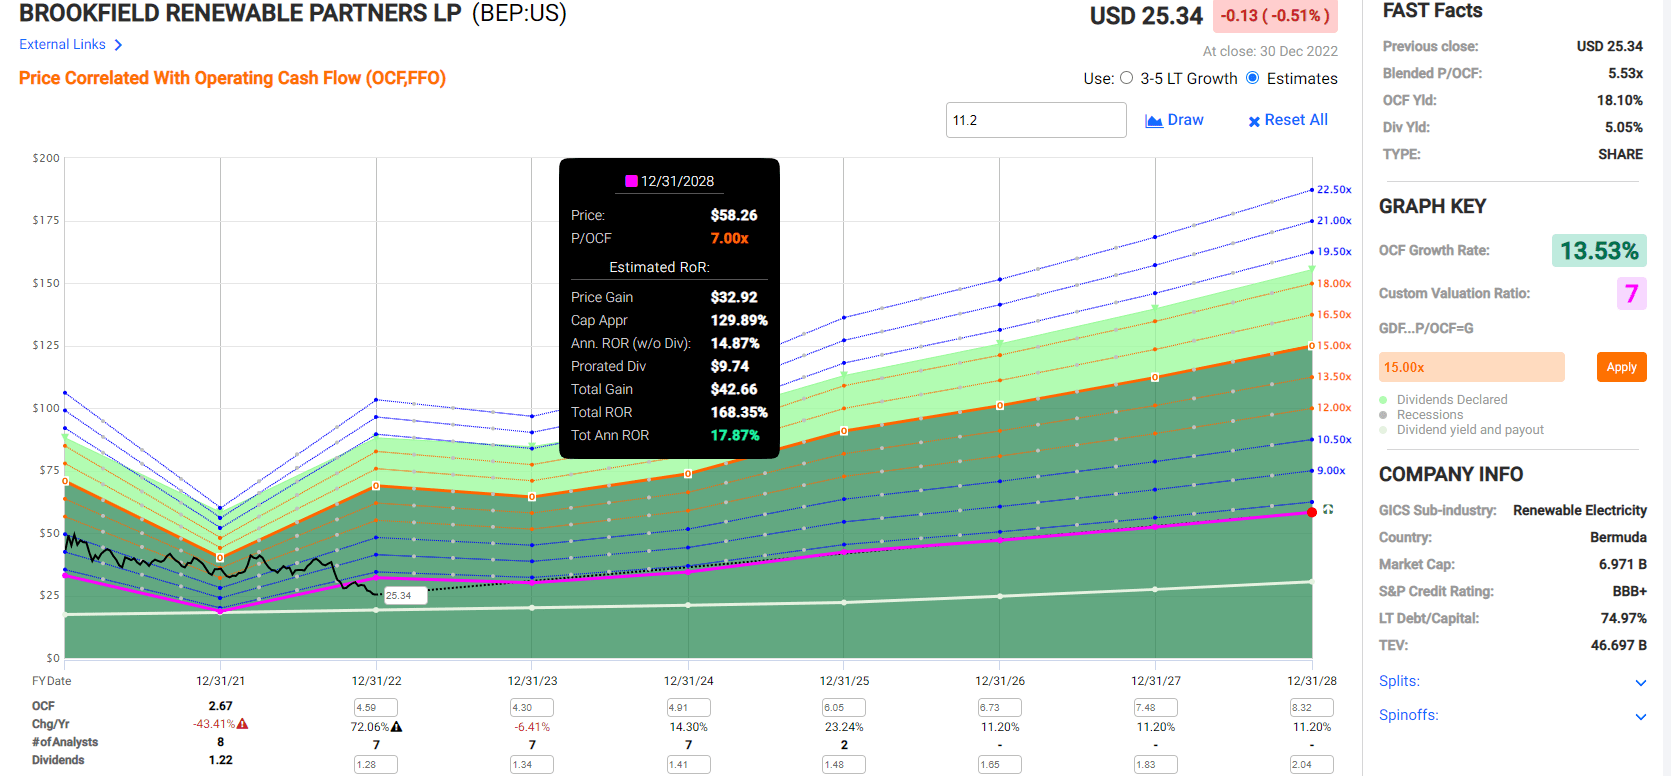
(Source: FAST Graphs, FactSet)
(Source: FAST Graphs, FactSet)
Over the next three years, BEP could nearly double, delivering 23% annual returns.
- 2.5X more than the S&P 500
Over the next five years, it could potentially deliver 170% returns or 18% annually.
- Buffett-like return potential from a 19% blue-chip bargain hiding in plain sight
Brookfield Renewable Investment Decision Score
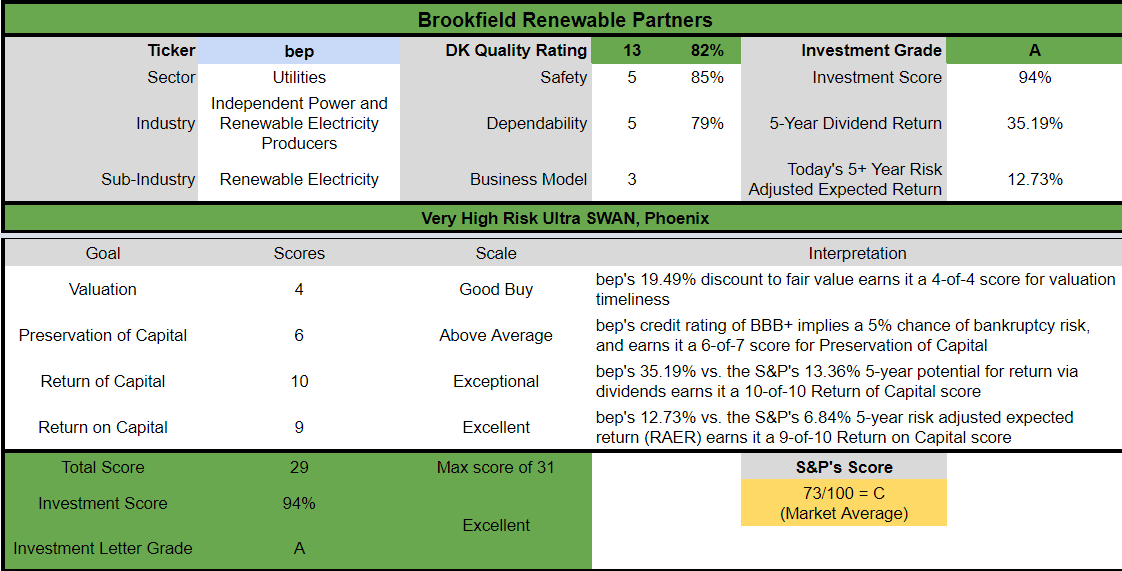
Dividend Kings Automated Investment Decision Tool
BEP is a potentially excellent high-yield opportunity for anyone comfortable with its risk profile. Look at how it compares to the S&P 500.
- 20% discount to fair value vs. 4% premium S&P = 24% better valuation
- 5.1% safe yield vs. 1.8% (3X higher and safer)
- approximately 16% long-term annual return potential vs. 10.2% CAGR S&P
- about 2X higher risk-adjusted expected returns
- almost 3X higher income potential over five years
Bank Of Nova Scotia: A Very Safe 6.2% Yield From One Of The World’s Safest Banks
Tax Implications
BNS is a Canadian company, so there is a 15% dividend tax withholding for US investors in taxable accounts.
- none in retirement accounts
There’s also a tax credit for taxable accounts that recoups the withholding but owning BNS (and any Canadian corporation) in a taxable account minimizes tax paperwork.
Canadian banks are known for two things. They have very safe dividends and have some of the best risk management on earth.
In fact, the last Canadian banking crisis was in the 1840s, almost two centuries ago.
Bank of Nova Scotia is one of Canada’s big six banks and hasn’t missed a dividend payment in 190 years.
Through dozens of recessions, depressions, two world wars, the Great Depression, and seven killer pandemics (one that wiped out 5% of the world), BNS has proven a dependable source of safe and growing yield.
How safe are Canada’s legendary banks? Every year, Global Finance ranks the safest banks in the world, based on credit ratings.
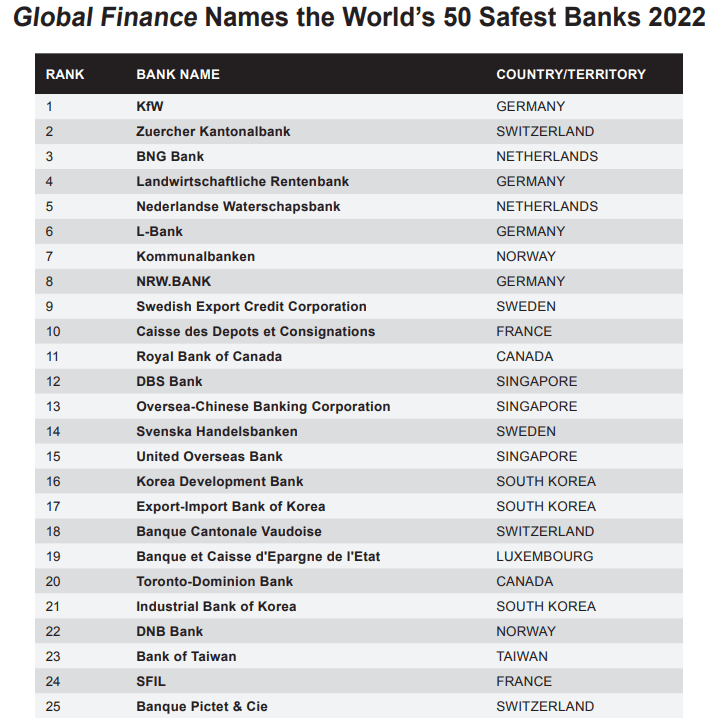
Global Finance
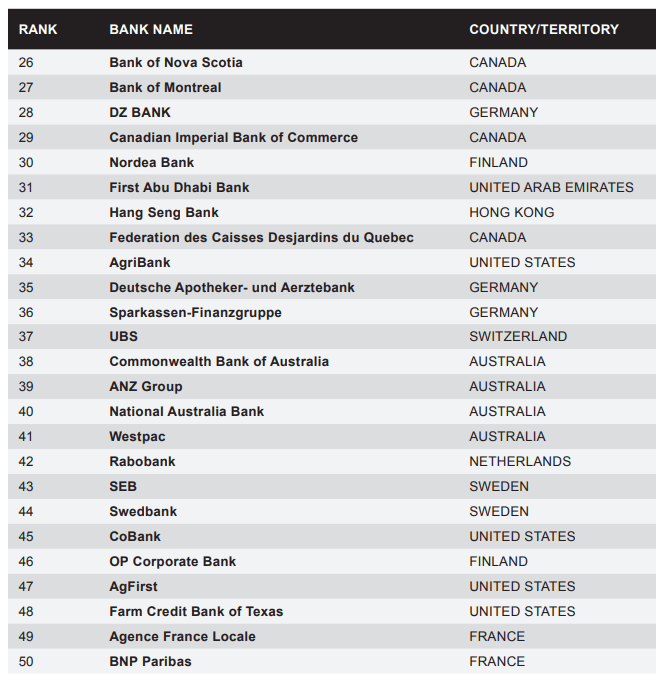
Global Finance
In 2022 BNS scored 26th safest, and the first 10 are all government-owned banks.
- BNS is the 16th safest private bank on earth according to rating agencies
How strong is BNS’s balance sheet?
| Rating Agency | Credit Rating | 30-Year Default/Bankruptcy Risk | Chance of Losing 100% Of Your Investment 1 In |
| S&P | A+ Stable Outlook | 0.6% | 166.7 |
| Fitch | AA- Stable Outlook | 0.55% | 181.8 |
| Moody’s | Aa2 (AA Equivalent) Stable Outlook | 0.51% | 196.1 |
| DBRS (Canada’s rating agency) | AA Stable Outlook | 0.51% | 196.1 |
| Consensus | AA- Stable Outlook | 0.54% | 184.3 |
(Sources: S&P, Fitch, Moody’s, DBRS)
This is effectively an AA-rated bank that no US bank can tough in terms of safety or long-term risk management.
Legendary Risk Management You Can Trust
Every company, even Ultra SWANs (Sleep well at night) high-yield blue-chips like Canadian banks, have risk profiles to consider.
BNS’s Risk Profile Includes
- economic cyclicality (mostly connected to Canada’s housing market)
- regulatory/political risk (specifically global M&A, capital ratio requirements, and compliance costs)
- industry disruption risk from fintech and de-centralized financial technologies
- talent retention risk
- currency risk
- higher loan loss risk in Latin America
How do we quantify, monitor, and track such a complex risk profile? By doing what big institutions do.
Long-Term Risk Management Analysis: How Large Institutions Measure Total Risk Management
DK uses S&P Global’s global long-term risk-management ratings for our risk rating.
- S&P has spent over 20 years perfecting their risk model
- which is based on over 30 major risk categories, over 130 subcategories, and 1,000 individual metrics
- 50% of metrics are industry specific
- this risk rating has been included in every credit rating for decades
The DK risk rating is based on the global percentile of how a company’s risk management compares to 8,000 S&P-rated companies covering 90% of the world’s market cap.
BNS scores 92nd Percentile On Global Long-Term Risk Management
S&P’s risk management scores factor in things like:
- supply chain management
- crisis management
- cyber-security
- privacy protection
- efficiency
- R&D efficiency
- innovation management
- labor relations
- talent retention
- worker training/skills improvement
- occupational health & safety
- customer relationship management
- business ethics
- climate strategy adaptation
- sustainable agricultural practices
- corporate governance
- brand management
BNS’s Long-Term Risk Management Is The 69th Best In The Master List 86th Percentile In The Master List)
| Classification | S&P LT Risk-Management Global Percentile |
Risk-Management Interpretation |
Risk-Management Rating |
| BTI, ILMN, SIEGY, SPGI, WM, CI, CSCO, WMB, SAP, CL | 100 | Exceptional (Top 80 companies in the world) | Very Low Risk |
| Scotia Bank | 92 |
Exceptional |
Very Low Risk |
| Strong ESG Stocks | 86 |
Very Good |
Very Low Risk |
| Foreign Dividend Stocks | 77 |
Good, Bordering On Very Good |
Low Risk |
| Ultra SWANs | 74 | Good | Low Risk |
| Dividend Aristocrats | 67 | Above-Average (Bordering On Good) | Low Risk |
| Low Volatility Stocks | 65 | Above-Average | Low Risk |
| Master List average | 61 | Above-Average | Low Risk |
| Dividend Kings | 60 | Above-Average | Low Risk |
| Hyper-Growth stocks | 59 | Average, Bordering On Above-Average | Medium Risk |
| Dividend Champions | 55 | Average | Medium Risk |
| Monthly Dividend Stocks | 41 | Average | Medium Risk |
(Source: DK Research Terminal)
BNS’s risk-management consensus is in the top 14% of the world’s best blue chips and is similar to:
- Toronto-Dominion Bank (TD): Ultra SWAN
- Royal Bank of Canada (RY): Ultra SWAN
- Bank of Montreal (BMO): Ultra SWAN
- Medtronic (MDT): Ultra SWAN dividend aristocrat
- Alphabet (GOOG): Ultra SWAN
The bottom line is that all companies have risks, and BNS is exceptional at managing theirs, according to S&P.
How We Monitor BNS’s Risk Profile
- 16 analysts
- four credit rating agencies
- 20 experts who collectively know this business better than anyone other than management
When the facts change, I change my mind. What do you do, sir?” – John Maynard Keynes
There are no sacred cows at iREIT or Dividend Kings. Wherever the fundamentals lead, we always follow. That’s the essence of disciplined financial science, the math behind retiring rich and staying rich in retirement.
Reasons To Potentially Buy Scotia Bank Today
| Metric | Scotiabank |
| Quality | 92% 13/13 Ultra SWAN (Sleep-Well-At-Night) Quality Bank |
| Risk Rating | Very low Risk |
| DK Master List Quality Ranking (Out Of 500 Companies) | 106 |
| DK Master List Quality Percentile | 79% |
| Dividend Growth Streak (Years) | 1 |
| Dividend Yield | 6.2% |
| Dividend Safety Score | 97% |
| Average Recession Dividend Cut Risk | 0.5% |
| Severe Recession Dividend Cut Risk | 1.15% |
| S&P Credit Rating |
A+ Stable Outlook |
| 30-Year Bankruptcy Risk | 0.60% |
| LT S&P Risk-Management Global Percentile |
92% Exceptional, Very Low Risk |
| Fair Value | $69.33 |
| Current Price | $48.98 |
| Discount To Fair Value | 32% |
| DK Rating |
Potential Very Strong Buy |
| PE | 7.9 (anti-bubble blue-chip) |
| Growth Priced In | -1.2% |
| Historical PE | 11.1 to 11.6 |
| LT Growth Consensus/Management Guidance | 3.4% |
| 5-year consensus total return potential |
10% to 20% CAGR |
| Base Case 5-year consensus return potential |
12% CAGR (About 2.5X The S&P 500) |
| Consensus 12-month total return forecast | 24% |
| Fundamentally Justified 12-Month Return Potential | 48% |
| LT Consensus Total Return Potential | 9.6% |
| Inflation-Adjusted Consensus LT Return Potential | 7.2% |
(Source: Dividend Kings Zen Research Terminal)
BNS is one of the best defensive ultra-yield Ultra SWANs you can buy in 2023, pricing in -1.2% growth courtesy of a 7.9 PE. That’s a 32% historical discount on one of the world’s best-run and safest banks.
Scotia Bank 2025 Consensus Return Potential
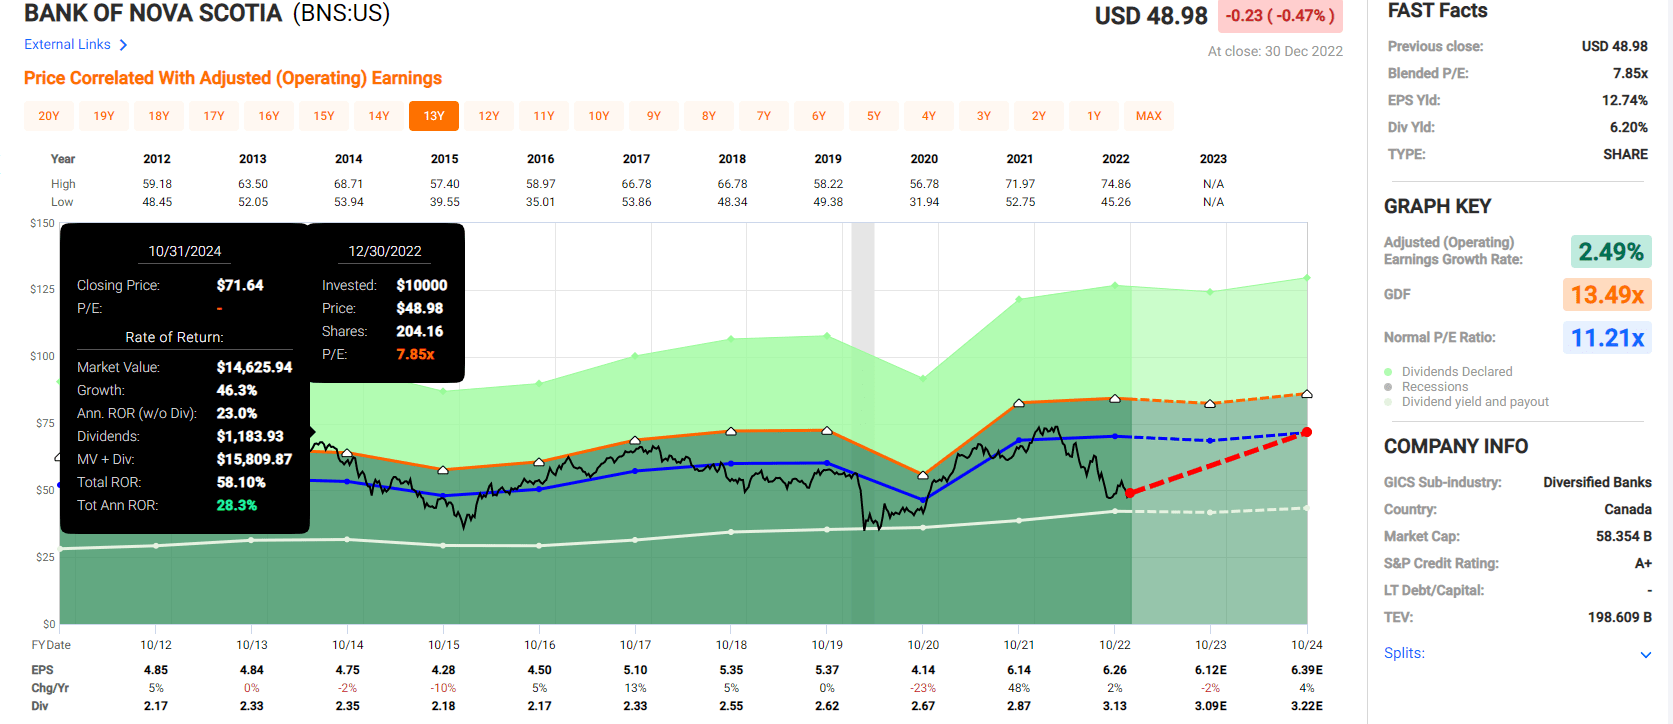
FAST Graphs, FactSet
Scotia Bank 2029 Consensus Return Potential
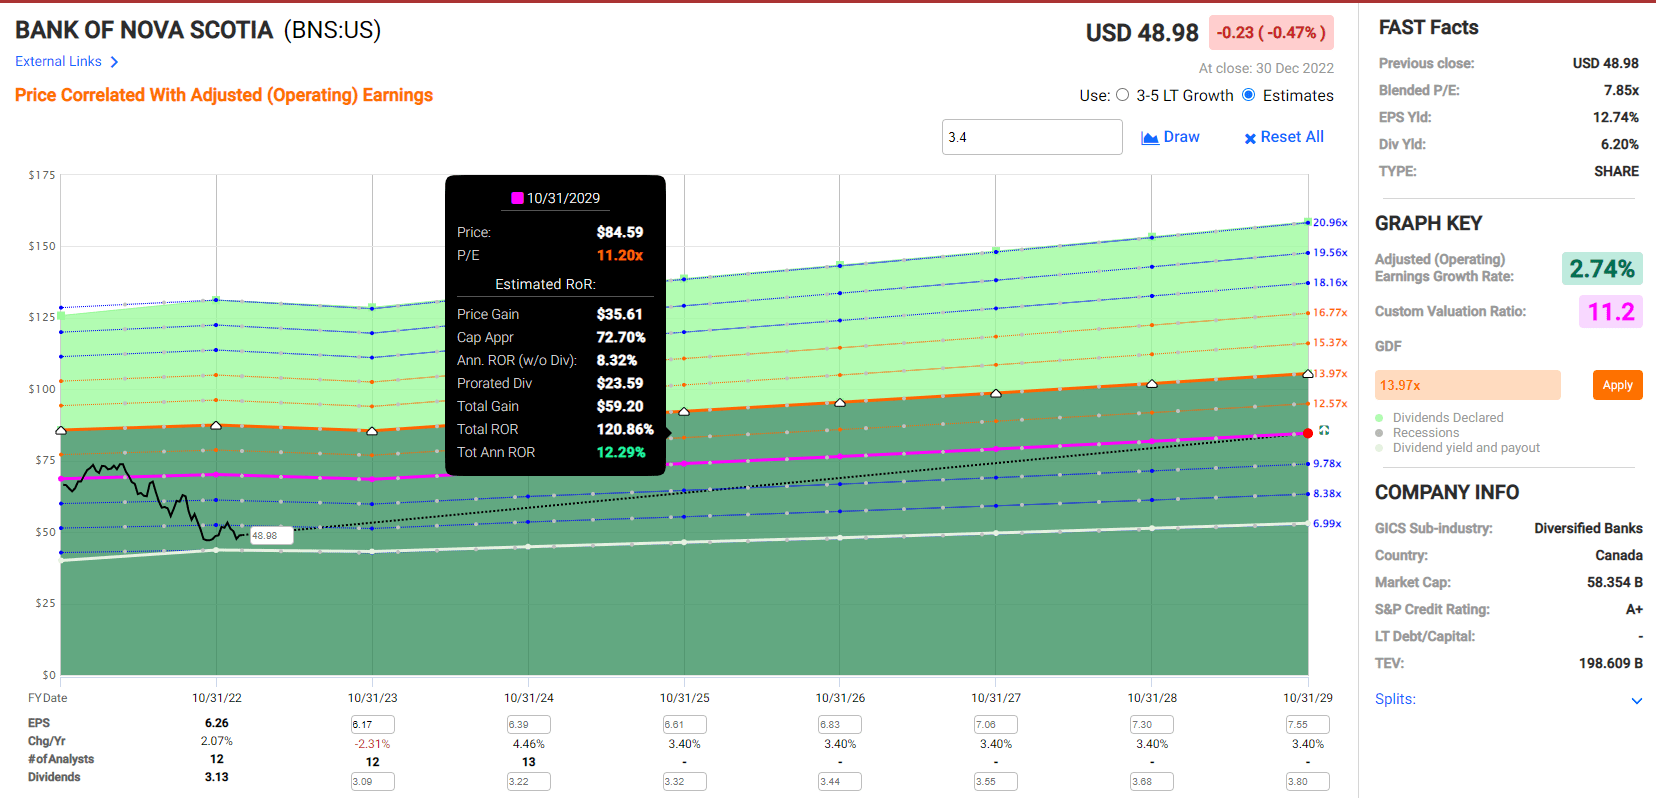
FAST Graphs, FactSet
Within three years, BNS, if it grows as expected and returns to historical fair value, could deliver 60% total returns, or 28% annually.
It could deliver a 120% total return or 12% annually within six years.
- 2.5X more than the S&P consensus
Scotiabank Investment Decision Score
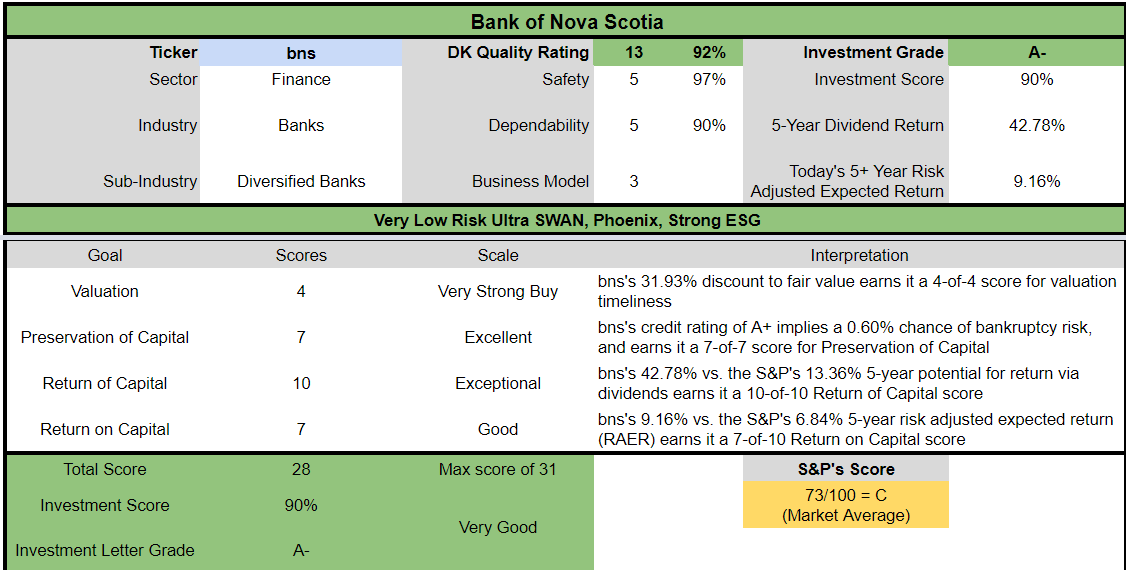
Dividend Kings Automated Investment Decision Tool
BNS is a potentially very good ultra-yield opportunity for anyone comfortable with its risk profile. Look at how it compares to the S&P 500.
- 32% discount to fair value vs. 4% premium S&P = 36% better valuation
- 6.2% safe yield vs. 1.8% (3.5X higher and safer)
- approximately 9.6% long-term annual return potential vs. 10.2% CAGR S&P
- about 50% higher risk-adjusted expected returns
- almost 3.5X higher income potential over five years
Bottom Line: Brookfield Renewable And Scotiabank Are Two 5+% Yielding New Year’s Bargains You Can Trust
Let me be clear: I’m NOT calling the bottom in BEP or BNS (I’m not a market-timer).
Even Ultra SWAN (sleep-well-at-night) quality does NOT mean “can’t fall hard and fast in a bear market.”
Fundamentals are all that determine safety and quality, and my recommendations.
- over 30+ years, 97% of stock returns are a function of pure fundamentals, not luck
- in the short term, luck is 25X as powerful as fundamentals
- in the long term, fundamentals are 33X as powerful as luck
While I can’t predict the market in the short term, here’s what I can tell you about BEP and BNS.
Both are world-beater blue chips, offering 5%-plus safe or very safe yields.
Brookfield Renewable is the largest yieldCo on Wall Street, with $68 billion in AUM, a growth runway over 30 years, and $150 trillion in investable opportunities.
Management thinks it can deliver double-digit growth for years or even decades to come, just as it has for the last 17 years.
If you’re looking for a great high-yield way to cash in on the green energy gold rush, BEP and BEPC are two reasonable options for 2023, even if we get a short-term recession crash.
Scotiabank is a legendary bank that hasn’t missed a dividend payment in almost two centuries. It’s one of the safest 6.2% yielding dividends on Wall Street and is 30% undervalued and offering nearly 30% annual return potential over the next three years.
This is the 16th safest private bank in the world according to credit rating agencies, and it offers investors 92nd percentile long-term risk management according to S&P.
If you’re looking for a 5%-plus yield that will let you sleep well at night in the potentially wild times ahead, BEP and BNS are two great options.
If you’re looking to take advantage of the coming bull market, which could begin as soon as February, BEP and BNS are two high-yield blue-chip bargains to consider.
Be the first to comment