

Matteo Colombo
Performance
As reported by our fund administrator, the Master Account, in which I am personally invested alongside SMA clients, returned -10.95% net in Q3 2022 vs -4.88% for the S&P 500. As of September 30, 2022, the top ten positions comprised approximately 71% of the portfolio, and the portfolio held approximately 4.6% in cash.
|
ACML |
S&P500 TR |
|
|
2019 |
18.9% |
31.5% |
|
2020 |
4.6% |
18.4% |
|
2021 |
13.9% |
28.7% |
|
2022 YTD |
-34.2% |
-23.9% |
|
ACML performance is net of fees and standard costs. |
“Buy when there’s blood in the streets, even if the blood is your own.” Baron Rothschild
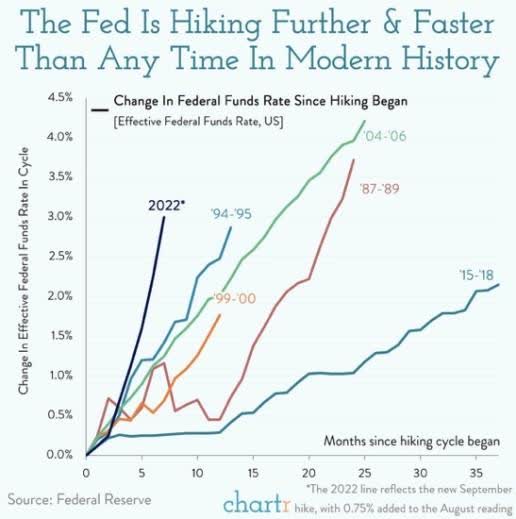
2022 has been a difficult year so far. The chart shows that the Fed is hiking rates more aggressively than in any previous cycle since 1987. Unsurprisingly, as the cost of capital has risen, the valuations of most assets have come down, and the companies in our portfolio have not been spared.
As Charlie Munger has said, it is in the nature of long-term shareholding that there will be vicissitudes in both share price and operations of even good businesses. The hard part is determining if a company’s difficulties are temporary or more permanent and, importantly, if the shares represent good value today, regardless of the past. The fact that
“Mr. Market” is in a lousy mood and quoting depressed prices on most assets does not, on the whole, change the fundamentals of our businesses or their attractive long-term prospects. For example, suppose one owns a private company that is generally healthy, even if subject to a recession. Outside of some exiguous non-business reasons, one wouldn’t think of selling companies at depressed prices just because interest rates are up. A more constructive approach is to focus on managing costs and seeking exploitable opportunities for future growth.
Similarly, the vast majority of our portfolio comprises high-quality companies with competent management, attractive businesses, and solid financial characteristics. Moreover, many are sitting on large cash balances and are run by skilled capital allocators ready to acquire assets or deploy resources at increasingly attractive valuations in a more capital-constrained environment.
I once read that concentrated value investors manage only 1% of approx. $80 trillion of global equities – defined as those who hold at least one position worth 5% of their total portfolio and have less than 30% annual turnover.[1] It seems there is ample room for a fundamentals-based investor with a longer time horizon to operate in a much less crowded space and hopefully profit from the occasional opportunity to buy mispriced businesses.
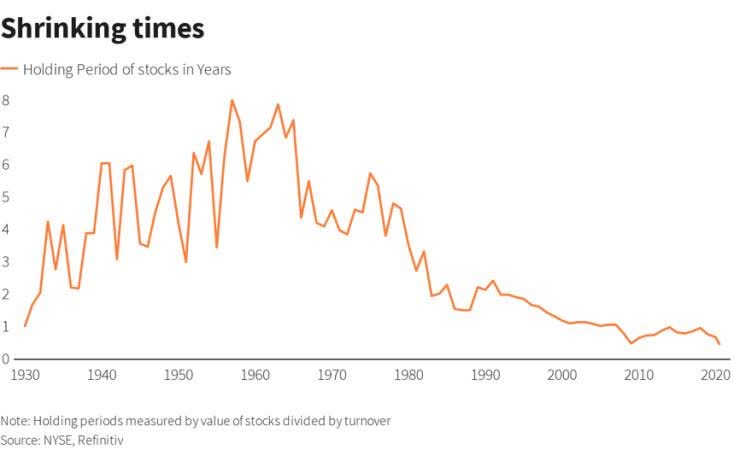
Even though markets can be fast-moving and competitive, more so now given the democratization of information driven by the internet, new advanced analytical tools, and armies of sophisticated analysts chasing alpha; most of these activities are increasingly focused on shorter investment horizons which have, on average, been shrinking for the last half-century. My friends who work at larger asset managers tell me they have at most 18-24 months for an investment idea to play out and can face significant career risk for shorter-term underperformance.
Therefore, many fundamentals-based investors still sell out of a position if it isn’t working “quickly enough” without giving the underlying businesses time to perform or compound.
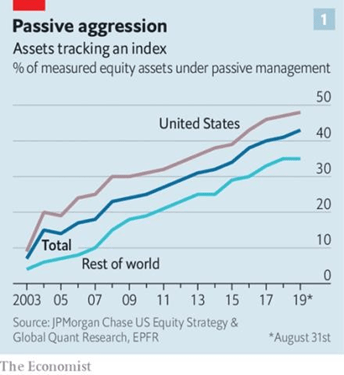
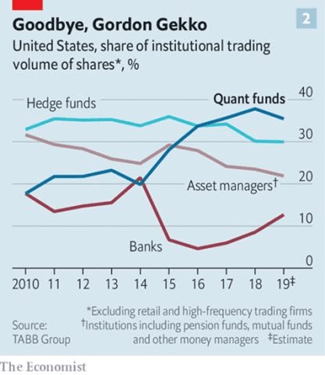
Furthermore, market changes have exacerbated individual securities’ price movements, sometimes for nonbusiness-fundamental reasons. Passive funds that track an index and do not participate in “price discovery,” and alternative trading styles, such as algorithmic, trend following, and risk parity, are increasingly driving the market.
I set up Alphyn Capital Management to invest in quality public companies for the long term without many of our peers’ short-term institutional pressures. Business cycles are inevitable, and I suspect once the macro forces blow over (and they always have, eventually), our style of investing will be well suited to an environment where valuations and business fundamentals matter once again.
I am continually updating my watchlist of high-quality companies and patiently waiting for attractive entry points where companies are priced significantly below my estimates of intrinsic value. Therefore, I can maintain a composed and prepared approach to exploiting opportunities that may arise, rather than scrambling to search for bargains amongst unfamiliar companies during turbulent times when emotions would otherwise run high. I am grateful for my clients’ trust and for the privilege of managing your money this way.
Portfolio – top and bottom performers*
|
Top Performers |
Contribution |
Bottom Performers |
Contribution |
|
WANdisco Plc (OTCPK:WANSF) |
2.63% |
Liberty Broadband Corp. (LBRDK) |
-2.87% |
|
Exor NV (OTCPK:EXXRF) |
0.55% |
Fairfax Financial Ltd. (OTCPK:FRFHF) |
-1.57% |
|
Amazon Inc. (AMZN) |
0.23% |
Burford Capital Ltd. (BUR) |
-1.22% |
|
Pershing Square Tontine Ltd. (OTCPK:PSHZF) |
0.02% |
CarMax, Inc. (KMX) |
-1.13% |
|
Ashtead Group Plc (OTCPK:ASHTF) |
-0.03% |
IAC Inc. (IAC) |
-1.03% |
|
As calculated in the Master Account brokerage statement. *There is no assurance that any of the securities discussed herein will remain in an account’s portfolio at the time you receive this report or that securities sold have not been repurchased. It should not be assumed that any of the securities transactions or holdings discussed were or will prove to be profitable. See “Disclaimers” at the end for more details. |
WANdisco
WANdisco has been one of the bright spots in the portfolio this quarter. For the nine months ended 30 September, bookings grew to $61.2m from $3.5m in the comparable period in 2021. When I first wrote about the company in 2019, I said that if it could get to $100m in annual revenue, it could earn at least $30m in after-tax earnings given its high-margin royalty business model. Applying a standard 15x earnings multiple (conservative for a high growth, high margin, profitable software business) would double our investment. If it keeps up the current momentum, the company could comfortably exceed this target.
WANdisco has always had a capable product for moving vast amounts of on-premises data to the cloud, one that
Microsoft (MSFT) and Amazon validated on the technical side. However, it suffered from a lack of “product-market-fit,” in other words, a killer use case that clients were willing to pay for in large numbers. This changed when CEO David Richards refocused the company on the emerging Internet of Things market and revamped the sales and marketing operation, including hiring an ex-Googler with deep relationships within the telco enterprise space. Just two customers accounted for the majority of revenues; a large telco using WANdisco to manage data transfer from its distributed network of smart meters, some telematics, and a large European automobile parts supplier. Both have significantly expanded their initial contracts as their data requirements have grown.
While I am encouraged by management’s tenacity to keep pressing for customers, I am watching closely to see the company prove its ability to add further customers.
Exor
As I previously wrote, Exor moved its listing from Milan to Amsterdam (which triggered a €746m tax earlier in the year), acquired 10% of Institut Mérieux (diversifying into relatively recession-resistant healthcare), and officially closed its sale of PartnerRe for €8.6bn in cash. Exor is well positioned to invest its considerable cash balance as the market is rolling over and capital is becoming more constrained.
Amazon
It is fascinating to me how Amazon continually uses its scale, operating resources, and “day one” attitude[2] to expand the number of industries in which it is involved. Healthcare is now an area of increased focus. In July, Amazon purchased 1Life Healthcare Inc., which operates a primary-care practice under the name One Medical for $3.9 billion. Amazon also bid for home-health-services provider Signify but lost out to CVS in September with a winning bid of $8 billion.
It is hard to predict what direction this will take, but Amazon often finds ways to add “synergies” from seemingly disparate services. For example, consider that Amazon has invested heavily in video, which drives the adoption of its Prime subscription. As a result, prime members provide a recurring revenue stream (approximately $25 billion) and spend more heavily on Amazon’s retail. This strengthens Amazon’s retail network effects to benefit its high margin third-party marketplace and advertising businesses.
Pershing Square Tontine Holdings
In July, PSTH redeemed its public shares cash and is attempting to launch a more shareholder-friendly “SPARC” structure. It intends to issue warrants to former holders of PSTH, which will allow holders to buy into any new acquisition of a private business. There is no guarantee that Pershing will successfully navigate all the SEC requirements to make this happen, but with the cash from our redemption in our accounts, the investment has been de-risked, and we may receive a near-free option on further M&A in the future.
Ashtead
I initiated a starter position in Ashtead, an equipment rental company listed in the UK but with 95% of its operations in the US. The rental equipment market is fragmented but growing and consolidating around the largest two players, United Rentals (URI), with approximately 16% of the market, and Ashtead, with about 12%. The next company only has a 4% share.
Overall, Ashtead has a return on investment in the 20% range, with 27% operating profit margins. Unit economics are attractive. For every $100 Ashtead spends on equipment, it generates $13 of operating profit per year and gets back $35 when it sells the equipment after seven years. Furthermore, Ashtead enjoys considerable economies of scale. As a major equipment OEM customer, Ashtead typically negotiates 15-20% discounts on equipment purchases.
With a higher density of locations and equipment, Ashtead can meet customer needs quickly and maintain high dollar utilization on equipment. In addition, with their significant investments in logistics and technology, they can offer customers better product availability and breadth than smaller competitors can match.
Unsurprisingly, both Ashtead and United are active acquirers of smaller businesses. United makes fewer large deals and has grown a bit faster, while Ashtead prefers more frequent smaller acquisitions, an arguably lower-risk approach. As the industry consolidates more, the top two are better able to enforce price discipline in the market.
From a customer’s perspective, Ashtead frees up capital that would otherwise be tied up with infrequently used ancillary equipment and provide quick and convenient on-demand access. Customers can also forgo maintenance and transportation crews’ expenses and logistical hassles. (A dynamic I am pretty familiar with as an owner/operator of private businesses earlier in my career). In contrast, Ashtead can spread these costs over a large asset base while providing better service and newer equipment. The last point is increasingly important in a world where health, safety, and ESG requirements are increasingly demanding.
Ashtead’s growth strategy centers on expansion into more specialty rentals. This includes portable commercial power generators, climate control equipment, scaffolding, flooring, and pump solutions. First, the specialty segments are much less penetrated in the market than general equipment and have more room to grow. Second, specialty is also less commoditized. For example, clients facing a flooded worksite want to draw on Ashtead’s expertise on how to solve the situation beyond simply renting equipment.
Third, specialty diversifies Ashtead’s business away from its traditional focus on construction markets. Fourth, Ashtead “clusters” multiple general and specialty locations in its leading markets, which drives better economics. For example, clustered regions have twice as many customers, 15% more revenue per customer, and 4.5% better margins.
I believe we were able to purchase shares at an attractive price for several reasons. Ashtead’s FCF generation ability is somewhat obscured by growth. There are a few nuances to the whole story, but if one strips out growth capex, the company is very profitable on an FCF basis. The equipment rental industry has been subject to the business cycle.
I won’t pretend Ashtead is immune to market cycles. Still, the growth in specialty, the fact that a large part of its construction end markets is for long-term projects like LNG plants, and a likely secular tailwind from the Federal Infrastructure package and CHIPS act are all likely mitigants. Finally, an inflationary environment can be good for rentals, given Ashtead’s relative cost advantage and the fact that customers are more inclined to rent than buy during periods of uncertainty.
Liberty Broadband
In retrospect, I wish I had cut the position in Liberty Broadband more aggressively last quarter. Fears of fixed wireless and fiber competition have weighed heavily on Charter (CHTR) and Liberty’s share prices. Tom Rutledge’s unexpected early retirement from the CEO role has not helped matters.
I believe the sentiment is now overly pessimistic, and the valuation once again attractive. Revenue growth from broadband adds will likely stall as fixed wireless access programs take a bite out of cable subscribers over the next five years.[3]
However, Charter has a fast-growing mobile phone business through an MVNO (mobile virtual network operator) agreement with Verizon (VZ). Given its cost-effective access to Verizon’s mobile telephony infrastructure, it provides a branded mobile phone service to retail customers at competitive rates. For example, Unlimited pricing starts at $29.99/month, including taxes and fees, vs. $35-55/month plus taxes and fees for Verizon’s plans.
Wireless generates approximately $725m in revenues for Charter per quarter, around 6% of the total, and is growing 40% per year. Should this continue, Wireless could return Charter to mid-single-digit revenue growth and “drive meaningful EBITDA for Charter,” as revenues scale over a low cost base. With approximately 25m non-Charter potential wireless customers within the area it serves, there is plenty of room for growth.
Fairfax Financial
I have written extensively about Fairfax in previous letters, and there isn’t all that much that is new to report. The company’s insurance operations have been growing strongly and performing well. We will see in upcoming earnings how much of an impact hurricane Ian will have had (sell side estimates are for $500m)[4]. Nevertheless, the company is on firm financial footing. While the general market decline will undoubtedly hit its equity investments, half of the company’s investible assets are in cash and short-term bonds.
A rising rate environment should be accretive to its bond portfolio as Fairfax reinvests maturing bonds into higher-yielding instruments. For example, a 2% yield improvement on a $26bn portfolio is approximately $520m in increased income vs. an $11bn market cap. In addition, Fairfax is monetizing assets at highly accretive prices. The sale of its pet insurance business, Resolute
Forest Products business, and IPO of Digit should add a combined $1.4bn, and management has been driving value through share repurchases. The market is a “weighting machine” over time, and I believe it will eventually recognize the robust economics of this business.
Burford Capital
Realizations at Burford slowed in the first half, as backlogs in the court system due to prior Covid shutdowns delayed approximately 43% of Burford’s cases. For example, the period from filing to trial presently averages 55 months in Brooklyn, New York,[5] and the courts further prioritize criminal over commercial matters. However, while near-term case conclusions and cash flows slowed, the company remains on a solid financial footing with approximately $430m available liquidity.
Encouragingly, Burford remains attractive to sophisticated institutional alternative investors. In the first half, Burford raised over $1 billion group-wide in new capital. Including $360 million of long-term debt, a $360 million fund for its Advantage Fund, which targets returns in the 12-20% IRR and pays Burford better than the typical 2&20 fees, and a $350 million fund for a post-settlement strategy.
The non-correlated timing of Burford’s returns, although lumpy, is one of the company’s attractions. Burford deployed approx. $400m into new cases, which should translate into robust income down the line.
CarMax
With its scale and customer-friendly business practices, CarMax offers customers attractive and transparent “no haggle” pricing, a wide selection, and a strong brand that reassures customers they are buying a vetted used car. With a well-developed wholesale business, CarMax has detailed pricing data on used vehicles of nearly every make, model, and trim, allowing it to purchase inventory effectively and pass on those costs to retail customers. Wholesale further provides CarMax with an avenue to sell vehicles that did not meet its relatively stringent standards for retail.
CarMax has one of the industry’s best cash flow profiles, partly due to the logistics of its operations and partly due to its captive financing business. CarMax Finance (CAF) segments customers into three tiers, offers to finance to the most creditworthy customers (tier 1), receives a fee from referring tier 2 customers to outside financing companies, and pays a fee for external financing companies to provide loans to tier 3 customers. CAF funds the loans through securitization; notably, these loans are non-recourse to CarMax. It earns a healthy 4-7% spread (depending on the cycle, rates, etc.) on the loans.
Until Carvana (CVNA) came on the scene, CarMax had a simple growth story. Every year it would build 10-15 new retail locations, on which it would generate attractive ~20% returns on investment. With less than 3% of the used car market, despite its size, it had plenty of room to grow. While Carvana proved that there was a market for cars online, CarMax has been a fast follower and now has a well-developed “omnichannel” retail operation. While Carvana has yet to figure out how to become profitable, CarMax uses its large footprint of stores to source, refurbish, and deliver cars profitably.
The current environment is challenging, with demand coming down and loan loss rates increasing with interest rates, which has coincided with a ramp-up in spending as CarMax invests more in omnichannel. In the short term, margins will be hit. Nevertheless, CarMax’s honest and capable management has been through several cycles before and proven good stewards of capital; as a result, the company has been an attractive compounder, despite operating in a cyclical industry, and I expect it will continue to be so.
IAC
Angi, IAC’s home services business, has had an especially tough time. The company has not cracked the code on its fixed-price service and still has difficulty matching consumer demand to service professionals. Pricing missteps with its recently acquired roofing business have not helped matters. We also recently learned that Oisin Hanrahan is stepping down as CEO to be replaced by Joey Levin, IAC’s CEO. It is unclear how Mr. Levin plans to salvage the situation, for example, by giving his full personal attention to a turnaround or by preparing the company for a sale (I am speculating). It will be an important test of Mr. Levin’s pragmatic leadership and operating skills.
IAC has had better results with its investment in MGM, whose shares have doubled since IAC first invested. With its brand and substantial casino operations, MGM is well-placed to compete in the rapidly growing online betting market. IAC believes they have the talent to help with this and consequently bought more shares.
DotDash’s acquisition of Meredith’s print business has been mixed so far. On the one hand, DotDash, as promised, has successfully transferred most of Meredith’s content online and improved advertising performance through better targeting, website speed, and customer experience. On the other hand, the turn in the macro environment impacted ad spending, and the combined company will not meet its initial $450m EBITDA target. I expect that macro factors, though unpleasant, will be temporary.
At the current share price, MGM, DotDash, and approximately $1bn in cash make up IAC’s entire value, while Angi and IAC’s portfolio of earlier-stage companies all provide upside optionality.
Portfolio – other changes
This quarter’s new position was Ashtead Group Plc., as discussed above. I also exited Vimeo (VMEO). We are in a very unforgiving environment for software companies with slowing sales growth, and it is not clear to me how the company will reaccelerate. I reallocated cash from this small position into IAC. Finally, I consolidated our position in Tencent (OTCPK:TCEHY) into Prosus (OTCPK:PROSY) as I hope to benefit from the latter’s aggressive share repurchase program. These sales allowed us to harvest some modest tax losses as a secondary benefit.
Samer Hakoura
Alphyn Capital Management, LLC
DisclaimerAlphyn Capital Management, LLC is a state registered investment adviser. The description herein of the approach of Alphyn Capital Management, LLC and the targeted characteristics of its strategies and investments is based on current expectations and should not be considered definitive or a guarantee that the approaches, strategies, and investment portfolio will, in fact, possess these characteristics. Past performance of specific investment advice should not be relied upon without knowledge of certain circumstances of market events, nature and timing of the investments and relevant constraints of the investment. Alphyn Capital Management, LLC has presented information in a fair and balanced manner. Alphyn Capital Management, LLC is not giving tax, legal or accounting advice, consult a professional tax or legal representative if needed. Reference or comparison to an index does not imply that the portfolio will be constructed in the same way as the index or achieve returns, volatility, or other results similar to the index. Unlike indices, the model portfolio will be actively managed and may include substantially fewer and different securities than those comprising each index. Results for the model portfolio as compared to the performance of the Standard & Poor’s 500 Index (the “S&P 500”) for informational purposes only. The S&P 500 is an unmanaged market capitalization-weighted index of 500 common stocks chosen for market size, liquidity, and industry group representation to represent US equity performance. The investment program does not mirror this index and the volatility may be materially different from the volatility of the S&P 500. Performance results of the master portfolio are presented for information purposes only and reflect the impact that material economic and market factors had on the manager’s decision-making process. No representation is being made that any investor or portfolio will or is likely to achieve profits or losses similar to those shown. Results are net of all standard fees calculated at the highest rate charged, expenses and estimated incentive allocation. Model portfolio returns are inclusive of the reinvestment of dividends and other earnings, including income from new issues. The return is based on annual returns since inception and does not give effect to high water marks, if any. Returns may vary for investors who are restricted from participating in new issues. Hypothetical performance results are unaudited and do not reflect actual results of any accounts managed by Alphyn Capital Management, LLC. Hypothetical performance results are for illustrative purposes only and are not necessarily indicative of performance that would have been actually achieved if an investment utilized the strategy during the relevant periods, nor are these simulations necessarily indicative of future performance of the strategy. Inherent limitations of hypothetical performance may include: 1) hypothetical results are generally prepared with the benefit of hindsight; 2) hypothetical results do not represent the impact that material economic and market factors might have on an investment adviser’s decision-making process if the adviser were actually managing client money; 3) there are numerous factors related to the markets in general, many of which cannot be fully accounted for in the preparation of hypothetical performance results and all of which may adversely affect actual investment results. There is no assurance that any of the securities discussed herein will remain in an account’s portfolio at the time you receive this report or that securities sold have not been repurchased. The securities discussed do not represent an account’s entire portfolio and, in the aggregate, may represent only a small percentage of an account’s portfolio holdings. It should not be assumed that any of the securities transactions or holdings discussed were or will prove to be profitable or that the investment recommendations or decisions we make in the future will be profitable or will equal the investment performance of the securities discussed herein. The graphs, charts and other visual aids are provided for informational purposes only. None of these graphs, charts or visual aids can and of themselves be used to make investment decisions. No representation is made that these will assist any person in making investment decisions and no graph, chart or other visual aid can capture all factors and variables required in making such decisions. This report is for informational purposes only and should not be construed as investment advice. It is not a recommendation of, or an offer to sell or solicitation of an offer to buy, any particular security, strategy or investment product. Our research for this report is based on current public information that we consider reliable, but we do not represent that the research or the report is accurate or complete, and it should not be relied on as such. Our views and opinions expressed in this report are current as of the date of this report and are subject to change. Any reproduction or other distribution of this material in whole or in part without the prior written consent of Alphyn Capital Management, LLC is prohibited. |
Editor’s Note: The summary bullets for this article were chosen by Seeking Alpha editors.
Be the first to comment