

Gumpanat/iStock via Getty Images
Investment Summary
Scouring the medical technology (“medtech”) universe for high-quality stocks has become increasingly difficult in H2 FY22. This is curious. Findings show that global medtech is a low-beta play that adds resiliency to portfolios in times of economic turbulence. However, the sector is fraught with deep equity drawdown, amid a profitless race to the bottom of the chart.
Our investment strategy has shifted in FY22 onto capital protected strategies. The focus is directly on bottom-line fundamentals and profitability as drivers of equity returns. We are on the hunt for long-term cash compounders that enter H2 FY22 with strong earnings momentum and high FCF conversion. High return on capital that beats the hurdle is also desirable. In medtech, these kind of names have separated from the bottom and now standout looking ahead.
We then turn to Alphatec Holdings, Inc. (NASDAQ:ATEC), technological innovator within the spinal surgery segment. ATEC offers a plethora of intra-operative surgical technologies, ranging from fixation systems, visualization systems and risk mitigation systems to name but a few. Whilst the global market for spine surgery is appealing, our findings demonstrate ATEC displays a loose affinity to the risk premia currently driving equity markets, and is a loose fit to our strategy. Specifically, it lags on market factors, profitability/cash conversion factors and on valuation. Hence, we rate ATEC neutral PT $6.85.
Exhibit 1. ATEC 6-month price action
Data: Updata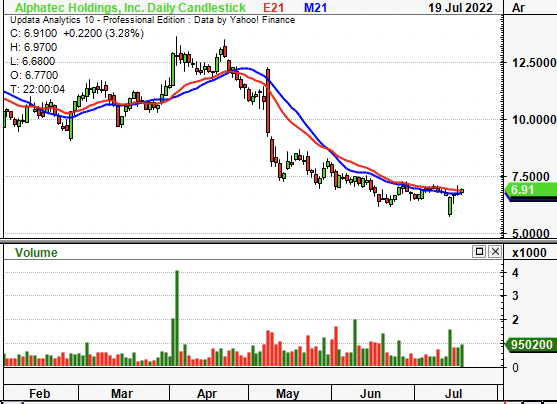
Market Factors
The high-beta and growth trade has exhausted itself this year. As such, investors have wound back equity duration in portfolios. Instead, alpha has been harvested from low-beta, high quality plays that sit at the short end of the equity curve. As seen in Exhibit 2, ATEC’s covariance structure has remained relatively high throughout FY22, despite shifting downwards in recent months. Its rolling equity beta is now 1.34. Unsurprisingly, the stock has lost strength against to the benchmark and now trades at a 12-month low relative to the market. We argue this is due to its high equity beta, but also a lack of idiosyncratic risk premia for investors to latch onto in ATEC, shown later. These are undesirable characteristics that investors aren’t paying a premium for in FY22.
Exhibit 2. High-beta, low-quality plays have been punished in FY22 as investors look to idiosyncratic risk drivers instead
For ATEC, it suggests a lack of company-specific premia to latch onto.
Data: Updata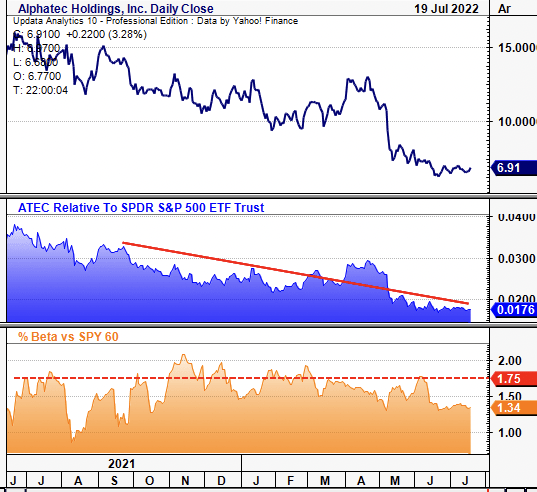
ATEC has also weakened against the US medical devices and health care equipment sector, as seen in Exhibit 4. The stock now trades at a 12-month low to the sector. We’re after names that are strengthening against peers, hence, ATEC offers a lack of upside capture in this regard. This corroborates findings that ATEC offers lack of upside capture. Companies with strengthening bottom-line fundamentals and resiliency factors are outsizing peers in medtech this year. Alas, with weaker earnings momentum (discussed below), buyers are reluctant to enter ATAC at these multiples.
Exhibit 4. ATEC has weakened against US medical devices & health care equipment sector markedly since May
Data: Updata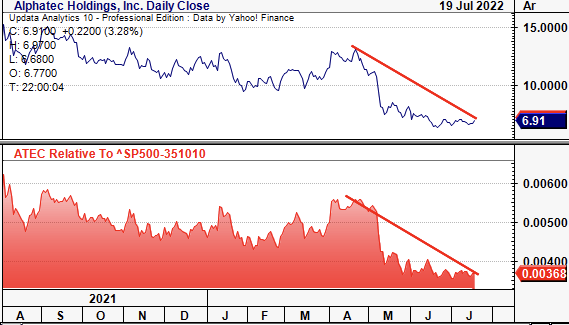
Fundamental factors
Q1 earnings provide a good backdrop of the bearish tilt in ATEC’s risk/reward calculus. Q1 sales came in at $71 million and were up 61% YoY, however contracted ~400bps sequentially. Turnover benefitted from a ~600bps tailwind from EOS contribution, whilst ~94% was organic growth. Surgeon adoption kept at pace in Q1 with surgeon utilisation up 18% YoY. Revenue was also helped by an 11% YoY gain in average revenue per case. Management noted that revenue mix is shifting to more complex-segments that require multiple products per case. It also noted that lateral procedures contributed ~40% of growth in the period, underscored by prone transpsoas (“PTP”) procedures.
It guides FY22 revenue growth of 30%, calling for $316 million at the top. It projects a mix of 85% organic and 15% EOS. It raised guidance amid its Q1 performance, and predicts a strong back-end of FY22 on these forecasts.
Although, ATEC did print a $44 million quarterly operating loss -$0.59 loss per share and $52 million loss on FCF. These are each consistent with longer-term earnings trends. Hence, investors realized an annualized -$2.36 loss share on revenue YoY growth of 61%.
This data is important to extrapolate. Investors have shied away from rewarding top-line growth in FY22. Instead, the shift is onto-bottom line fundamentals, a factor where ATEC lags. As Exhibit 5 shows, it has printed a series of operating and FCF losses since FY15-date, resulting in consistently negative FCF yield throughout that time. It’s averaged a loss of ~-$20-$40 million since 2019. Whilst sales and gross profit widened in FY20-21′, so too did the operating loss on this top-line growth. Hence, the loss on revenue and gross profit continues to widen, a key risk heading forward.
Exhibit 5. Widening losses on growing revenue – investors aren’t paying a premium for this in FY22
Data & Image: HB Insights; Refinitiv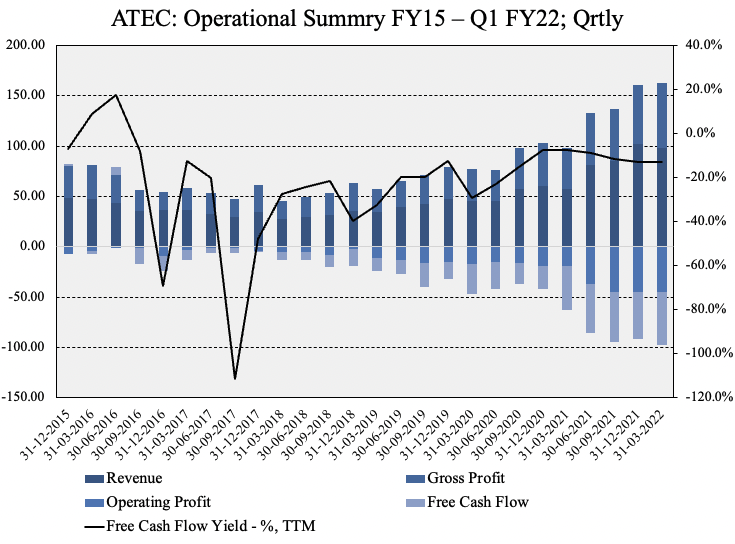
Similar characteristics are found in ATEC’s profitability summary. It has continuously printed a loss on assets since FY15, whereas operating margin has contracted sequentially to its second lowest point since then, seen below. Five-year ROIC has normalized to -20%. ATEC also has an unreasonably high WACC of 12.1%, and thus doesn’t meet the hurdle with return on its invested capital. It therefore must compound cash at 12% to overcome its capital costs, and looks to struggle in doing so. This is a key risk investors must consider moving forward.
Exhibit 6. ROA and Operating margin continue to print negative on a WACC of ~12%
Data & Image: HB Insights, Refinitiv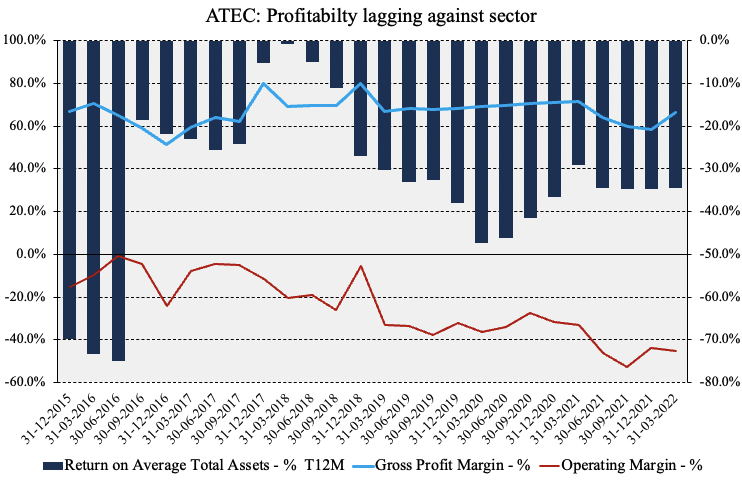
Adding bullish symmetry to the equation is ATEC’s management over working capital. As seen in Exhibit 7, management have improved the cash conversion cycle from 367 days in Q2 FY18 to 217 days in Q1 FY22. This was helped by an increase in accounts receivable turnover, reduction in inventory to cash days and jump in inventory turnover from 1x to 1.3x. In addition, short-term liabilities are covered ~2.6x from liquid assets, in line with 2018 values. Hence, it has reduced its working capital cycle whilst maintaining appropriate liquidity levels in doing so.
Exhibit 7. Working capital cycle trends improving whilst maintaining adequate liquidity in doing to
Data: HB Insights; Refinitiv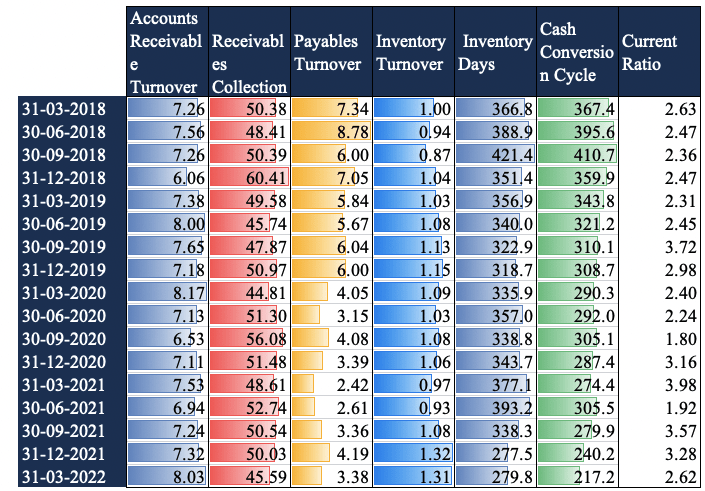
Valuation factors for ATEC
It’s difficult to accurately value the company due to its lack of profitability and forecasted losses at the bottom line. Nevertheless, shares are trading at 2.6x sales, below the 5-year average of 3.4x. As seen below, ATEC has de-rated substantially off its December FY21′ highs, mostly as a function of price. This is further evidence investors have shifted off top-line metrics and are rewarding bottom-line growth instead.
Exhibit 8. ATEC has de-rated off December FY21′ highs as investors moved away from rewarding top-line growth
Instead, as investors step up in quality, the focus is on bottom-line growth /FCF/resiliency
Data: Refinitiv Datastream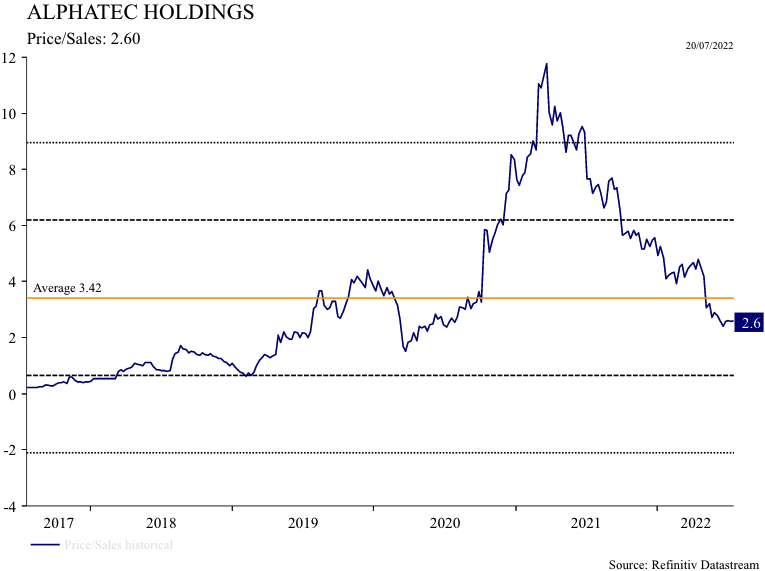
The market’s psychology around the stock looks bearish and there’s multiple downside targets set on point & figure charting. We see downside objectives to $5.70 if a $6.45 target is activated. There’s been numerous downthrusts from previous highs, seen on Exhibit 9, and the stock has attracted sellers down from 52-week highs of $15.34. ATEC is also trading below heavy resistance and price action looks bearish according to this chart. With this, we firmly believe price objectives are tilted bearish
Exhibit 9. Price action looks bearish with downside targets to $6.45 and $5.70
Data: Updata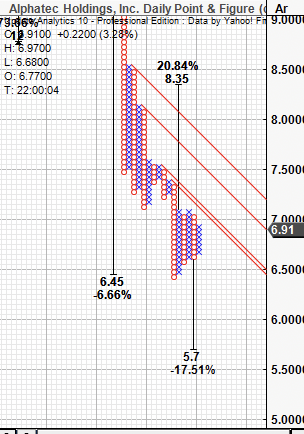
At 2.6x FY22 sales, this lends a price target of $8. However, valuing ATEC using top-line multiples alone is a fruitless exercise, by estimation. The market’s not rewarding top-line growth and we are searching for long-term cash compounders. As such, with a lack of earnings to latch onto, we price ATEC at $6.85, the arithmetic mean of $8 and $5.70. This suggests the stock is fairly priced and again, offers a lack of upside capture.
In Short
ATEC fails to adhere to the risk premia currently driving equity markets. Instead, it has printed a series of operating losses and realized ongoing losses at the FCF level since FY15. Moreover, it is generating a loss on invested capital that is substantially below the WACC watermark.
Investors aren’t paying for these characteristics in FY22, and neither are we. We’ve priced the stock at $6.85. Without tangible value to be realized in the name, we rate neutral, and advocate investors seek other names within US spinal.
Be the first to comment