

remco86
Thesis
Alibaba’s (NYSE:BABA) stock price continues to be directed by short-term events and disjointed from business fundamentals. While its financial performances are partly to blame (although quite healthy in my view), its stock price movements have been largely dominated by news events, such as the uncertainty in the Chinese regulatory environment, the lingering COVID-19 concerns, and the China-U.S. tension. To cite a few recent examples (shown in the chart below),
- On May 26, after reporting its March quarter results, its stock price climbed 14.8% in one day. And shortly afterward, on June 8, the Chinese government announced the approval of a new round of video game licenses, and its stock prices increased by another 14.7%.
- Then in July, it was fined by antitrust regulators for the improper reporting of previous merger deals. In particular, on July 11, its stock declined by 9.2% even though the fine amounted to only $373k.
- On July 29, it was added back to the U.S. SEC’s watchlist of Chinese companies that might be delisted. The news triggered an 11% decline in its stock price to close at $89 from $100 the day before.
- Then finally on August 4, 2022, when it reported its June Quarter earnings, the stock prices fluctuated between a low of $95 and a high of $103 in a single day, translating into an 8.4% daily fluctuation.
I am citing all these detailed events and price movements to give you a concrete feeling of its price volatility so that you can see the main thesis of this article: the mispricing of its implied volatility (“IV”) in the options market.
Author based on Yahoo! data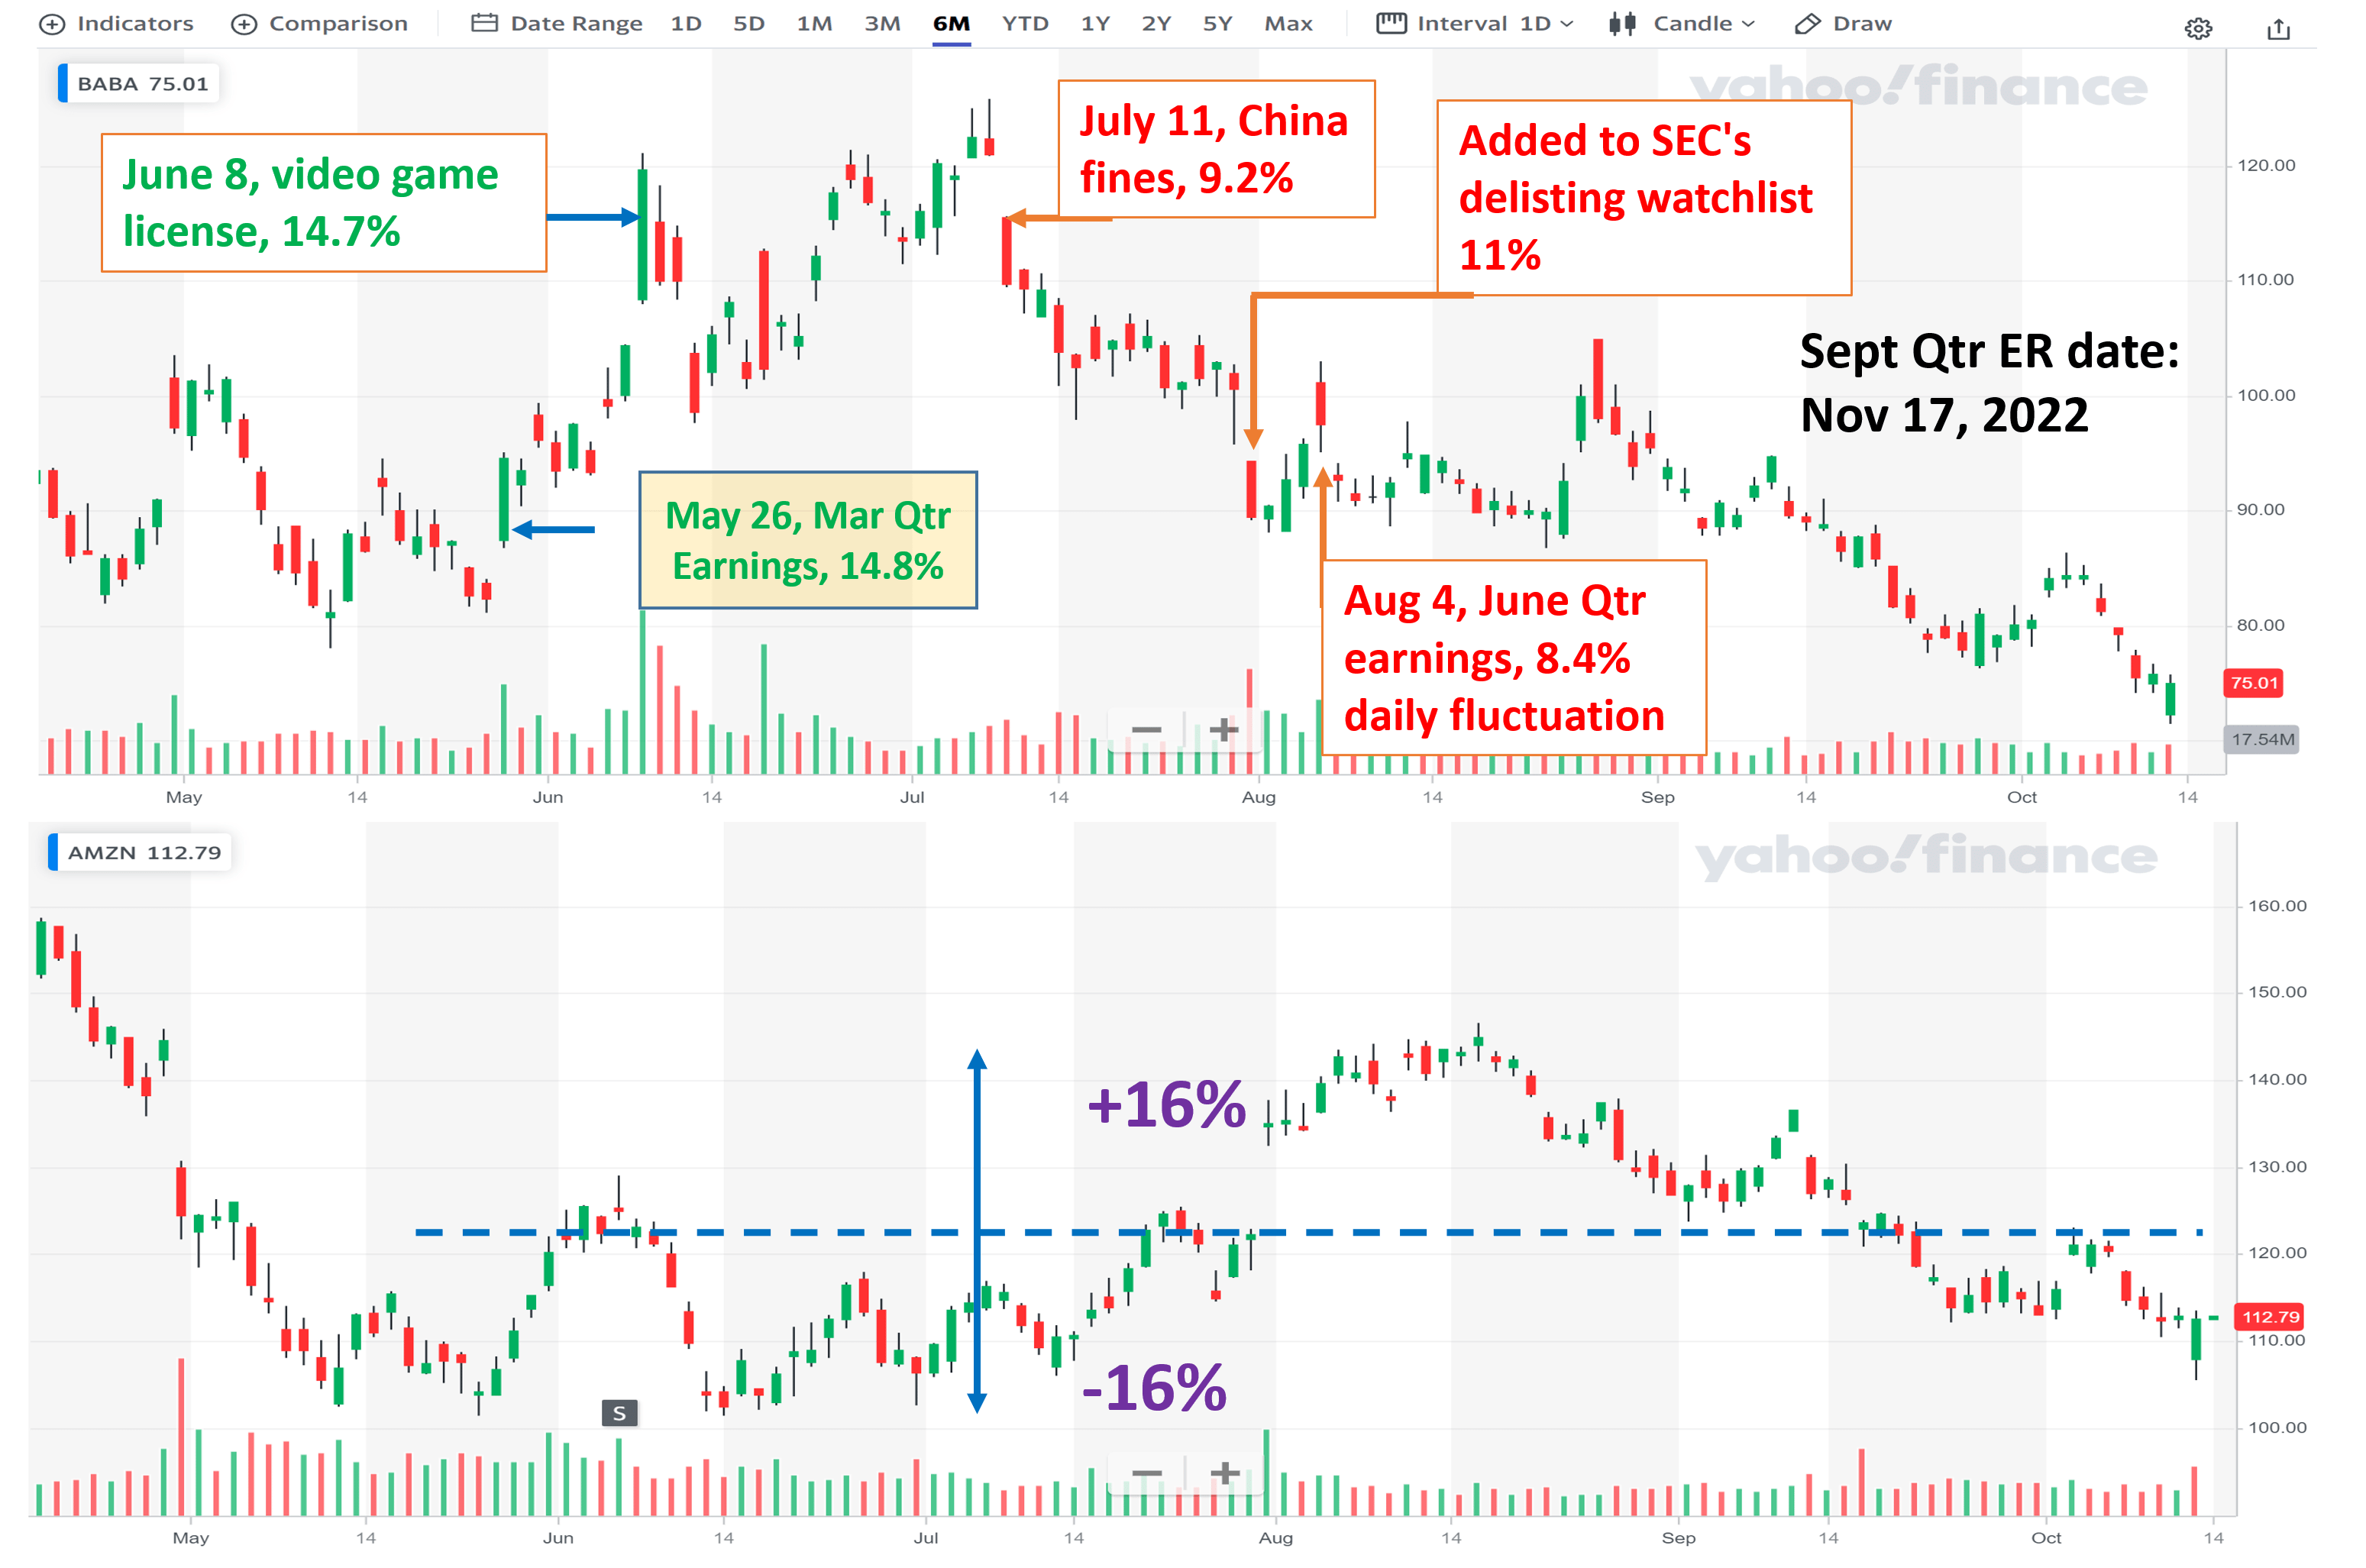
The mispricing probably is best illustrated by comparison against its U.S. counterpart: Amazon (AMZN). The price movements of AMZN in the past 6 months are shown in the bottom panel of the above chart. In contrast to BABA’s frequent ~10% DAILY price volatilities, AMZN stock price has been largely range-bound between $140 and $105, translating into a fluctuation of around 16% around a mean price of $122.5 over the past few MONTHS. Yet, as you will see in a later section, the options market currently assigns an IV of about 61% for BABA for its Dec 16, 2022, option. And the IV it assigns for AMZN is about the same (a bit below 60%), accentuating the IV mispricing.
Looking forward, BABA is expected to report earnings on 11/17/2022 according to Nasdaq’s schedule. Considering the IV mispricing, an option with expiry after that (say Dec 16, 2022) could either help to hedge your existing positions or to open a new position. Directly holding the shares can help you to benefit from its compressed valuation (as to be detailed in the next section immediately below). But an option play can help you to benefit from the compression in its valuation AND also the IV mispricing.
Business outlook and growth potential
Admittedly, BABA’s earning results have been a bit choppy lately. However, in its upcoming earnings report for the September 2022 quarter, I expected a number of promising growth avenues. These catalysts should support healthy earnings growth, especially in the near- to mid-term, say in the 2025-2027 timeframe. First, I expect the Chinese economy to recover considerably once COVID-19 concerns clear up. Second, BABA is still very successful at attracting new annual active customers from the vast population of China, especially from the less developed areas. Notably, Tmall and Taobao continue to perform well. Third, on the international stage, platforms such as Lazada and AliExpress logged solid double-digit order growth rates in fiscal 2021, and I foresee such growth to continue or even accelerate in the next few years. Finally, on top of all these, its cloud segment continues to capture market share within the burgeoning global cloud niche. All told, consensus estimates project an 11.5% EPS expansion in the next five years, as you can see from the first chart below. And I tend to agree with such a projection.
Author based on Seeking Alpha data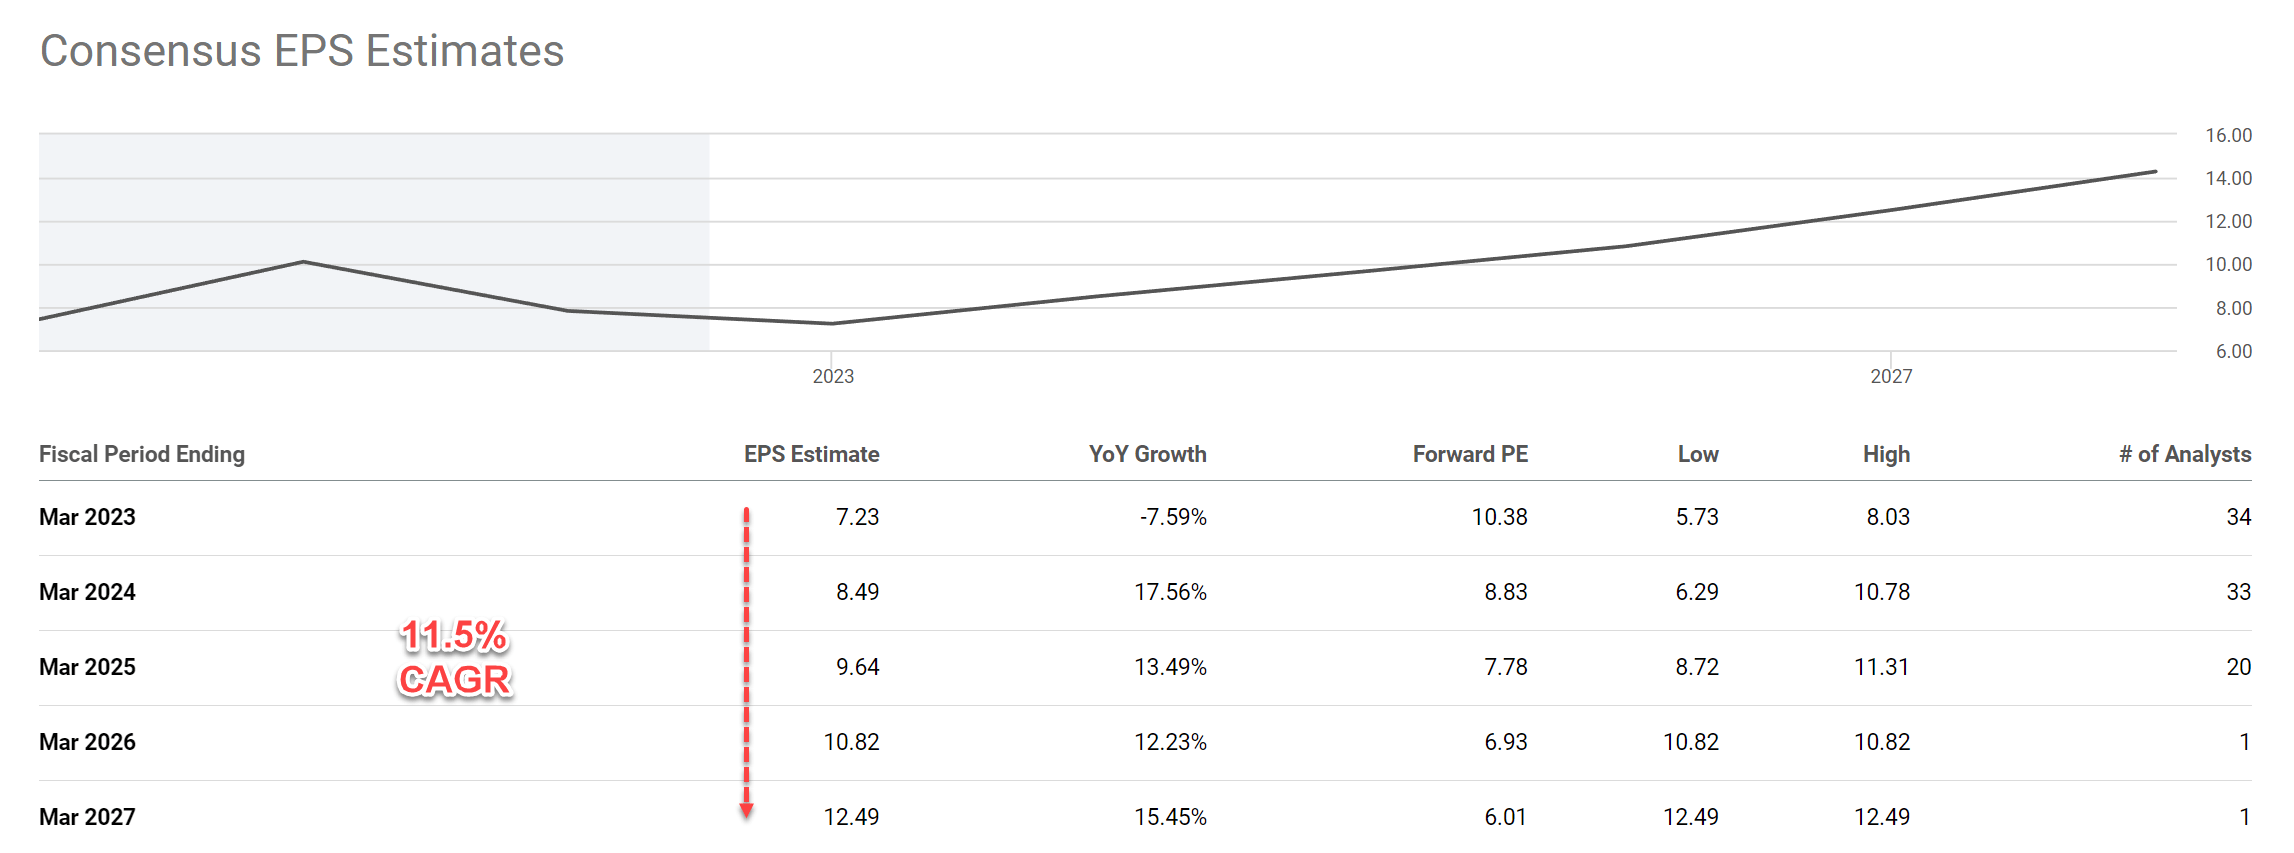
In the meantime, its financial position is strong. The balance sheet is in good condition, as seen in the next chart below, providing the liquidity and financial flexibility to fuel its continued expansion. Alibaba ended the last quarter with more than $69 billion in cash as seen. In addition, merely 13.4% of the capital structure is comprised of long-term debt (compared to AMZN’s 45.4%), suggesting plenty of flexibility to support growth initiatives.
Although, note that the table below made a mistake on its cash per share (probably due to confusion about its share count vs its ADR counts). With $69 billion of cash and approximately 2.6 billion ADR outstanding, the total cash per share should be about $26.5. At its current stock price of $75 as of this writing, more than 1/3 of its stock price (35.4% to be exact) is just cash.
Author based on Seeking Alpha data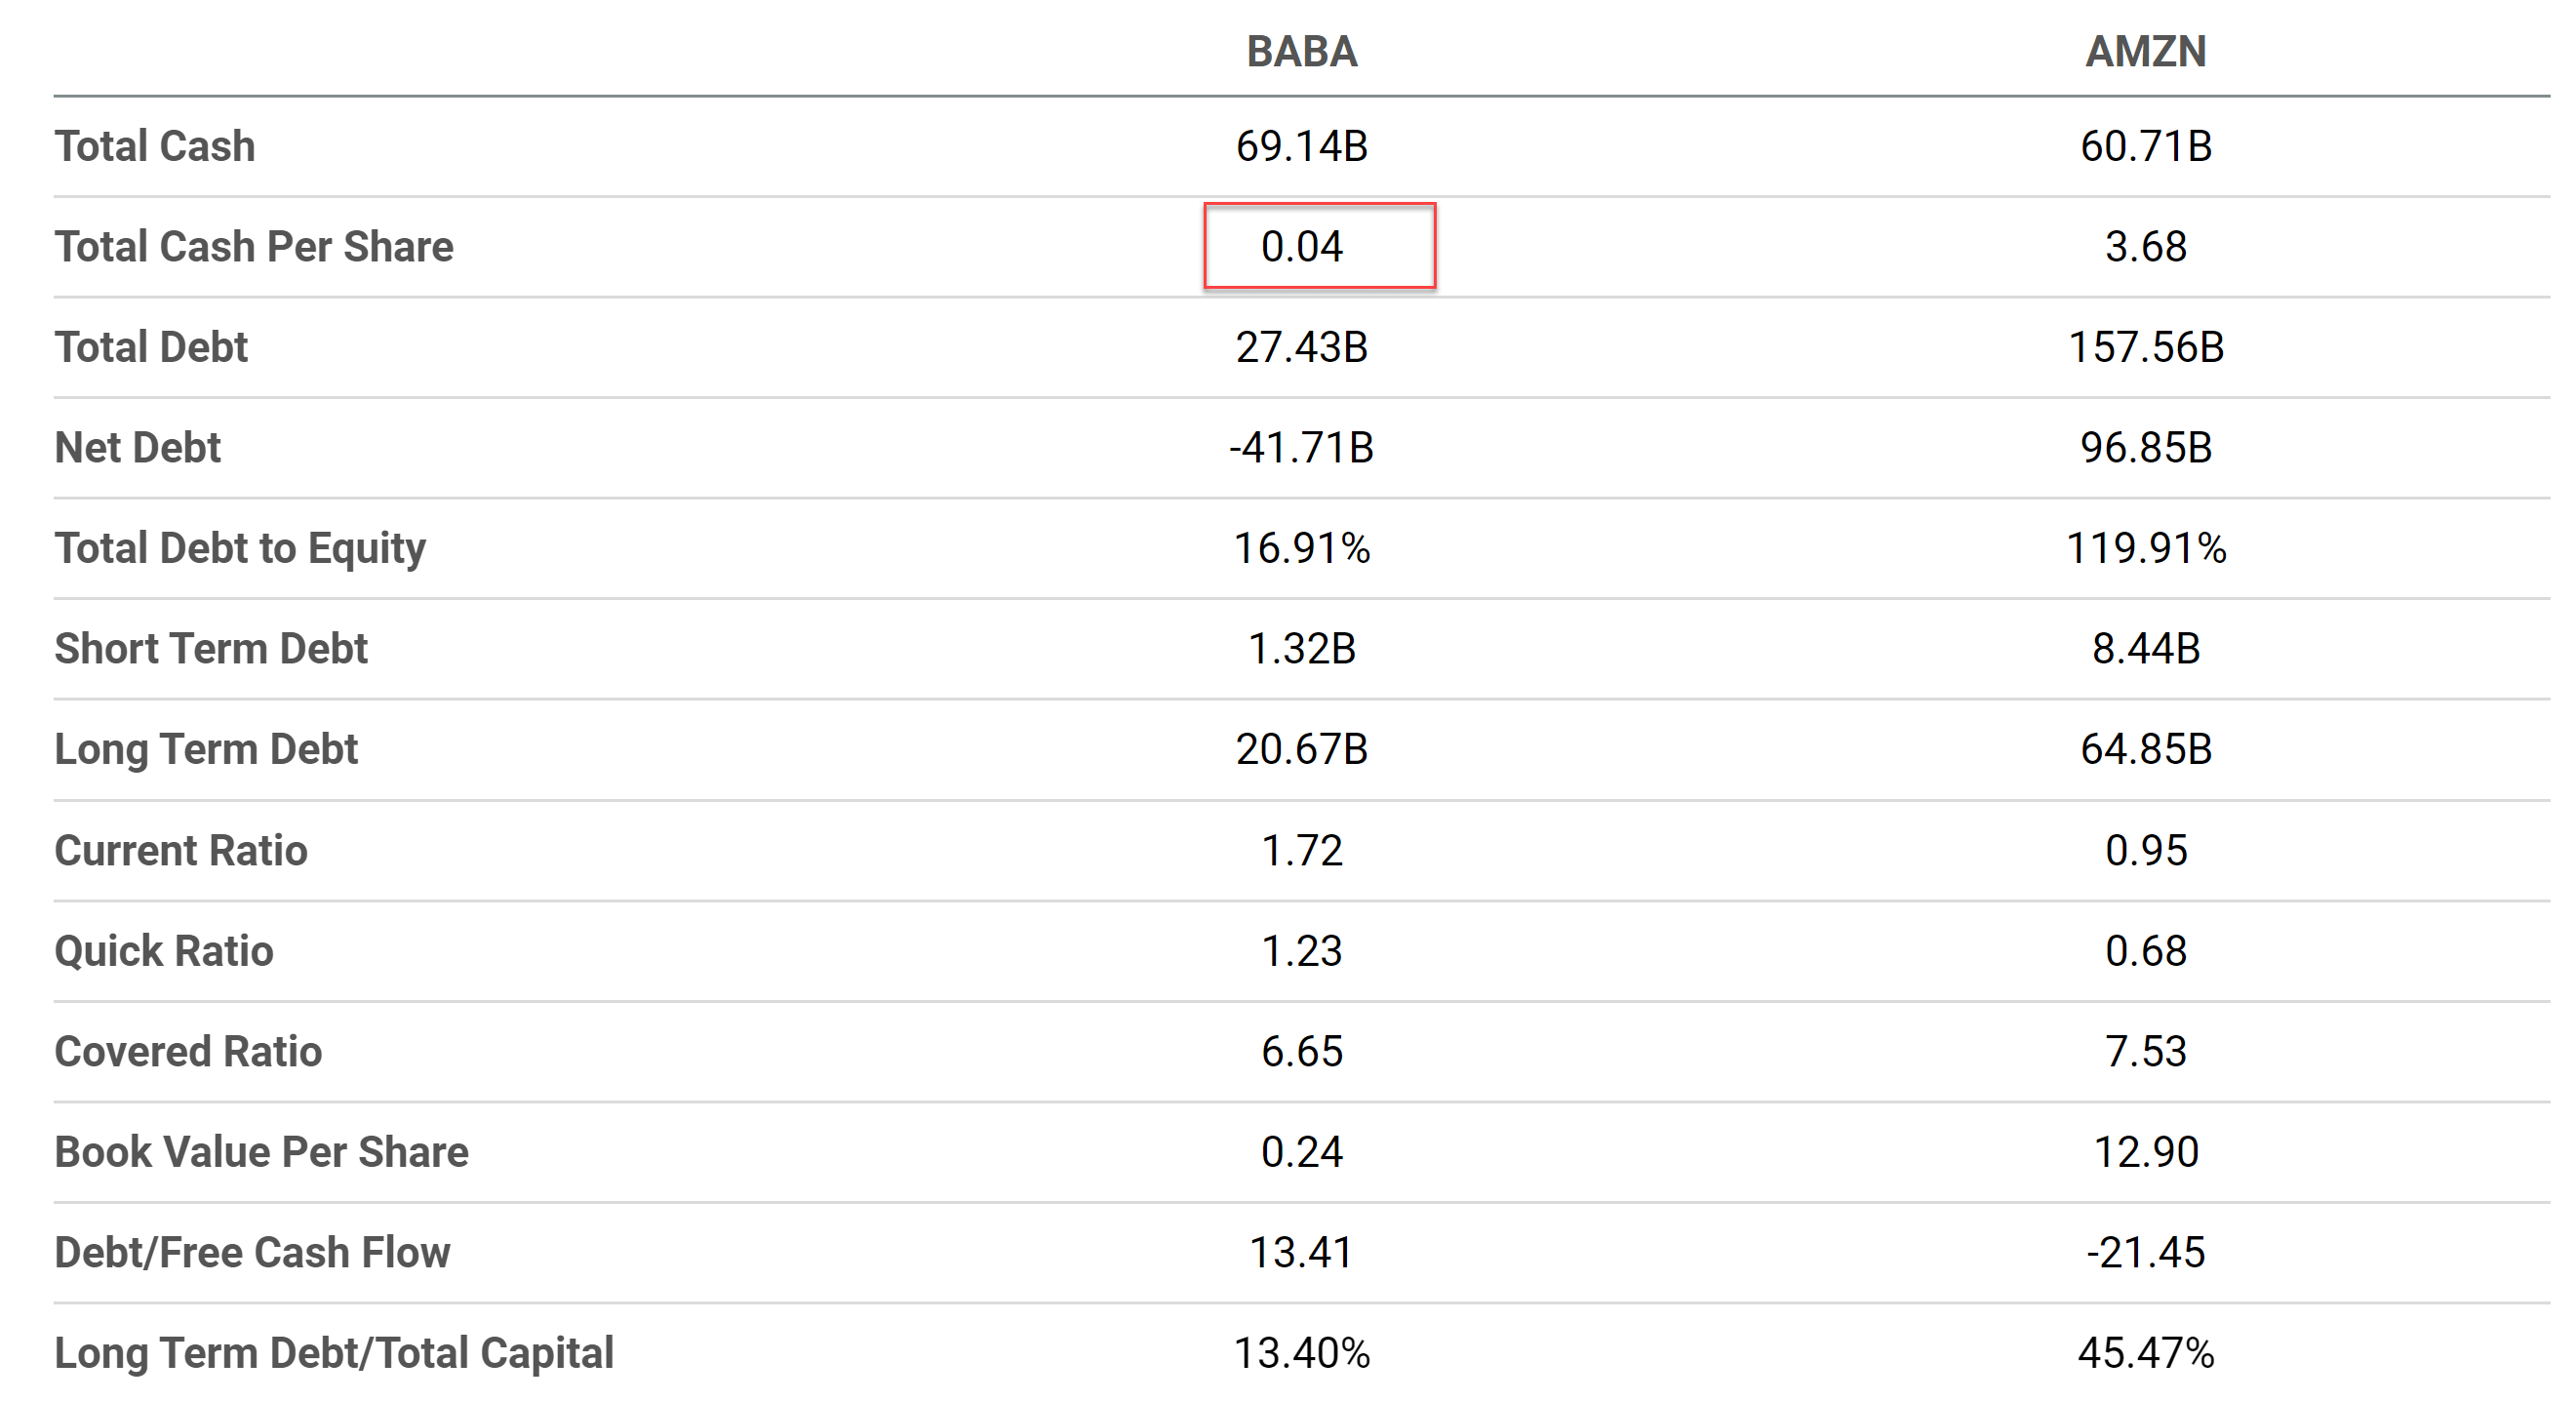
Volatility mispricing and option play
As mentioned above, holding the shares directly is a bet on its compressed valuation and growth potential. And an option play can provide a couple of additional advantages, as detailed in my other articles. To recap,
- First, compared to the buy-and-hold strategy, an option can limit your exposure in terms of the total dollar amount.
- Second, it can take advantage of both the valuation mispricing AND also volatility mispricing (the buy-and-hold strategy only benefit from the former).
- Third, it provides a definitive expiration date.
As an example, as of this writing, a BABA call option with a $75 strike price (i.e., near the money) that expires on 12/16/2022 sells at about $7.8 as you can see from the first chart below provided by OIC. So $780 would provide exposure to 100 shares, versus $7.5k if you directly own the shares.
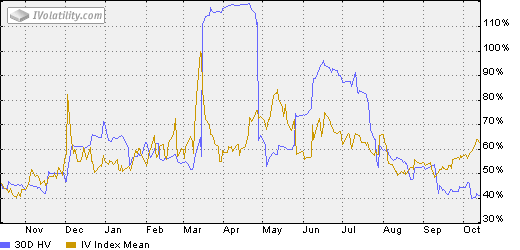
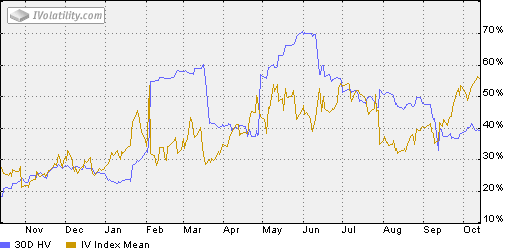
You can also see the implied volatility is only 60.8%. Again, to me, this is an underestimate. As you can see from the second chart below, its IV has ranged from about 50% to about 100% in the past 6 months. And the current IV of 60% is close to the floor of this range. Yet, as argued earlier, recent events and price movements suggest no muting in its actual volatility. Also, as you can see from the third chart below, AMZN’s current IV is close to 60% too (about 56%). However, as aforementioned, the DAILY price actions in BABA shares are nearly on the same magnitude as AMZN’s monthly price fluctuations.
oic.ivolatility.com BABA historical and implied volatility provided by IVolatility.com AMZN historical and implied volatility provided by IVolatility.com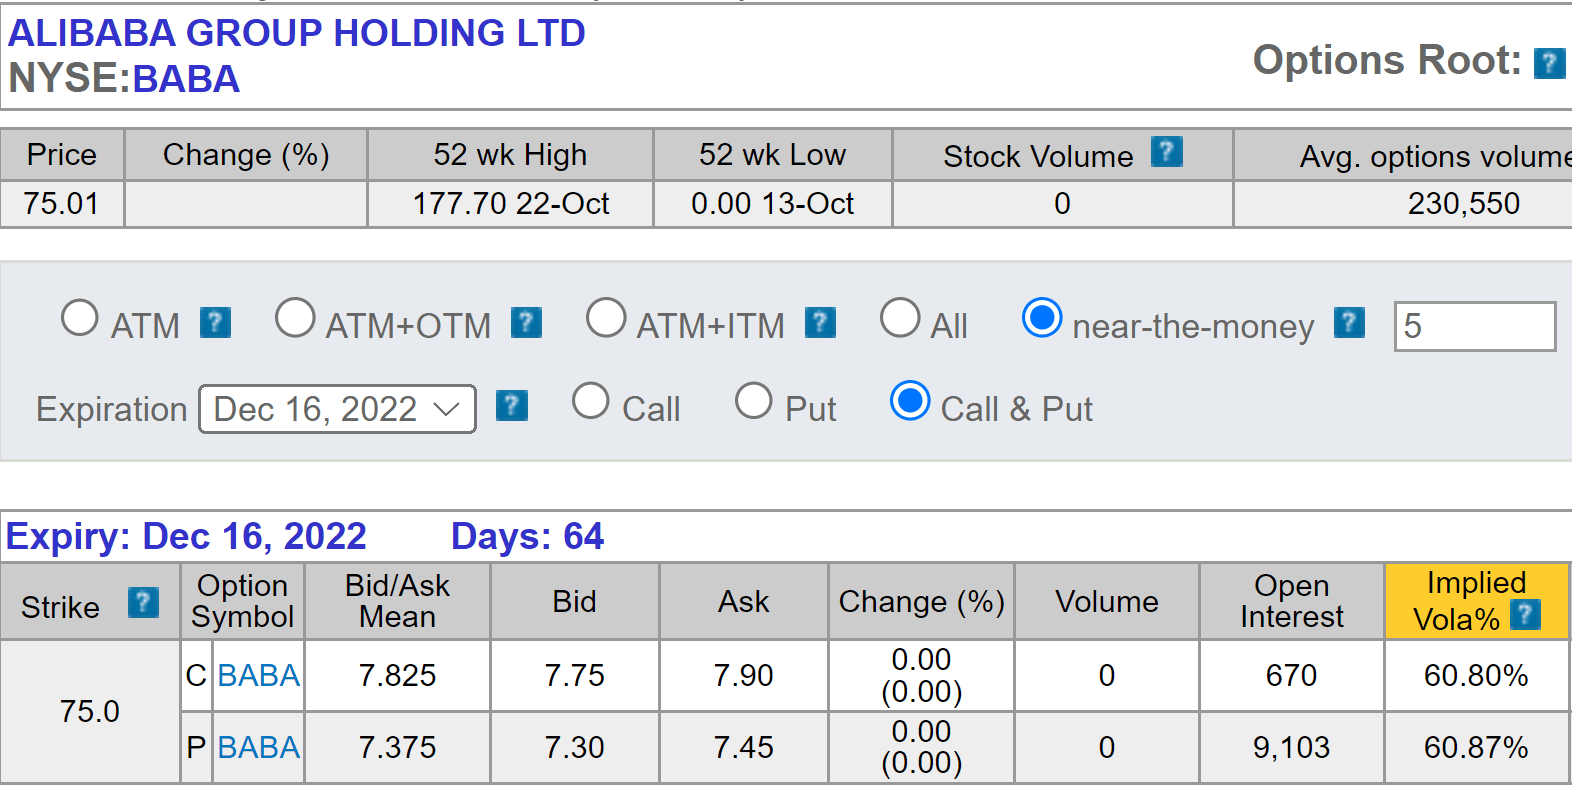
Baba risks and final thoughts
Since an option play, in a sense, is a way to limit risks already, I won’t detail the specific risks surrounding BABA shares. Other SA authors have elaborated on the risks eloquently already anyway. Here, let me just repeat the risks inherent in writing options:
Writing options can limit risks in terms of the absolute dollar amount. But it is riskier in relative terms. You can lose 100% and there is actually a good chance of that.
To conclude, the main thesis here is built on an observation that I’ve made about BABA’s implied volatility being mispriced. Yes, it is definitely attractive to own the shares directly in my mind (which I do) under current conditions. The stock is priced at single-digit FWD PE with double-digit growth rates. And it has about $26.5 of cash per ADR on its ledger, more than 1/3 of its stock current price. But an option play could bring an additional catalyst to the table. The upcoming earnings report in November could amplify the mispricing, judging by the recent historical pattern of its price movements around earnings reports.
Be the first to comment