

maybefalse
Q3 preview and thesis
Alibaba (NYSE:BABA) is scheduled to report its Q3 earnings on 11/17/2022. Its Q2 earnings (reported on August 4, 2022) surprised the market by a large beat. Its Q2 EPS came in at $1.40, beating consensus estimates by $0.57. However, there are many factors for Q3 that can keep investors nervous. First, the COVID situation is still ongoing. Chinese officials are reported to be ramping up the Zero COVID case policy by imposing new lockdowns. Second, the company also faces substantial domestic political uncertainties. President Xi was elected for another 5-year term. And the market reaction since then seems to perceive that regulatory and governmental crackdowns on China’s tech firms like BABA will continue in the years to come. Finally, I would also pay attention to comments from management regarding the impact of international geopolitical tensions on its operations, such as those from the ongoing Russian/Ukraine situation and the U.S.-China trade tensions.
All told, the market consensus estimates expect an EPS of $2.43 in Q3, a 73% increase QoQ. While such a consensus estimate represents a far cry from its EPS of $11.2 back in Q3 2021. Such large variations (both QoQ and YoY) reflect the tremendous uncertainties currently surrounding its earnings.
Hopefully, the thesis here would help to ease your anxiety a bit by taking your focus away from its earnings. In the remainder of this article, you will see that regardless of what happens to its Q3 earnings (which are under large uncertainties), its existing assets (which are much more certain) already exceed its market cap.
Source: www.marketbeat.com
BABA’s main assets
The chart below shows the Asset section of its balance sheet reported on June 30, 2022. As seen, it reported a total asset of $255.05B. And the main assets for BABA consisted of the following items:
- $96.29B of current assets (mainly consisting of $67.65B of cash and equivalents short-term investments and $21.27B receivables)
- $26.55B of Net Property, Plant & Equipment
- $66.69 of various equity investments (such as the Ant Group)
Only these three items already add up to $189.4B, already above its current market cap of $178.1B as of this writing and we will elaborate on this later. Here let’s first check out the liability part of the balance sheet.
Source: BABA Q2 ER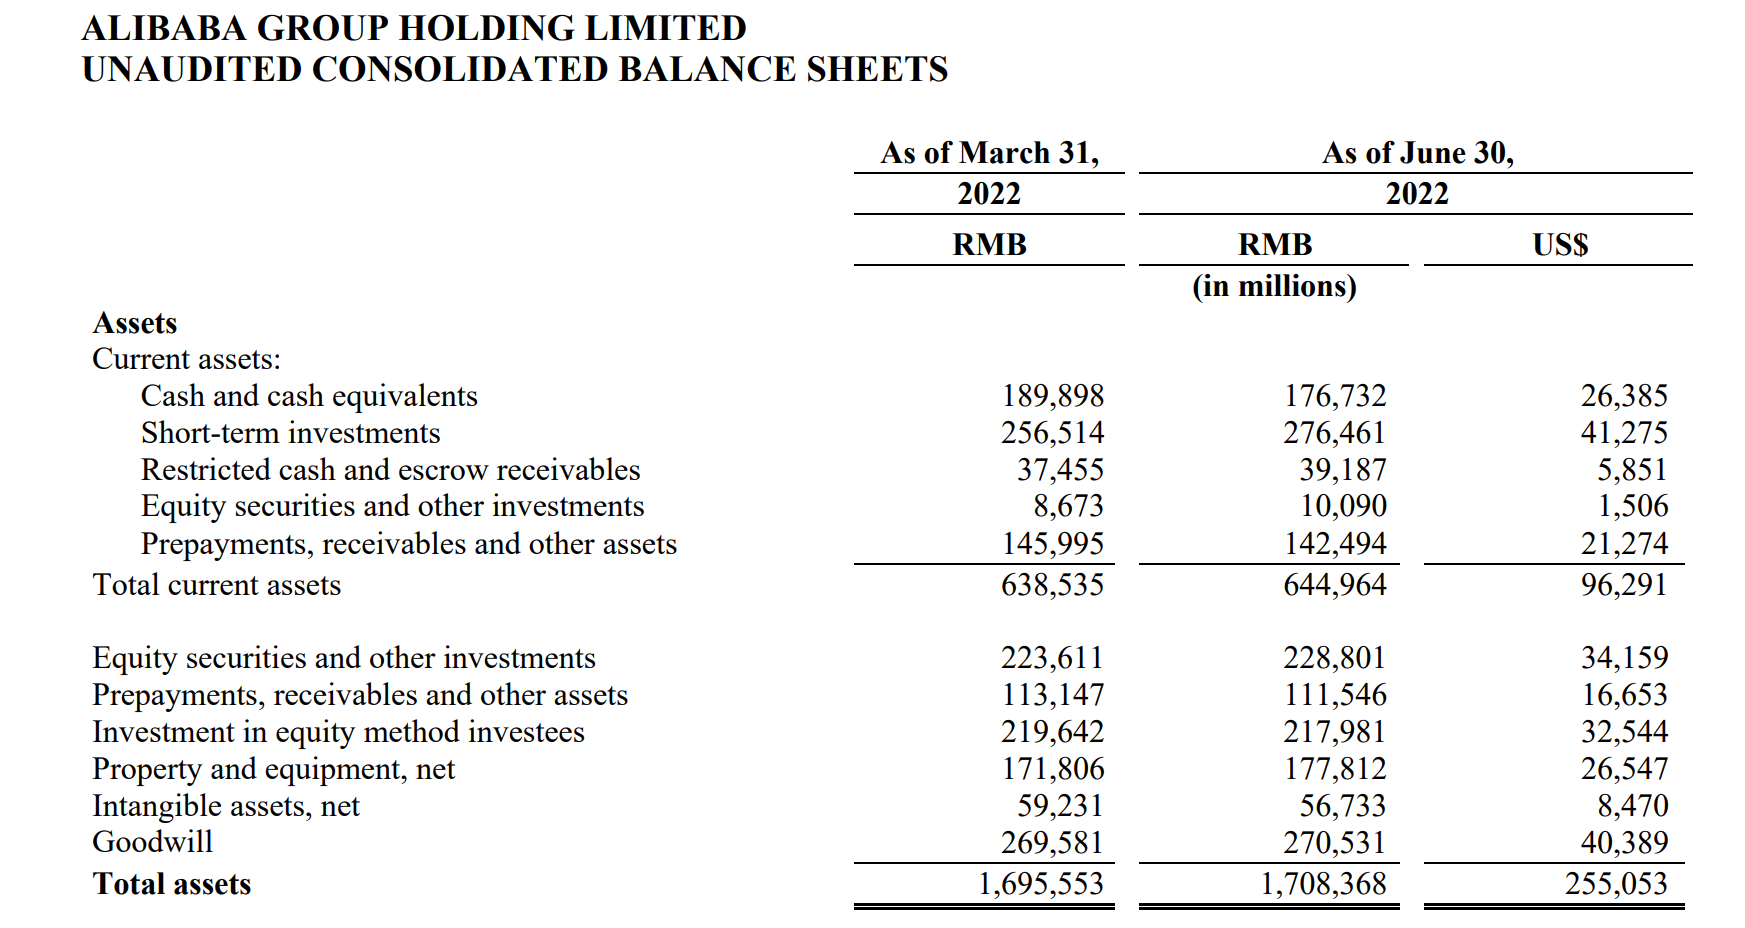
The next chart below shows the liabilities and total equity, again as reported on June 30, 2022. As seen, its total liabilities were about $91.37B. Given its total asset of $255.05B as just aforementioned, its total equity was about $162.29B.
As a result, the three main items that I listed above (with a total of $189.4B) are a bit above its total equity (by about 16%). We will bear this number in mind as we proceed.
Source: BABA Q2 ER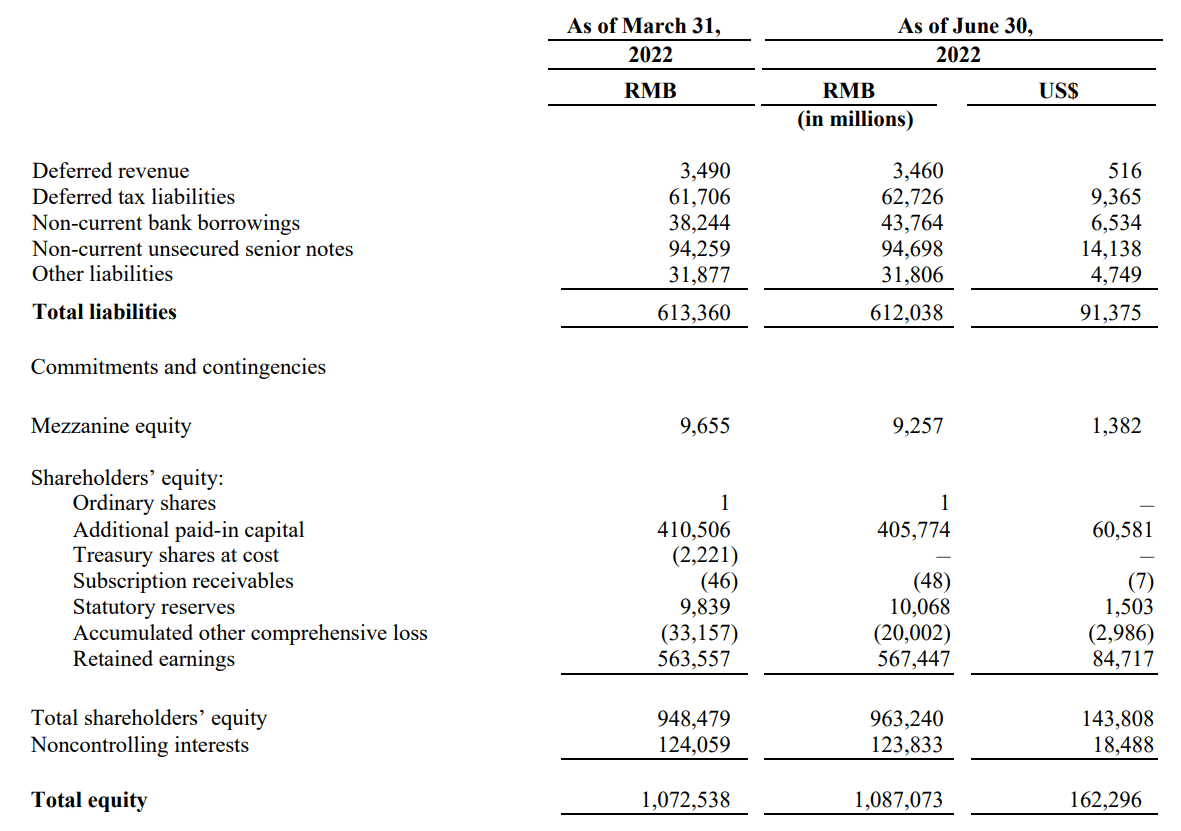
BABA: an asset valuation approach
The next chart shows a simple sum-of-the-parts (“SOTP”) analysis based on the information above. Note this analysis was made based on a diluted share count of 22.038B shares as reported on June 30, 2022 filing. And note that each ADS represents 8 ordinary shares.
A few highlights from the SOTP analysis in particular:
- Currently, more than 54% of its market cap is just current assets ($96.29B out of $178.1B), the asset item that has the least amount of uncertainty.
- Almost 69% of its current market cap is current asset/cash plus its net PPE (properties, plants, equipment), the 2nd more certain asset item in my mind.
- And finally, when we add its equity investments, these three parts would be worth about $189.4B, or $70.88 per ADS.
Compared to its current market cap of $178.1 (or $66.6 share price equivalently), these three items alone are already 6.4% above its market price.
Of course, as mentioned above, these three items exceeded its total equity by about 16% as mentioned above because of its liabilities. So, the margin of safety (“MOS”) here is a bit narrower than 6.4%. But considering that this is an asset valuation approach and we are ignoring all its earnings potential, I think the uncertainties in the current MOS are a secondary issue. To put things in perspective, I am anticipating it to generate about $26B of free cash flow this year, easily exceeding the discrepancy between these three main parts and its total equity.
Source: Author Based on BABA Q2 ER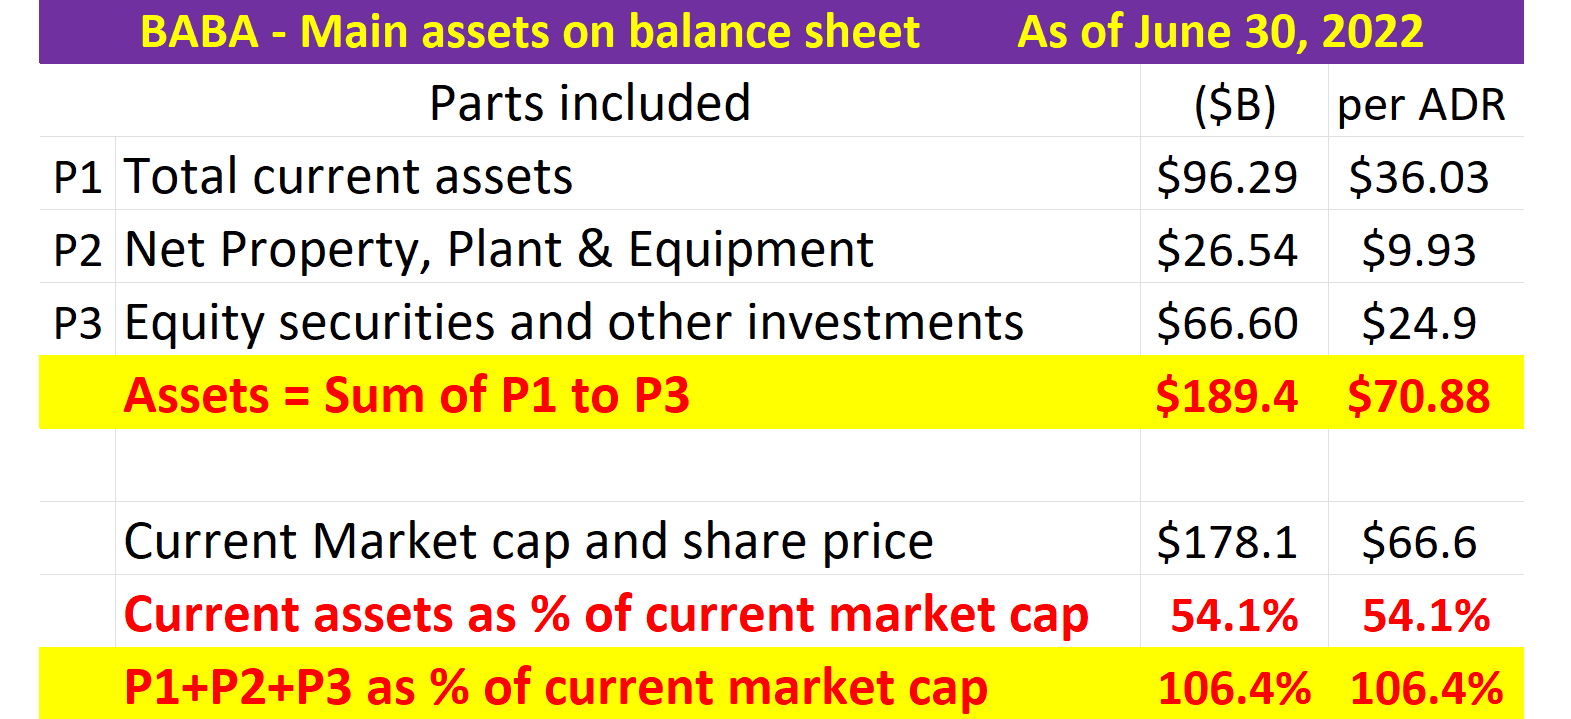
Risks and final thoughts
Besides all the risks mentioned above, a large uncertainty in my above asset valuation involves the valuation of the Ant Group. And the valuation of BABA’s assets can vary by quite a bit depending on the price tag you want apply on its Ant Group. Ant was considered the most valued unlisted company in the world back in 2018 with an anticipated IPO valued at around $315 billion. After the failed IPO and the regulation changes, its valuation shrank substantially but still remained above $200 billion according to estimates from Warburg Pincus LLC. More recently, according to the following Reuters report in June 2022, a revival of the Ant Group IPO seems like a realistic possibility. The following specifics are quoted from this report and slightly edited by me:
Chinese billionaire Jack Ma plans to cede control of Ant Group… after a regulatory crackdown that scuppered its $37 billion IPO in 2020 and led to a forced restructuring of the financial technology behemoth. Ant has informed regulators of Ma’s intention as it prepares to restructure into a financial holding company, the report said, adding regulators didn’t demand the change but have given their blessing.
To add further uncertainties to Ant’s valuation, the timeline for its IPO revival also remains uncertain. According to the following Bloomberg report (also from June 2022 and also slightly edited by me):
Ant Group is poised to apply for a key financial license as soon as this month, according to people familiar with the matter, a sign that its lengthy overhaul following a squashed 2020 listing is getting closer to satisfying China’s financial regulators. The People’s Bank of China intends to accept Ant’s application to become a financial holding company once it’s submitted and will then start a review process, which could take months, said the people, asking not to be identified discussing a private matter. Officials will examine Ant’s capital strength and business plans, as well as the compliance of its shareholders and senior management before a final signoff.
All told, despite the above uncertainties surrounding Ant Group’s valuation, my thesis is that its current market valuation is quite close to its 3 main asset items analyzed in this article (give or take 10%). In particular, more than 54% of its market cap is just current assets (cash and cash equivalent), the asset item that has the least amount of uncertainty. And almost 69% of its current market cap is cash plus its net PPE, the 2nd more certain asset item in my mind. Whatever the uncertainties involved in the Ant Group valuation are limited to the remaining 31%. Hopefully, given that the bulk of its current valuation can be supported just by its assets, this analysis helps to ease your anxiety a bit by taking your focus away from the large uncertainties surrounding its Q3 earnings.
Editor’s Note: This article was submitted as part of Seeking Alpha’s Top Ex-US Stock Pick competition, which runs through November 7. This competition is open to all users and contributors; click here to find out more and submit your article today!
Be the first to comment