

maybefalse/iStock Unreleased via Getty Images
Intro
Before starting this article, I read a number of recent Seeking Alpha publications on Alibaba (NYSE:BABA) and came to the conclusion that there is a consensus among investors regarding this company. No one questions the fundamental undervaluation of Alibaba. But at the same time, the risks associated with this company fully compensate for this undervaluation. In other words, Alibaba is now a matter of risk, not fundamental undervaluation.
But in this article, I do not propose to talk about risks. I suggest doing something different…
I always thought that investment analysis is closer to finance, mathematics and statistics. But now I’m starting to come to the conclusion that the basis here is in the field of psychology.
We always evaluate everything through the prism of subjective perception. Until November 2020, positive expectations for Alibaba were so high that everyone ignored the obvious risks associated with the political structure of China and the complex relationship between Beijing and the United States. When “thunder struck” everything changed exactly the opposite. Now only the lazy do not discuss the risks associated with investing in Alibaba. And it is very possible that this factor is already greatly exaggerated.
So, here’s what I propose to do. Let’s just look at the market and forget we’re dealing with Alibaba. In other words, let’s just see what the market says about this company.
Technical picture of the market
When I follow a stock, I pay a lot of attention to gaps.
A gap is an area discontinuity in a security’s chart where its price either rises or falls from the previous day’s close with no trading occurring in between.
Source: Investopedia
As a rule, gaps indicate very strong support and resistance zones. In addition, the very appearance of a gap indicates the presence of a strong market driver.
Now let’s look at Alibaba quotes:
Source: Trading View, Author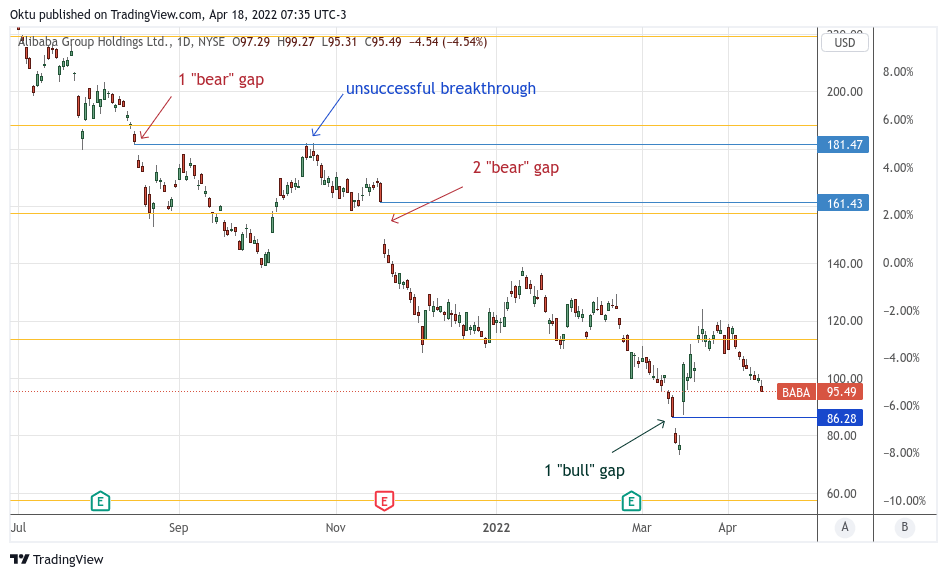
Since July, in the case of Alibaba, there have been 3 gaps. Two of them were “bearish”. This means that subsequently the price could not rise above the gap level. But the last gap, which occurred on March 11, turned out to be “bullish”. This means that after this gap happened, the price not only did not continue to fall, but quickly rose above the level of the appearance of this gap. In general, this is a very bullish sign.
The last gap occurred at $86. Right now, this is a key support level that is likely to be tested soon. But with an eye on the situation, I am not inclined to believe that the price will be able to go lower. This conclusion is purely based on the technical picture.
Abnormal volume and short ratio
The volume of transactions in Alibaba has recently reached unprecedented levels. On March 16, daily volume hit a record 159.83 million:
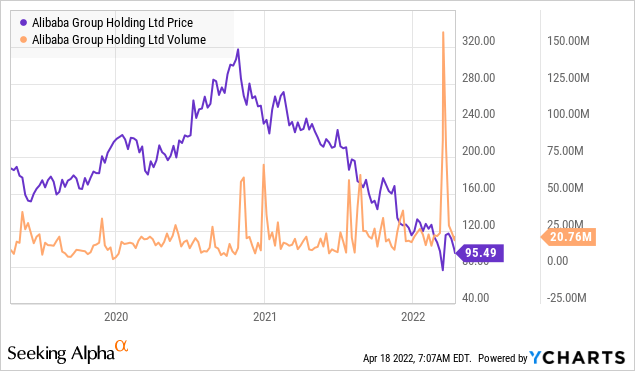
The sharp increase in trading volume means that the price has reached a level where relatively many investors have made long-term decisions about their shares. Let me remind you that just at that time there was a bullish gap, which I talked about in the previous block.
Now let’s talk about the short interest ratio.
Short interest is the number of shares that have been sold short but have not yet been covered or closed out. Short interest, which can be expressed as a number or percentage, is an indicator of market sentiment.
Source: Investopedia
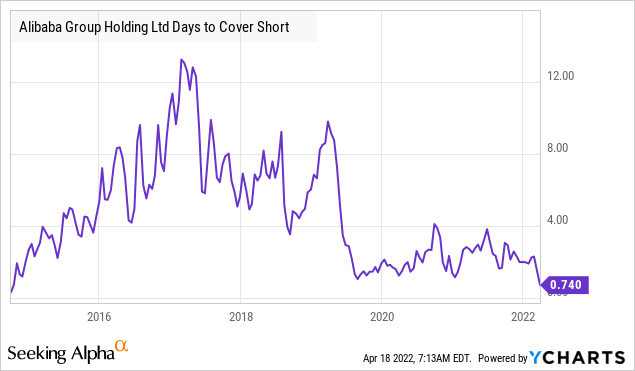
Based on this ratio, the “Days to cover” indicator is calculated. It measures the expected number of days to close out a company’s outstanding shares that have been sold short:
Days to cover = short interest / average daily volume
In the case of Alibaba, “days to cover” is now below the average for the past seven years. If we objectively evaluate this information, then it indicates a weakening of the bearish momentum.
Reaction to market dynamics
It is quite useful to analyze how a company’s stock tends to react to the overall market dynamics. For this purpose, the Beta coefficient is used. In very simplified terms, this coefficient indicates how much the price of a given stock tends to move in the same direction as the market.
However, one can go further and evaluate how the price of a given stock tends to move only when the market is rising, and only when the market is falling. I call such indicators “Bullish” and “Bearish” Beta.
In the case of Alibaba, the rolling monthly “Bearish” Beta remains above one, indicating increased stock volatility:
Author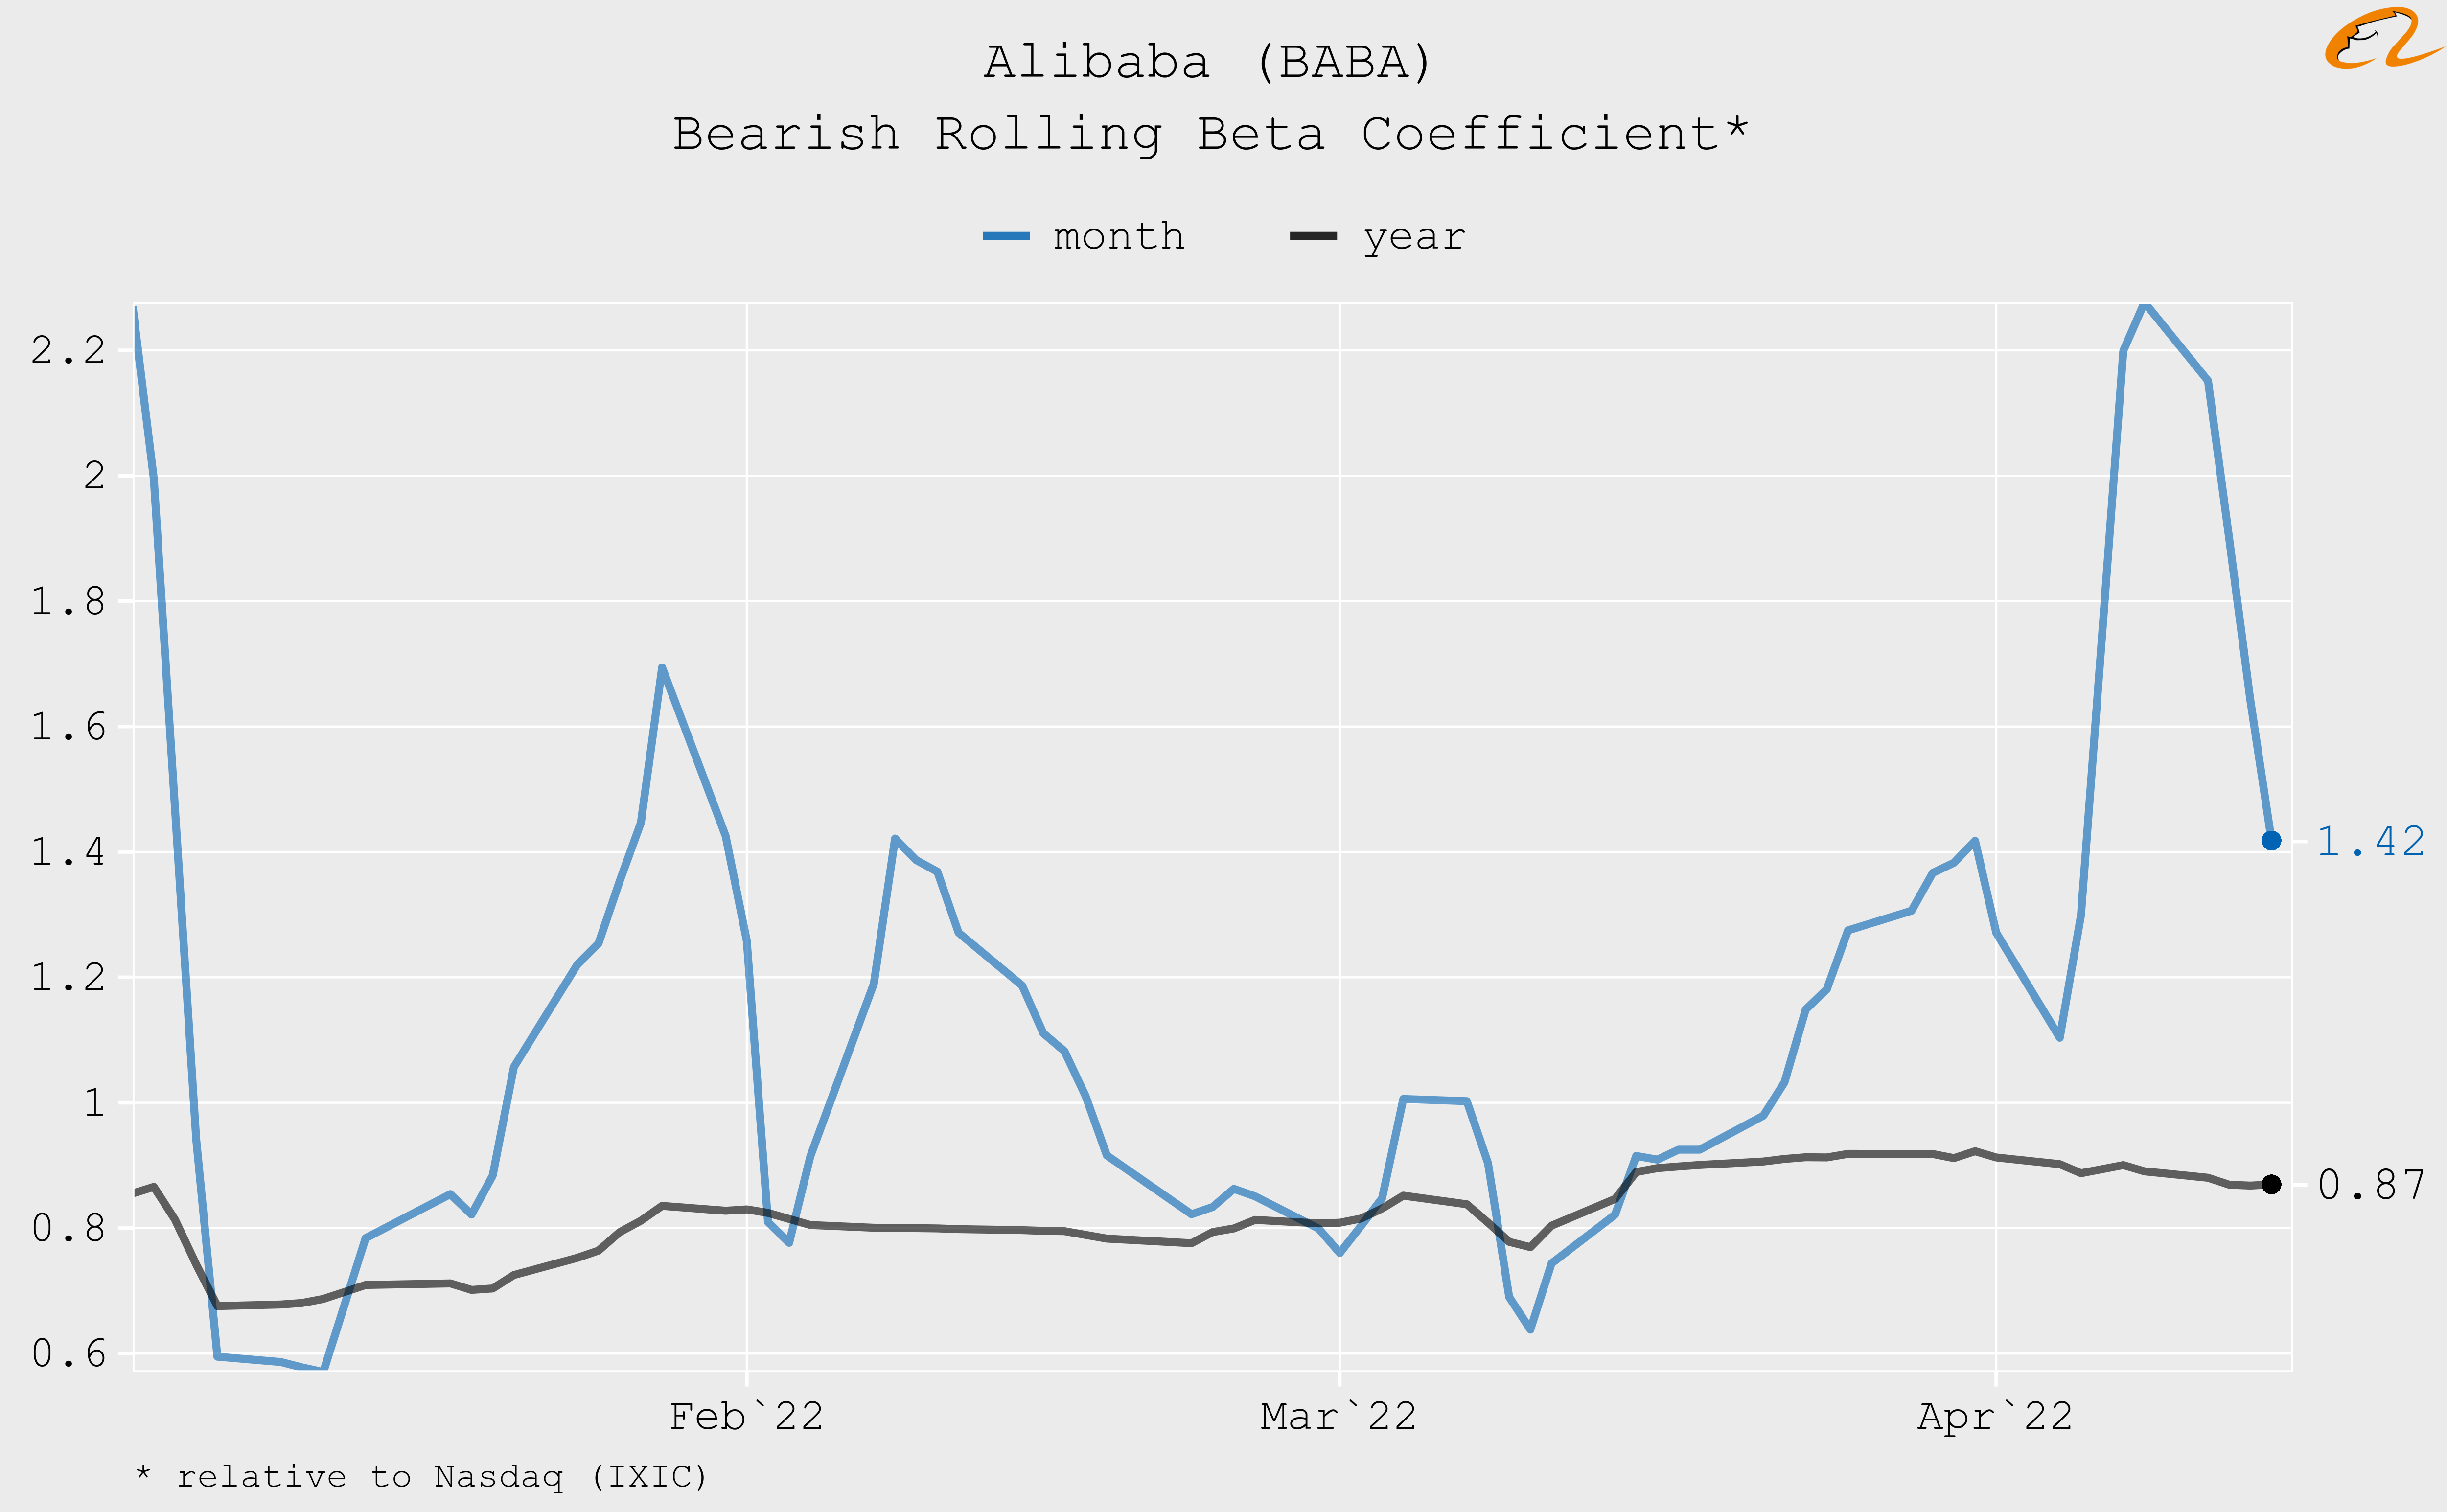
But since April, the “Bullish” Beta has been almost 5. This means that for an average of 1% growth in the market, Alibaba shares responded with a growth of 5%:
Author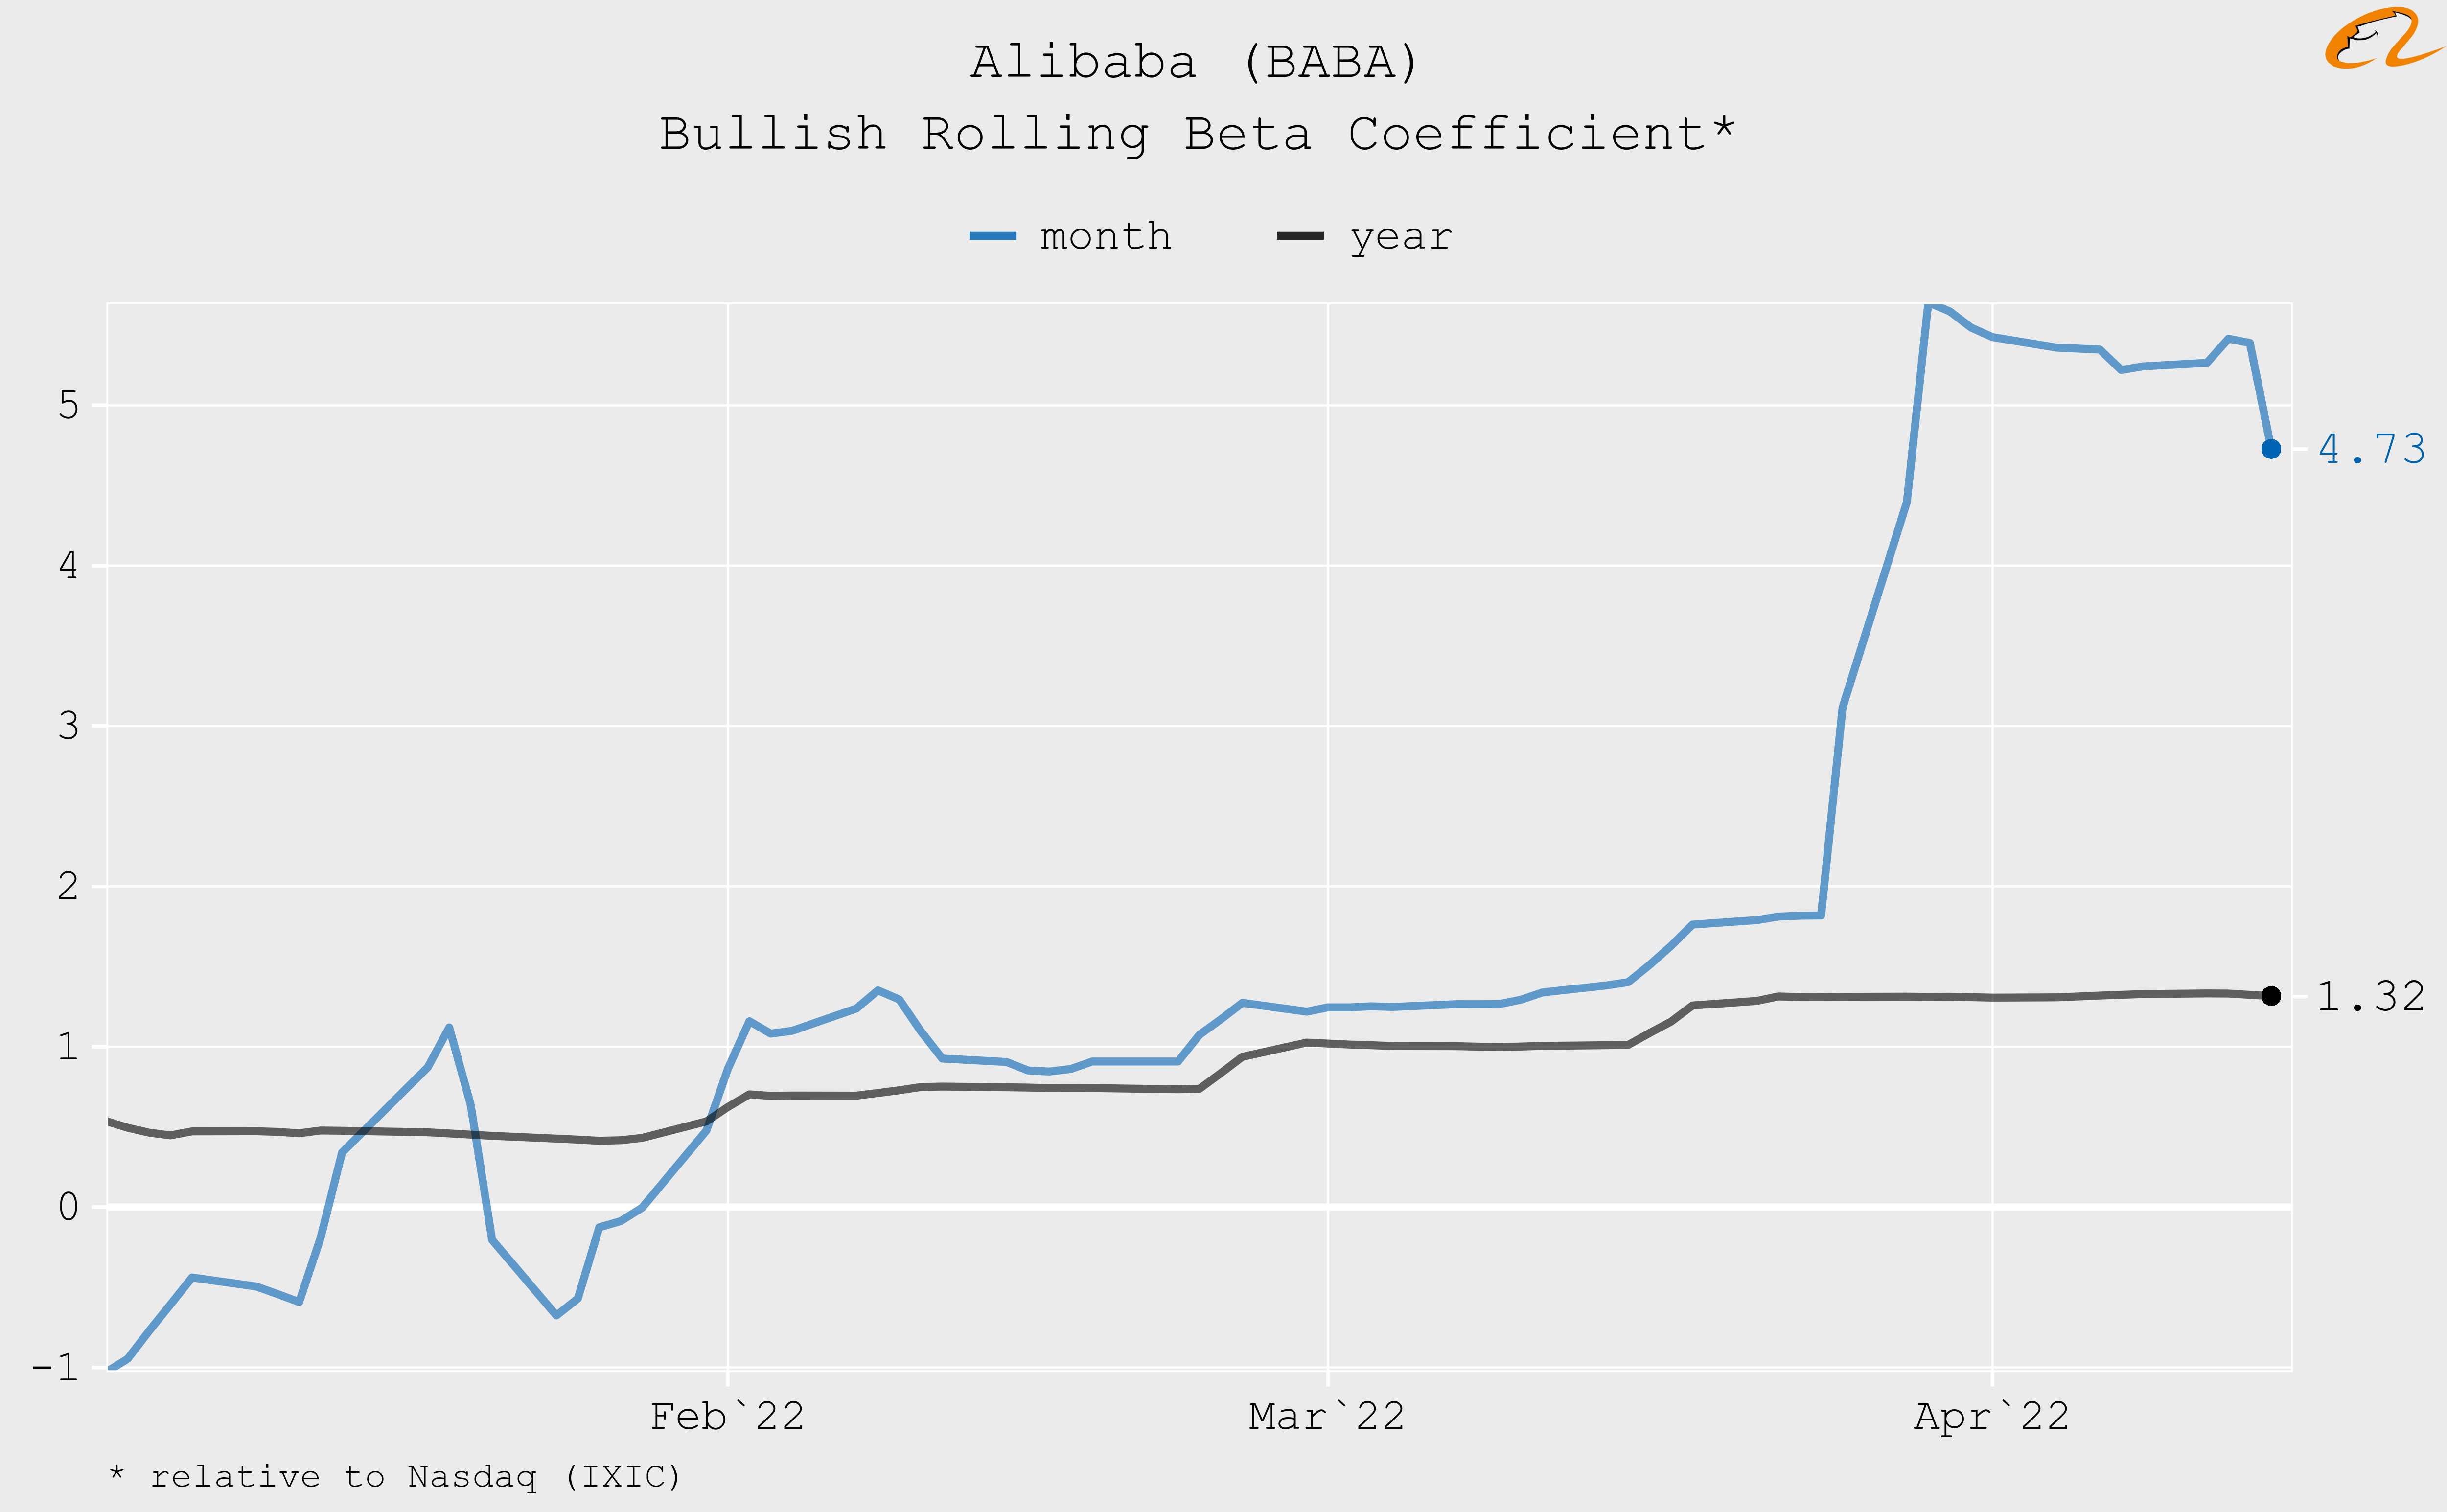
This is statistical evidence that Alibaba’s stock has recently become much more sensitive to growth than to market decline in general.
Bottom line
I will repeat once again that now the fundamental undervaluation of Alibaba is offset by increased investment risks. No one can say for sure how far the price still has to fall for the balance to shift in favor of fundamental undervaluation. But if you look at the market with an open mind, then Alibaba does not cause a desire to sell.
Be the first to comment