

flyingrussian/iStock via Getty Images
Introduction
Houston-based W&T Offshore, Inc. (NYSE: NYSE:WTI) released its second-quarter 2022 earnings report on August 8, 2022.
Note: I have been covering W&T Offshore regularly quarterly since May 2016. This article is an update of my preceding article published on June 6, 2022.
The company specializes in oil production in the Gulf of Mexico, with production in the Gulf of Mexico Shelf (381K acres net) representing 78% of the revenue in 2Q22 and the Gulf of Mexico Deepwater (72K acres net) representing 22%. 2P reserves Mix is 250.1 MMBoe
WTI Global presentation (W&T offshore)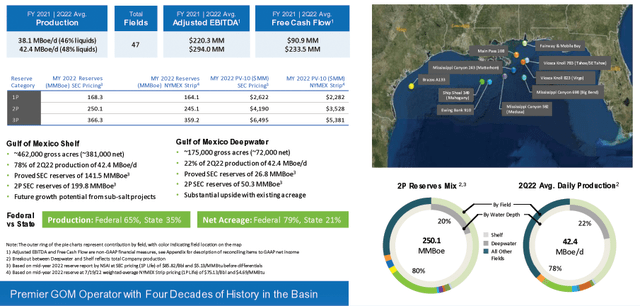
1 – Second quarter of 2022 result snapshot
The Company came out with earnings of $123.44 million or $0.85 per diluted share, beating analysts’ expectations. It compares with a loss of $51.67 million or $0.35 per share a year ago.
Total revenues were a whopping $273.81 million from $132.83 million earned a year ago.
WTI 2Q22 financial (W&T Offshore)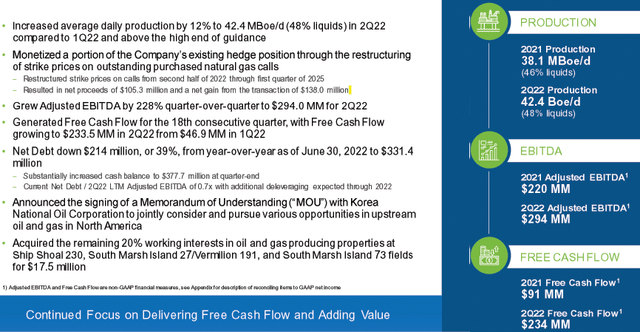
Tracy W. Krohn, Chairman, and Chief Executive Officer, said in the conference call:
Our financial results in the second quarter were among the best quarterly results in our history. Our strategy has always been simple, generate free cash flow, maintain high quality conventional production, and opportunistically capitalize on accretive opportunities to build shareholder value. Our ability to execute and maintain strong operational excellence was a significant driver in our outstanding financial results in the second quarter.
2 – Investment Thesis
The investment thesis is changing with the oil prices outlook, and I believe it is perhaps time to invest in this small E&P Company for the long term. I still do not think it is reasonable to invest a significant amount due to the volatility and cyclicity of the industry. Furthermore, the company is not paying any dividends.
In my preceding article, I considered the stock overbought and recommended a sell. I was right. The stock has retraced significantly since and looks attractive now.
Thus, I believe that the best trading/investing strategy is to trade short-term LIFO the volatility and keep a medium core long-term position for an eventual higher payday. This simple dual strategy is the most rewarding, in my opinion, and is what I suggest in my marketplace, “The Gold And Oil Corner.”
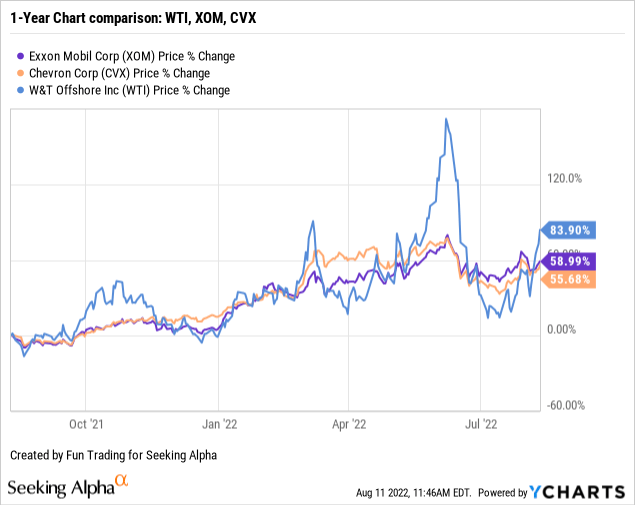
3 – Stock performance
WTI has outperformed Chevron Corporation (CVX) and Exxon Mobil (XOM) and is now up 84% on a one-year basis. However, WTI has tumbled since June.
W&T Offshore, Inc. – Financial and Production 2Q22 – The Raw Numbers
| W&T Offshore, Inc. | 2Q21 | 3Q21 | 4Q21 | 1Q22 | 2Q22 |
| Total Revenues in $ Million | 132.83 | 133.95 | 165.59 | 191.00 | 273.81 |
| Net Income in $ Million | -51.67 | -37.96 | 48.90 | -2.46 | 123.44 |
| EBITDA $ Million | -16.93 | 1.34 | 108.84 | 47.65 | 207.07 |
| EPS diluted in $/share | -0.36 | -0.27 | 0.34 | -0.02 | 0.85 |
| Cash from operations in $ Million | 1.23 | 65.10 | 22.38 | 27.54 | 210.22 |
| Capital Expenditure in $ Million | 4.281 | 10.17 | 16.70 | 47.59 | 25.52 |
| Free Cash Flow in $ Million | -3.05 | 54.93 | 5.68 | -20.06 | 184.70 |
| Total Cash in $ Million | 209.15 | 257.58 | 245.80 | 215.48 | 377.72 |
| Total LT Debt in $ Million | 754.69 | 742.37 | 730.90 | 720.32 | 709.17 |
| Shares outstanding (diluted) in Million | 142.24 | 142.30 | 142.39 | 142.94 | 144.53 |
| Oil Production | 2Q21 | 3Q21 | 4Q21 | 1Q22 | 2Q22 |
| Oil Equivalent Production in K Boepd | 40.9 | 34.8 | 37.2 | 37.8 | 42.4 |
| Realized price ($/Boe) | 34.75 | 41.05 | 47.70 | 55.29 | 69.55 |
Source: Company 10Q
Analysis: Revenues, Earnings Details, Net Debt, Free Cash Flow, And Oil-Equivalent Production
1 – Total Revenues of $273.81 million in 2Q22
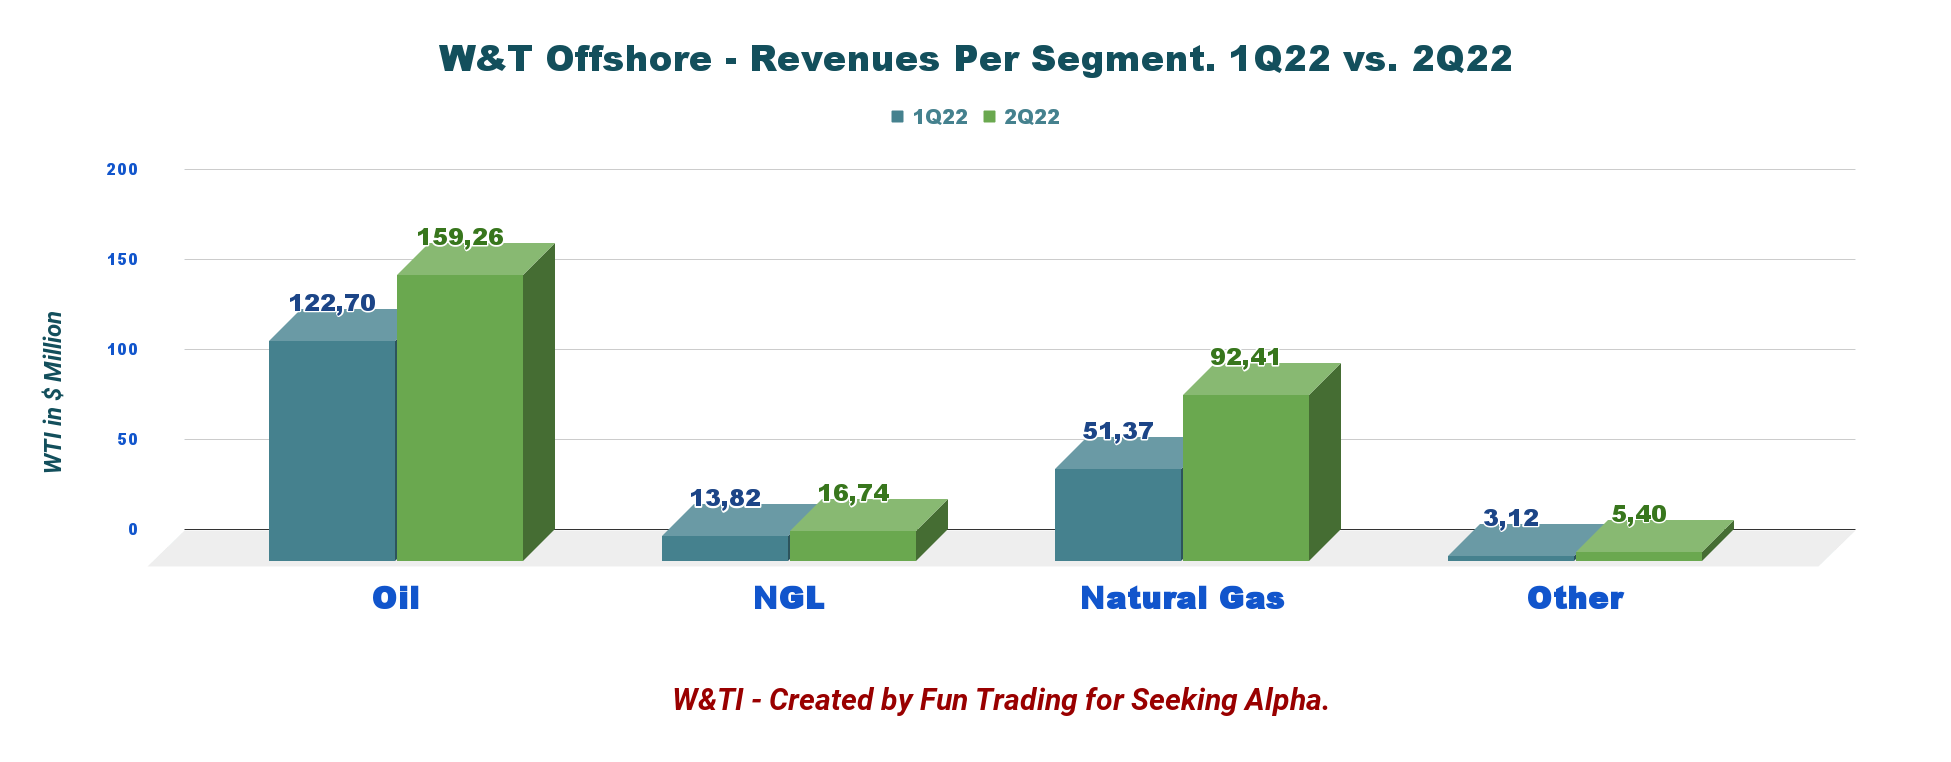
WTI Quarterly Revenues history (Fun Trading) WTI Quarterly revenue per segment 1Q22 versus 2Q22 (Fun Trading)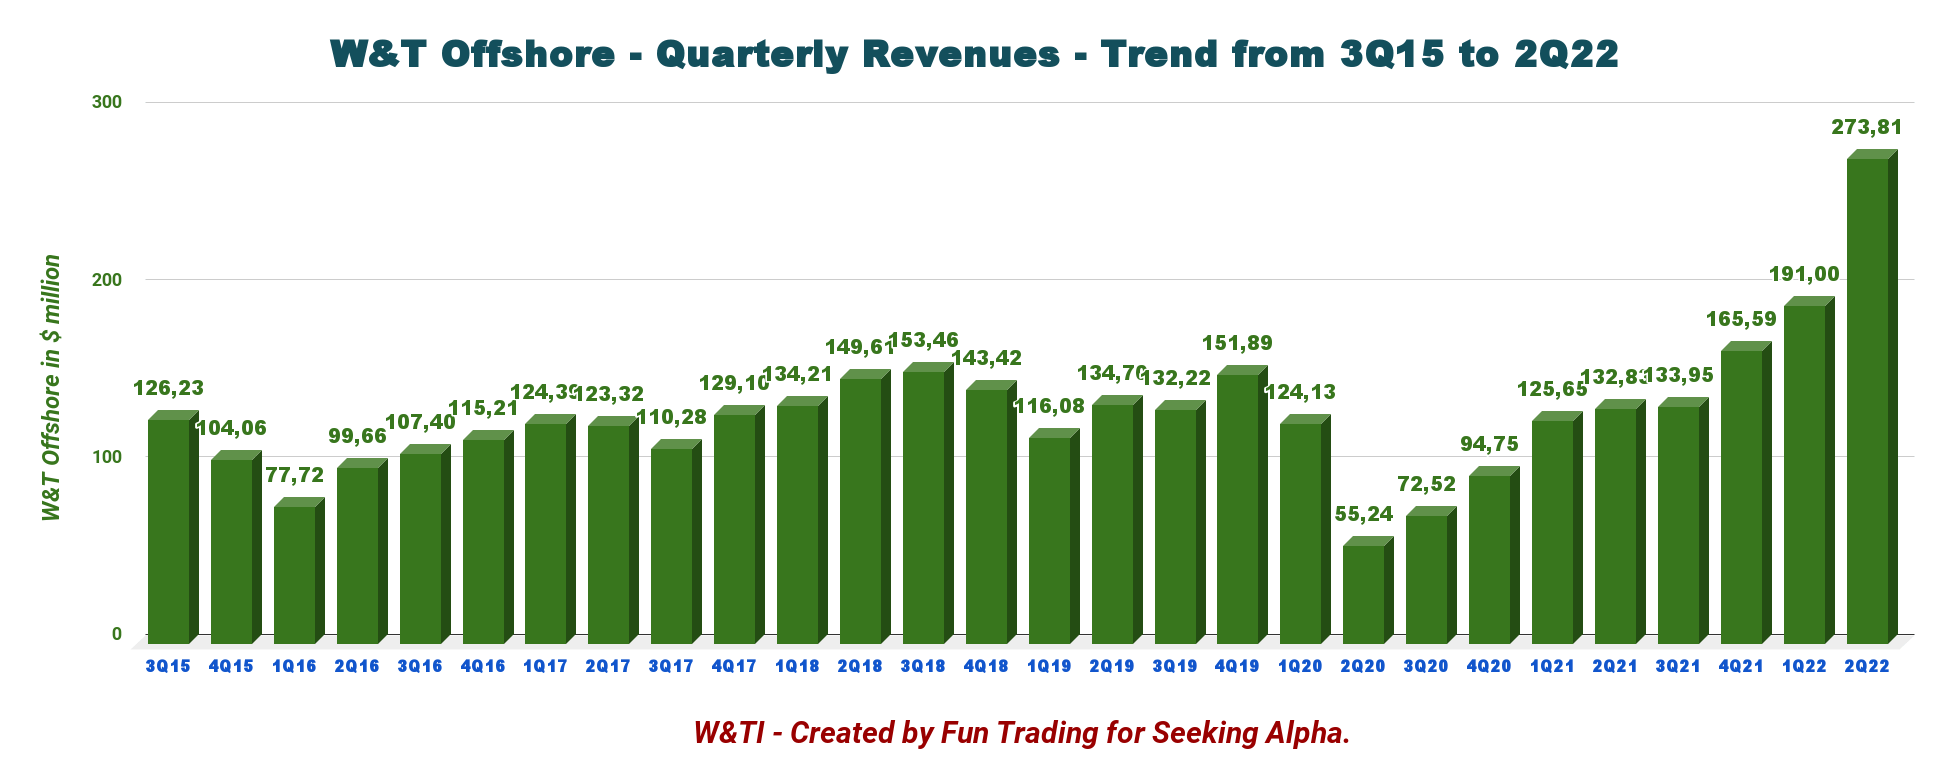
The Company reported a net income of $123.44 million or $0.85 per diluted share. The adjusted EBITDA increased by 228% quarter-over-quarter to $294.0 million, and adjusted Net Income totaled $190.52 million, or $1.32 per diluted share in the second quarter of 2022.
W&T Offshore monetized a portion of the Company’s existing hedge position through restructuring strike prices on outstanding purchased natural gas calls this quarter, resulting in net proceeds of $105.3 million and a net gain from the transaction of $138.0 million. In the press release:
For the remainder of 2022, W&T is approximately 25% hedged for oil and is fully hedged for natural gas. As part of the monetization described above, the Company restructured its purchased call options on natural gas to increase the weighted-average strike price to $7.48 per MMBTU from $3.78 per MMBTU for the balance of 2022. These calls cover approximately 85% of its anticipated natural gas production for the balance of 2022.
The company also announced the signing of a Memorandum of Understanding (“MOU”) with Korea National Oil Corporation to jointly consider and pursue various opportunities in upstream oil and gas in North America
And finally, WTI acquired the remaining 20% working interests in oil and gas producing properties at Ship Shoal 230, South Marsh Island 27/Vermilion 191, and South Marsh Island 73 fields for $17.5 million.
2 – The free cash flow was a loss of $184.7 million in 2Q22
WTI Quarterly Free cash flow history (Fun Trading)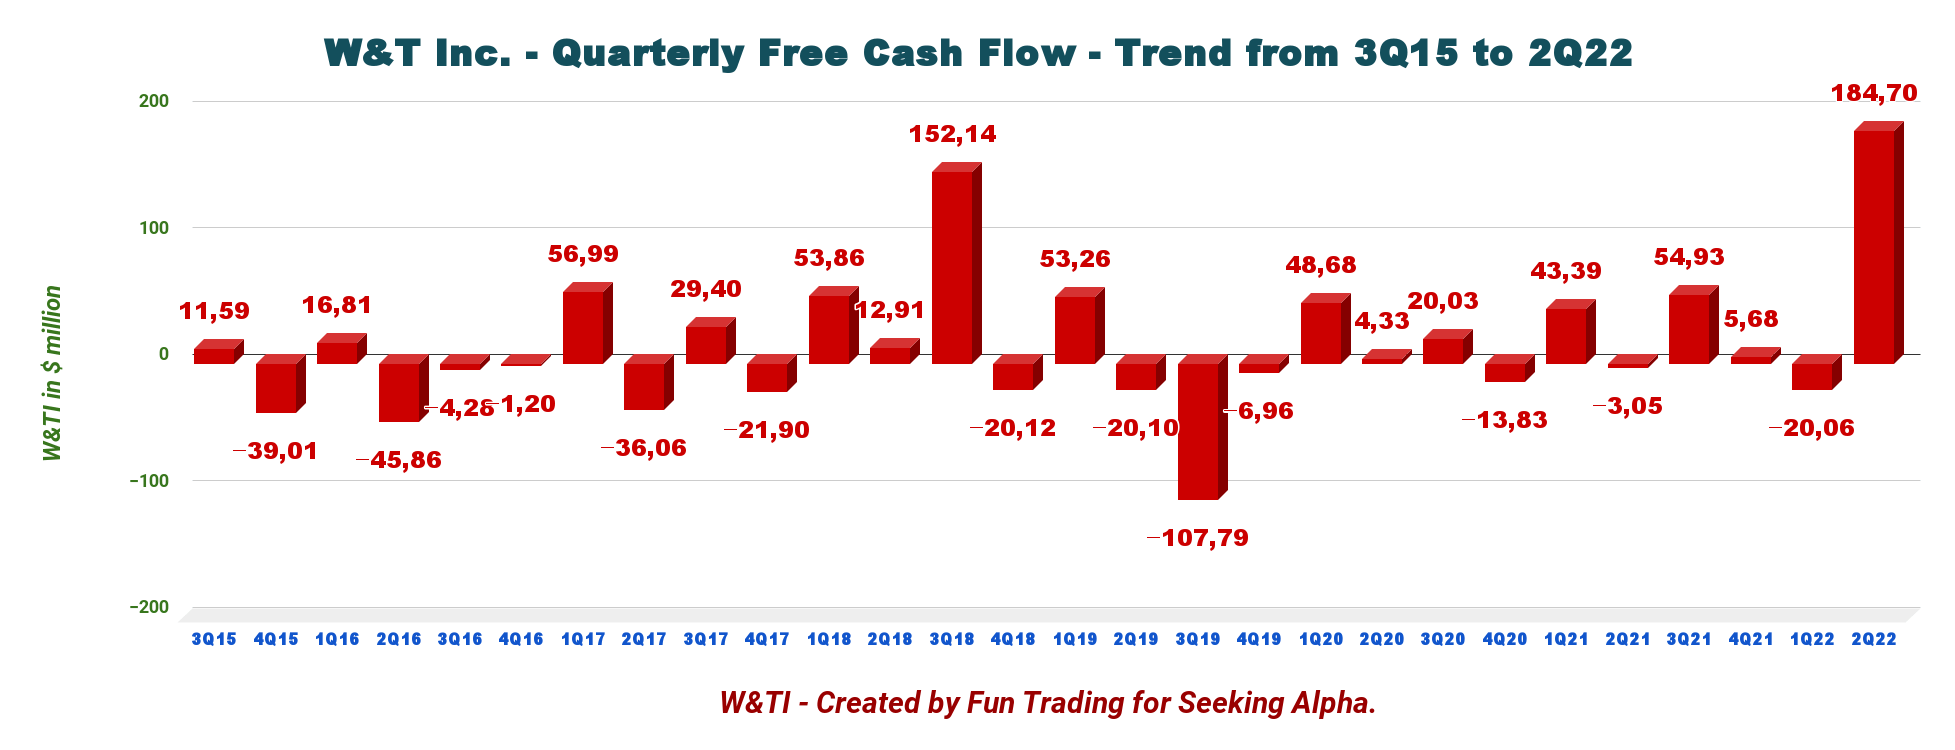
W&T Offshore’s trailing 12-month free cash flow was $225.25 million, with $184.70 million for 2Q22.
3 – Oil equivalent production and other considerations
WTI Quarterly Oil equivalent Production history (Fun Trading)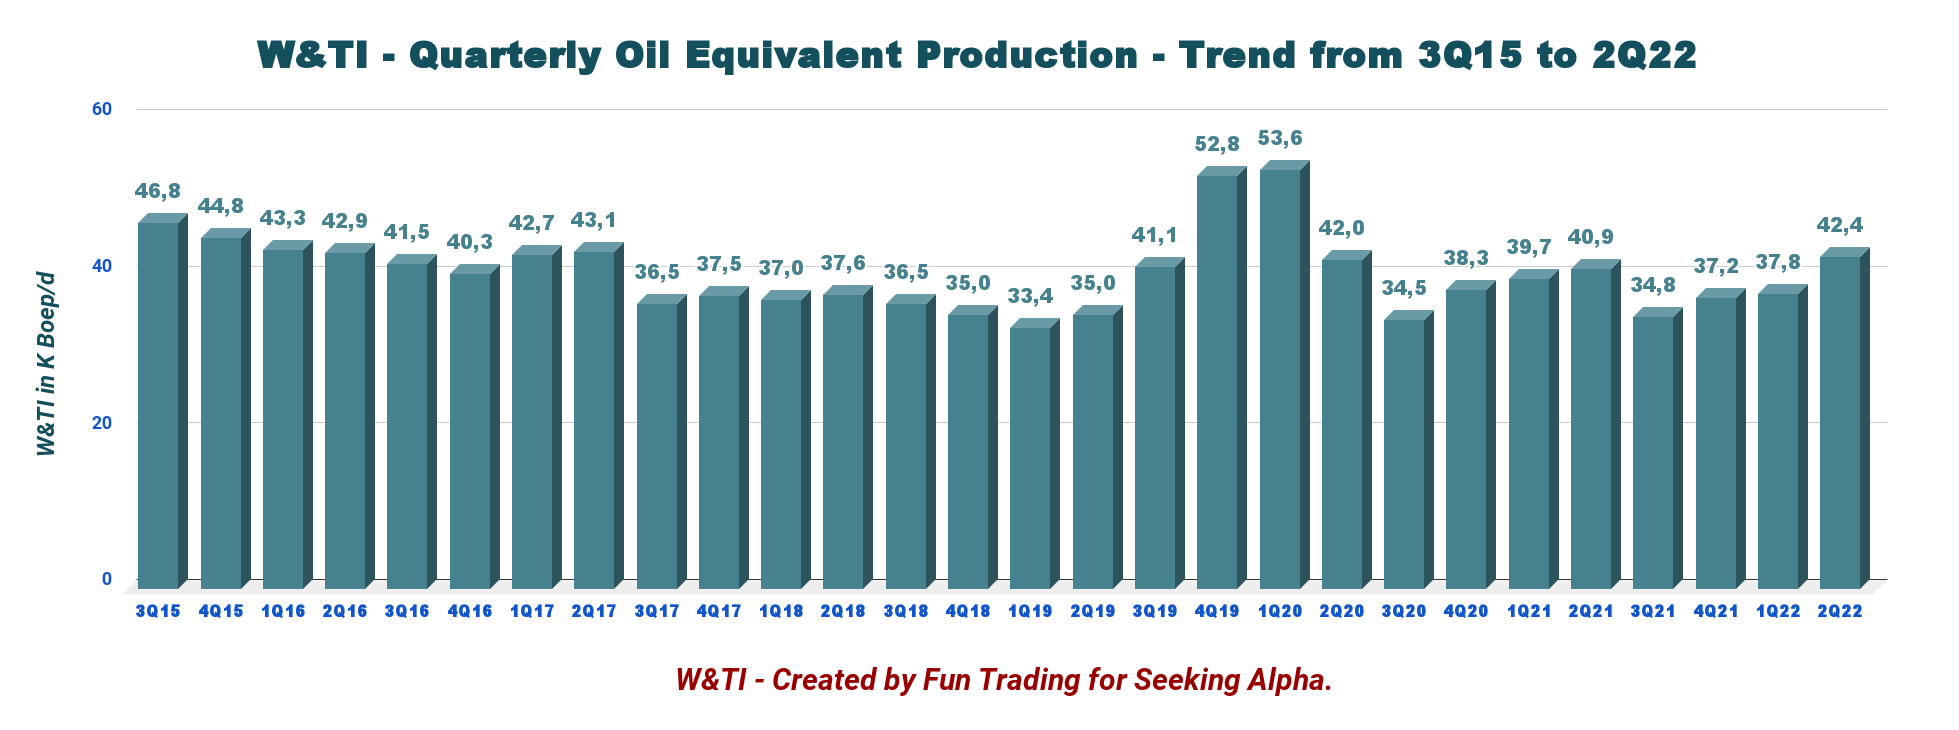
3.1 – Oil equivalent production
Production for the second quarter of 2022 was 42.4k Boep/d, which was above the midpoint of the guidance range provided for the quarter. It represented an increase of 12.2% compared to 1Q22 and up 3.7% from 40.9K Boepd for the corresponding period in 2021.
3.2 – Details production QoQ:
WTI Quarterly production per segment comparison 1Q22 versus 2Q22 (Fun Trading)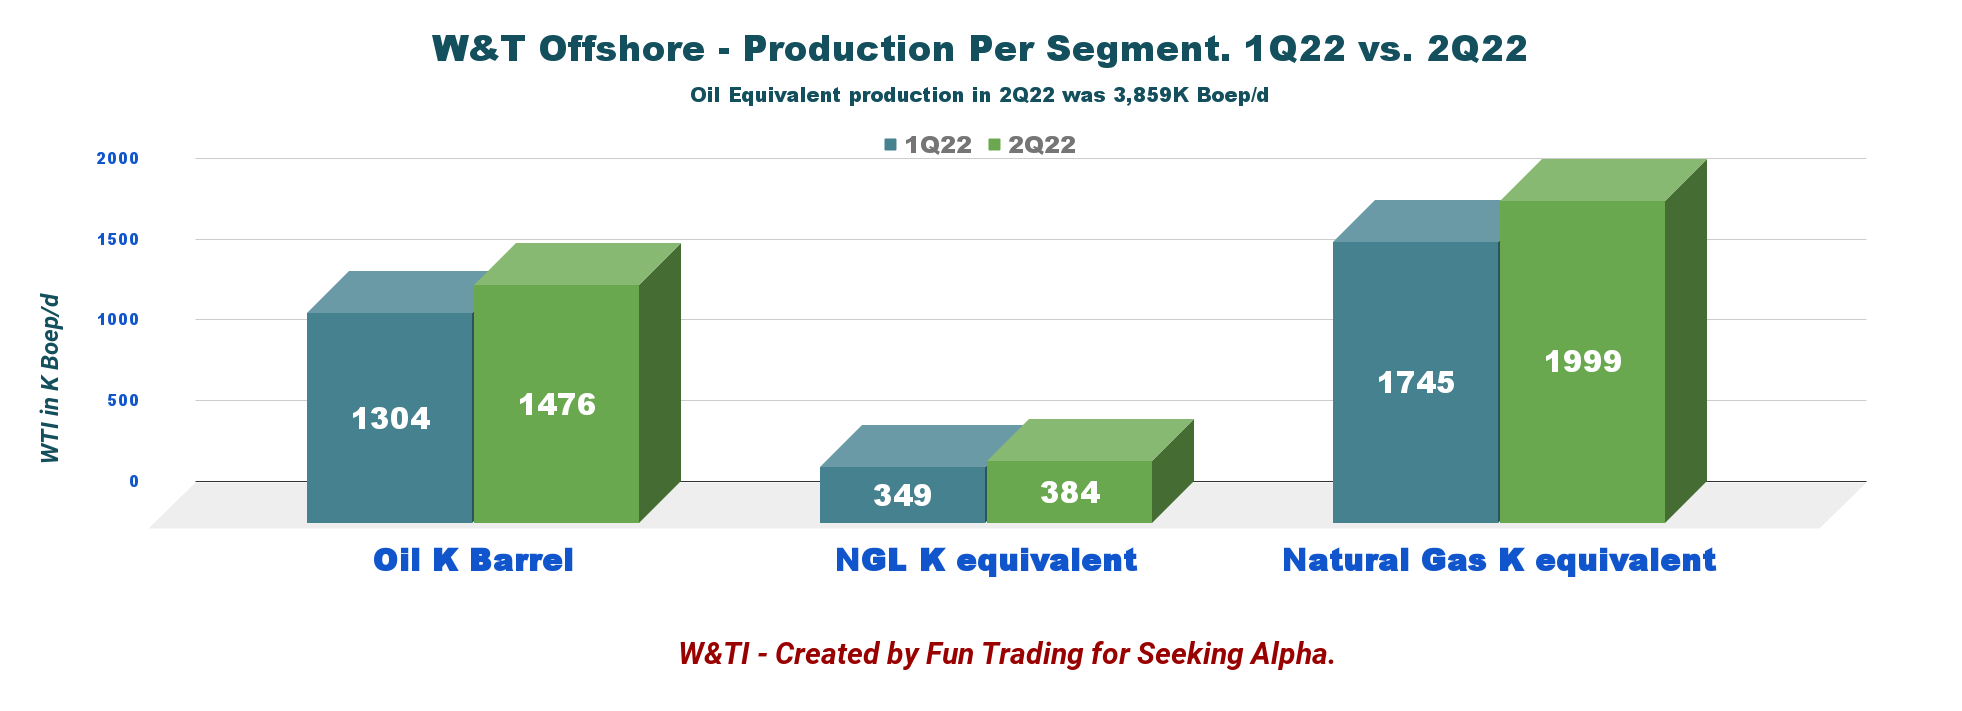
W&T’s average realized price per barrel of oil equivalent (“Boe”) before realized derivative settlements was a record of $69.55 per Boe in the second quarter of 2022, an increase of 25.8% from $55.29 per Boe in the first quarter of 2022 and a double from $34.75 per Boe in the second quarter of 2021.
Before realized derivative settlements, crude oil, NGL, and natural gas prices for the second quarter of 2022 were $107.90 per barrel, $43.58 per barrel, and $7.70 per Mcf, respectively.
Liquids (oil and NGL) represented 48.2% of the total production in the quarter.
WTI Quarterly Production and price per Boe history (Fun Trading)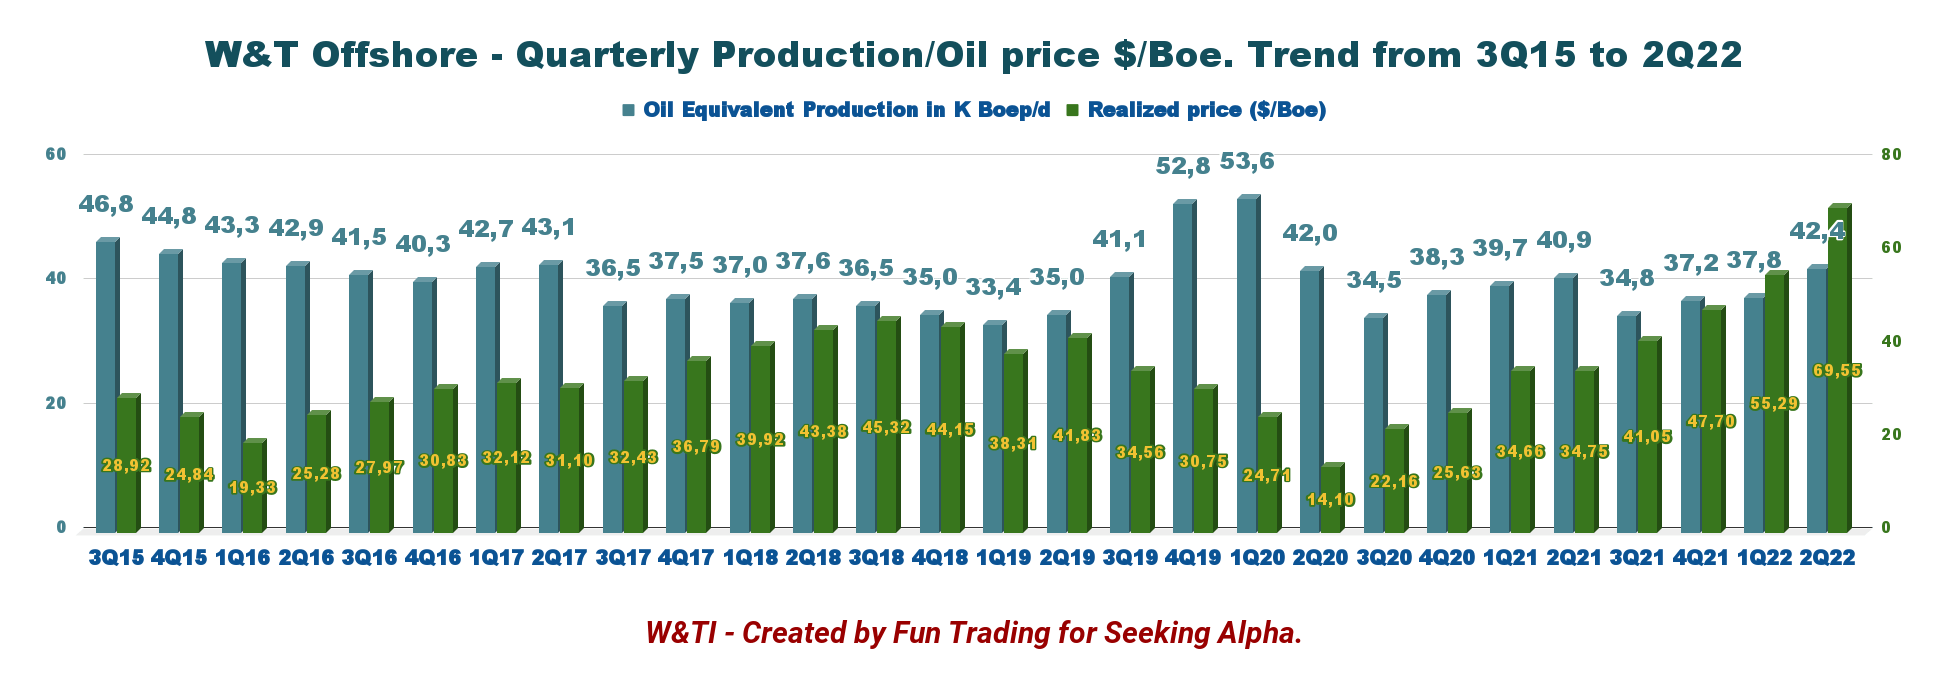
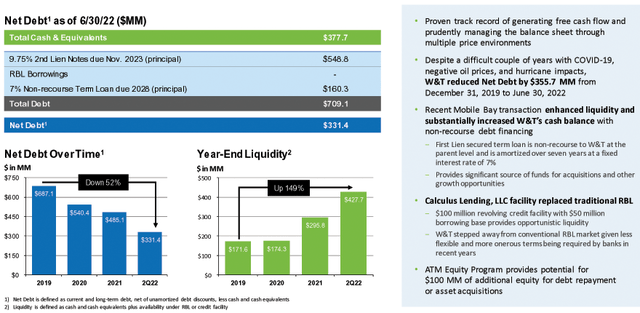
4 – Net debt is significantly down this quarter and is estimated at $331.5 million in 2Q22
WTI Quarterly Cash versus Debt history (Fun Trading) WTI Net Debt Presentation (W&T Offshore)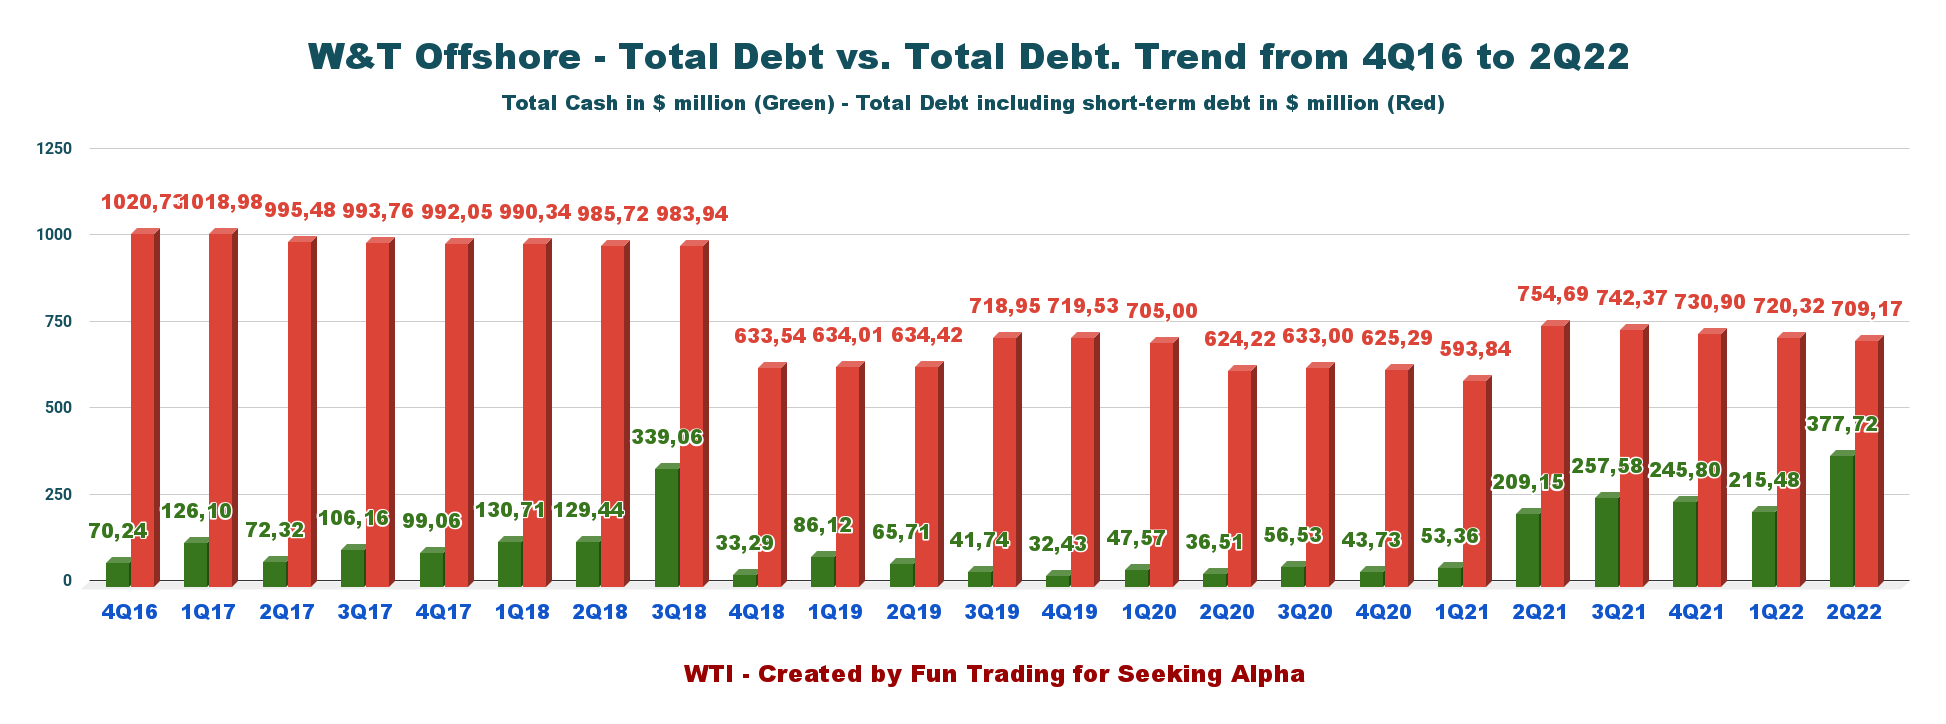
5 – Mid-year 2021 Proved Reserves, 2022 guidance, and acquisition
5.1 – Total 2021 Proved, Probable and Possible reserves (3P) jumped to 341.5 MMBoe with 47.3% liquids.
The Company’s year-end 2021 SEC proved reserves were 157.6 MMBoe (excluding ARO), up 9% from 144.4 MMBoe at year-end 2020. However, the company increased the 1P reserve to 168.3 MMBoe mid-year or 2P to 250.1 MMBoe.
WTI Reserve (W&T Offshore)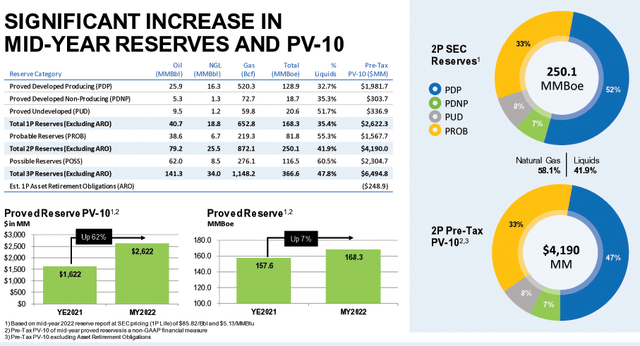
5.2 – 2022 guidance increased by 2%
Production for 2022 is expected to be 39.5k tp 42k Boep/d from 38.2k-42.2k Boep/d, reflecting the continued strength of the production base and the benefit of the acquisitions the company closed so far this year.
W&T Offshore reiterated its CapEx for 2022 at $70-$90 million, excluding acquisition opportunities.
Third quarter lease operating expense is expected to be between $55 million and $62 million, while cash G&A costs are expected to be between $15 million and $17 million.
Technical Analysis and Commentary
WTI TA Chart short-term (Fun Trading StockCharts)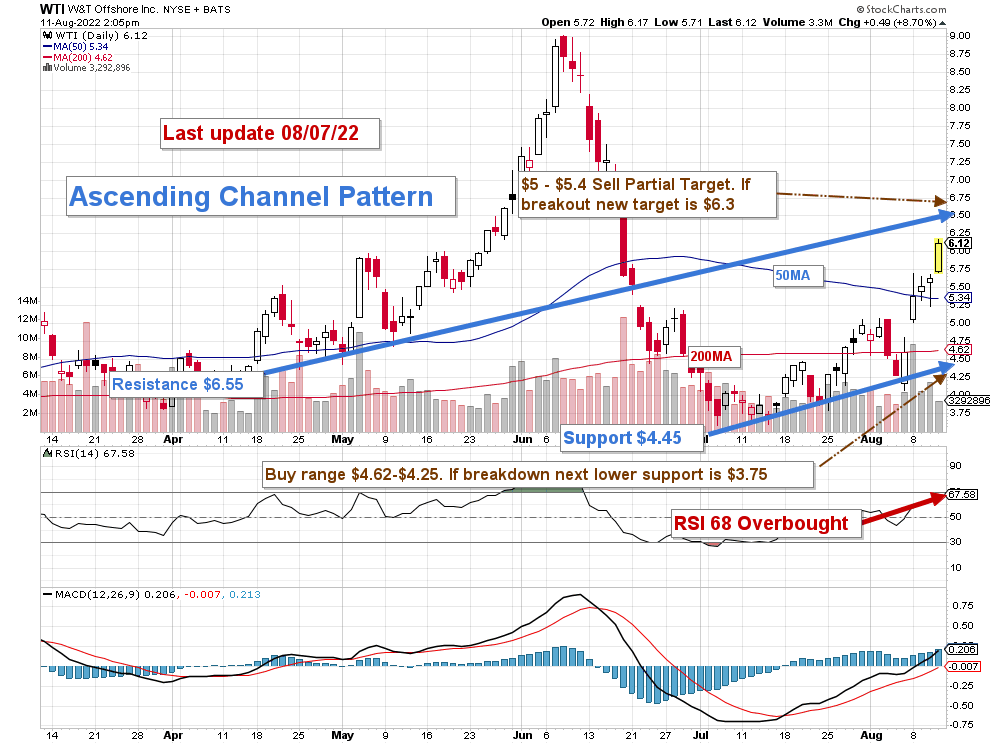
WTI forms an ascending channel pattern with resistance at $6.55 and support at $4.45.
The short-term trading strategy is to trade LIFO (read the note below) about 55%-65% of your position and keep your core long-term amount for a potential higher payday.
I suggest selling between $6.55 and $6.75 and waiting for a retracement between $4.62 and $4.25. RSI starts to be a little overbought at 68.
Since June, oil prices have retraced significantly, and West Texas is now below $95. We may see the oil prices going further down, potentially below $90 in 2022, assuming Iran is allowed to sell its oil again, and the world economy shrinks. Thus, if oil prices turn bearish, WTI could quickly drop to the lower support I see below $5 and may even test lower support at $3.75, depending on the severity of the oil pullback.
Watch oil prices like a hawk.
Note: The LIFO method is prohibited under International Financial Reporting Standards (IFRS), though it is permitted in the United States by Generally Accepted Accounting Principles (GAAP). Therefore, only US traders can apply this method. Those who cannot trade LIFO can use an alternative by setting two different accounts for the same stock, one for the long term and one for short-term trading.
Warning: The TA chart must be updated frequently to be relevant. It is what I am doing in my stock tracker. The chart above has a possible validity of about a week. Remember, the TA chart is a tool only to help you adopt the right strategy. It is not a way to foresee the future. No one and nothing can.
Author’s note: If you find value in this article and would like to encourage such continued efforts, please click the “Like” button below as a vote of support. Thanks.
Be the first to comment