

hapabapa/iStock Editorial via Getty Images
Though not the largest player in its space, Albertsons Companies (NYSE:ACI) is still a significant operator in the food and drug retail space in the US. In recent years, management has done well to grow the company’s top and bottom lines. This statement is true even when considering the significant economic pain caused by the COVID-19 pandemic. Today, shares of the company look to be trading at fundamentally attractive levels. This is true not only on an absolute basis but also relative to other players in the market. Because of this, investors would be wise to consider this an attractive opportunity for the long haul. What’s more, the company just recently, on April 12th of this year, revealed additional data rounding out its 2021 fiscal year that shows the aforementioned strong results for the operator continues.
Albertsons – A major play on food retail
These days, Albertsons Companies operates is one of the largest food and drug retailers in the US. As of the end of its 2021 fiscal year, the company operated 2,276 retail locations across 34 states and Washington DC. It does this through 24 different brand names. Examples include Albertsons, Safeway, Acme, Market Street, Jewel-Osco, and more. In these retail locations, the company boasts 1,722 pharmacies, 402 associated fuel centers, 22 dedicated distribution centers, and 20 manufacturing facilities. Its greatest exposure is to the state of California where it has 593 stores located. This is followed up by the 217 it has in Washington and the 209 it has in Texas. Generally speaking, the company’s locations are large in nature, with 55.6% of its stores totaling more than 50,000 square feet in size. This compares to 34.7% of stores that are between 30,000 and 50,000 square feet, and 9.7% that are less than 30,000 square feet.
Although management has provided some data covering the entirety of the 2021 fiscal year, it has not provided comprehensive data for the year. That should come in the next few days. However, that should not stop us from discussing, roughly, how much of the company’s revenue comes from different activities. Using 2020 results in lieu of 2021 figures, for instance, we can say that the company generated about 46.1% of its revenue from the sale of non-perishable products. Examples here include general merchandise, grocery products, and frozen foods. Perishable products like produce, dairy, meat, deli products, floral products, and seafood accounted for 41.9% of sales. The company generated 7.4% of its revenue from pharmacy products and 3.2% of revenue came from the sale of fuel. That leaves 1.4% of revenue coming from other product offerings such as its wholesale revenue to third parties, commissions, and other miscellaneous sources of sales. It’s also worth mentioning that the company sells some of its own brands. In fact, it currently owns over 13,000 products under its Own Brands portfolio that, in 2020, accounted for 21.2% of the firm’s overall sales.
Another great year for ACI
Author – SEC EDGAR Data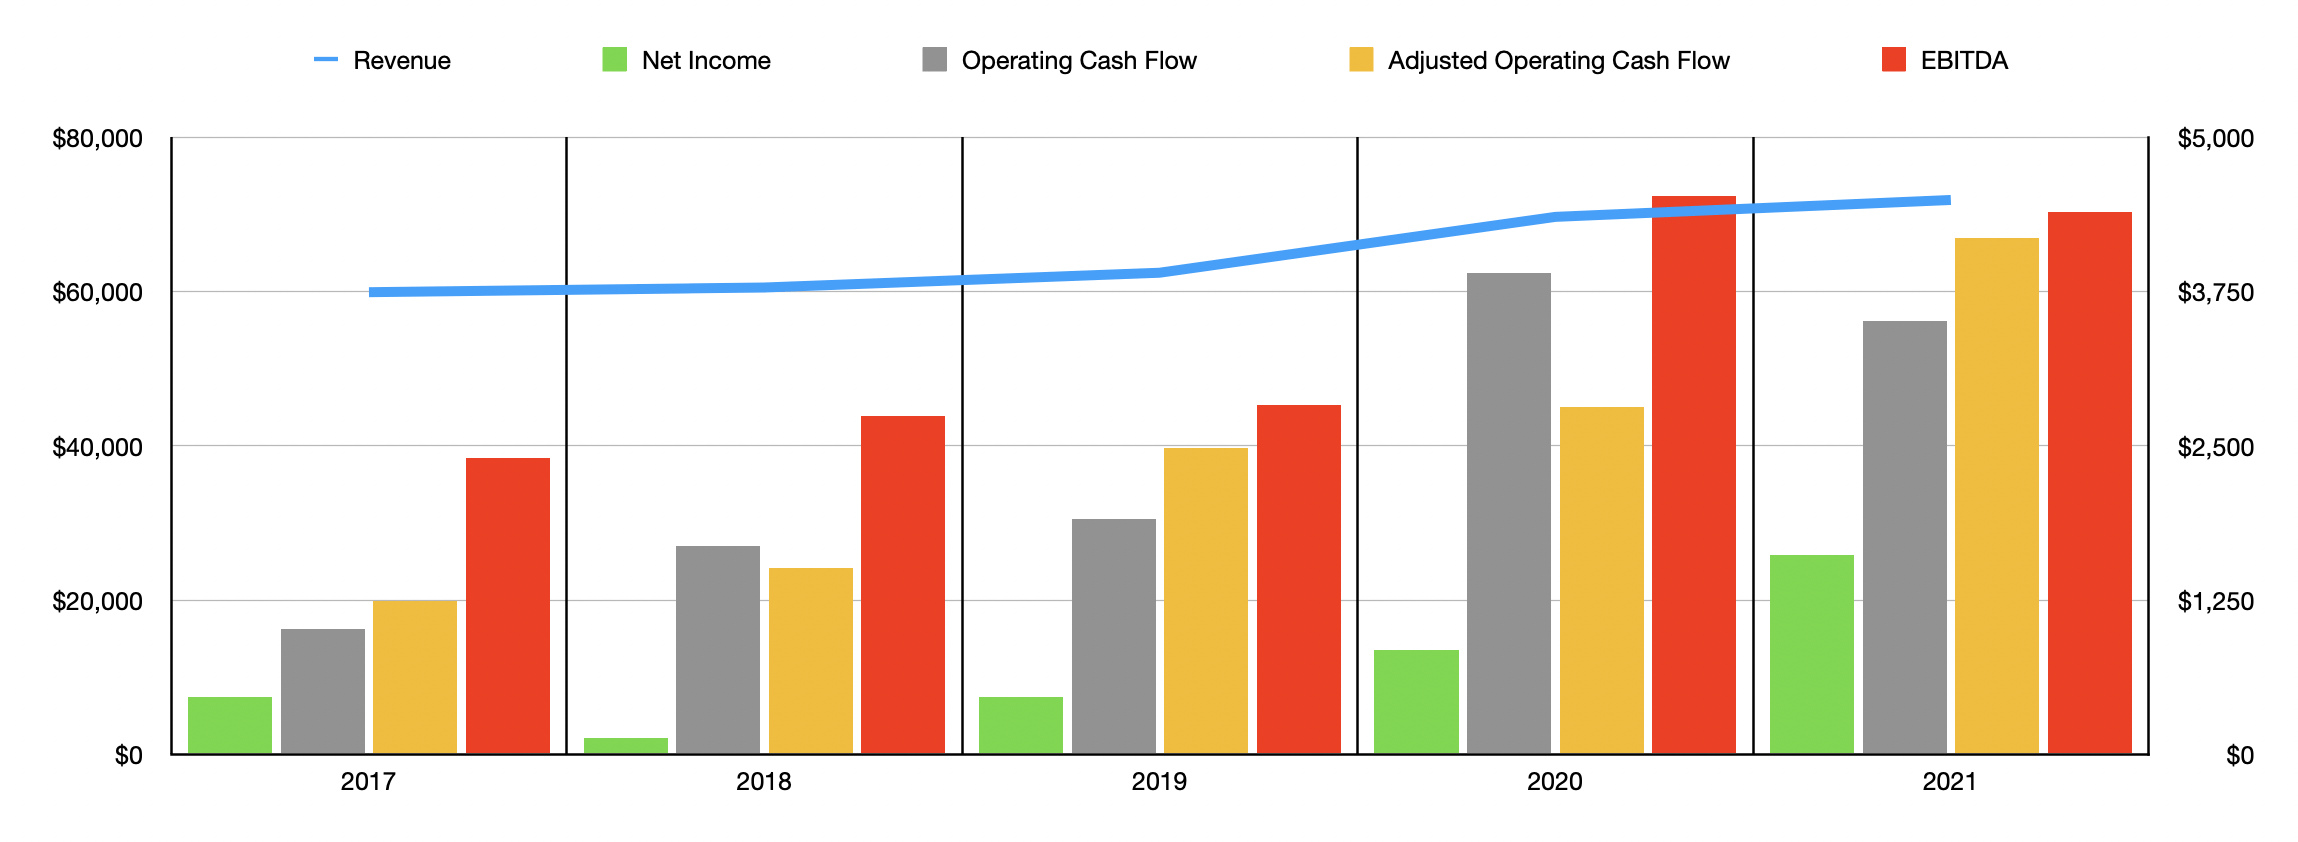
Over the past few years, management has done really well to grow the company’s top and bottom lines. As an example, we need only look at revenue from 2017 through 2020. During this time frame, revenue with the business expanded from $59.93 billion to $69.69 billion. Some of this sales growth came despite the fact that the number of stores the company operates decreased, falling from 2,318 stores to 2,277. A big driver of its revenue growth has been what management calls identical sales. These include stores operating during the same timeframe as the prior year. Direct to consumer digital sales are included in this, while fuel sales are excluded. A big driver for the company recently has been identical sales, with this number rising from 2019 to 2020 by 16.9%. Unfortunately, other product categories, such as fuel sales and store count changes, resulted in a revenue decline year over year.
Author – SEC EDGAR Data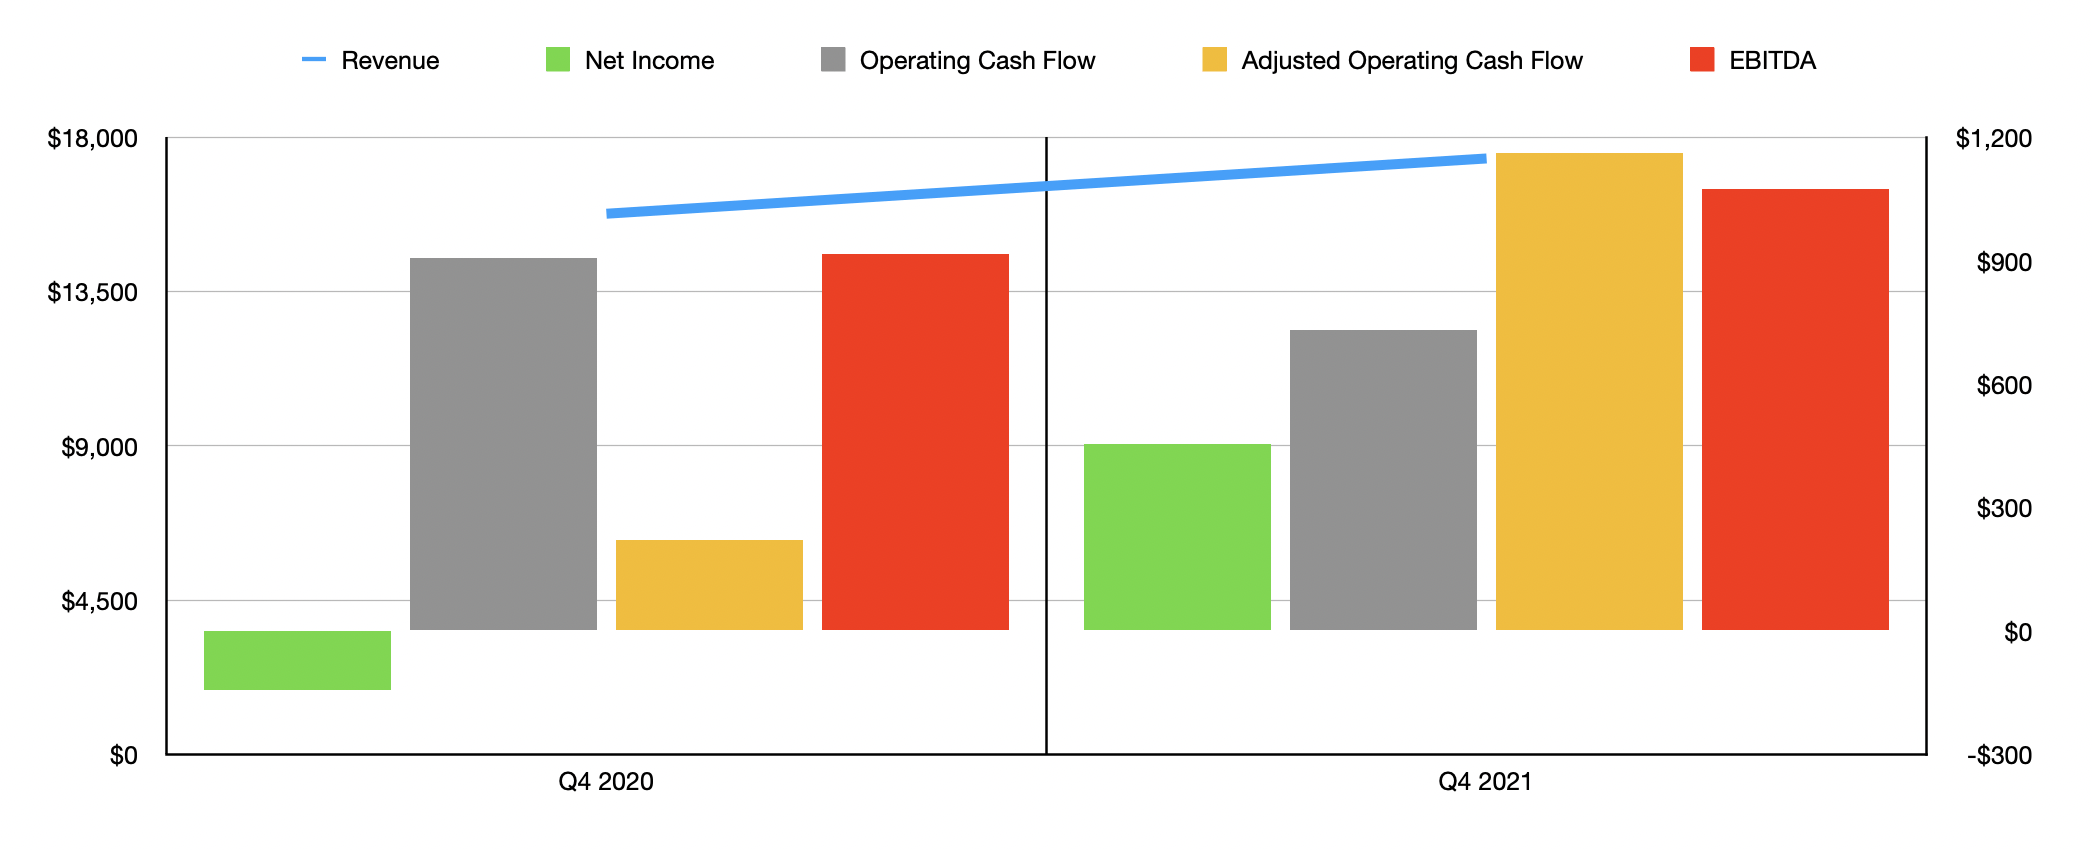
The good news for investors is that growth continued into the 2021 fiscal year. During the final quarter of the year, for instance, sales came in at $17.38 billion, beating analysts’ expectations by $530 million. That represented an increase of 10.2% over the $15.77 billion generated the same time one year earlier. The company said that it benefited from a 7.5% increase in identical sales, as well as from higher fuel sales. Interestingly, retail price inflation actually contributed to its revenue growth. As a result of this strong quarter, sales for the company’s 2021 fiscal year came in at $71.89 billion. That represents a year-over-year increase of 3.2%. Interestingly, results achieved in the final quarter of the year accounted for 73.4% of the firm’s overall revenue growth for 2021. So at the end of the day, it really was the final quarter that had a big impact on the company’s top line. Moving forward, management does have some positive expectations for the company, with identical sales expected to rise right between 2% and 3% in 2022.
As revenue has risen in recent years, so too has profitability. Between 2017 and 2020, net income for the company expanded from $463 million to $850.2 million. Profits then surged to $1.62 billion in 2021. Management attributed a big portion of this improvement to a strong final quarter, with net profits in the final three months of its 2021 fiscal year totaling $455.1 million. That compares to the $144.2 million loss achieved one year earlier. Gross margin for the company increased year over year, driven in large part by productivity initiatives and improved pharmacy margins. And the company also saw selling and administrative costs drop, as a percentage of sales, in the final quarter year over year due in part to sales leverage and productivity initiatives, but offset some by higher employee costs, as well as investments made by the company in its digital and omnichannel capabilities and strategic priorities. despite seeing a strong outcome for its 2021 fiscal year, management did announce, in late February of this year, plans to look at strategic alternatives aimed at enhancing the company’s growth and shareholder value. But until management provides further details, we have no idea what might transpire here.
As net profits for the company improved, the same thing happened with other profitability metrics. Operating cash flow, for instance, rose from $1.02 billion in 2017 to $3.90 billion in 2020. This figure did drop to $3.51 billion in 2021. But if we adjust for changes in working capital, operating cash flow hit a high point of $4.19 billion last year. That compares to the $2.82 billion reported for 2020 and is up from the $1.24 billion the company achieved in 2017. Meanwhile, EBITDA for the business closely mirrored operating cash flow, rising from $2.40 billion in 2017 to $4.52 billion in 2020 before dropping to $4.40 billion last year. When it comes to the company’s 2022 fiscal year, management does expect a little bit of pain. The expectation is currently for EBITDA as between $4.15 billion and $4.25 billion. Meanwhile, if we take the midpoint guidance for earnings per share, the company should generate net profits of $1.59 billion. Management did not provide any guidance when it came to operating cash flow. But if we assume that it would decline at the same rate that net profits should, then operating cash flow, on an adjusted basis, should be about $4.03 billion in 2021.
Author – SEC EDGAR Data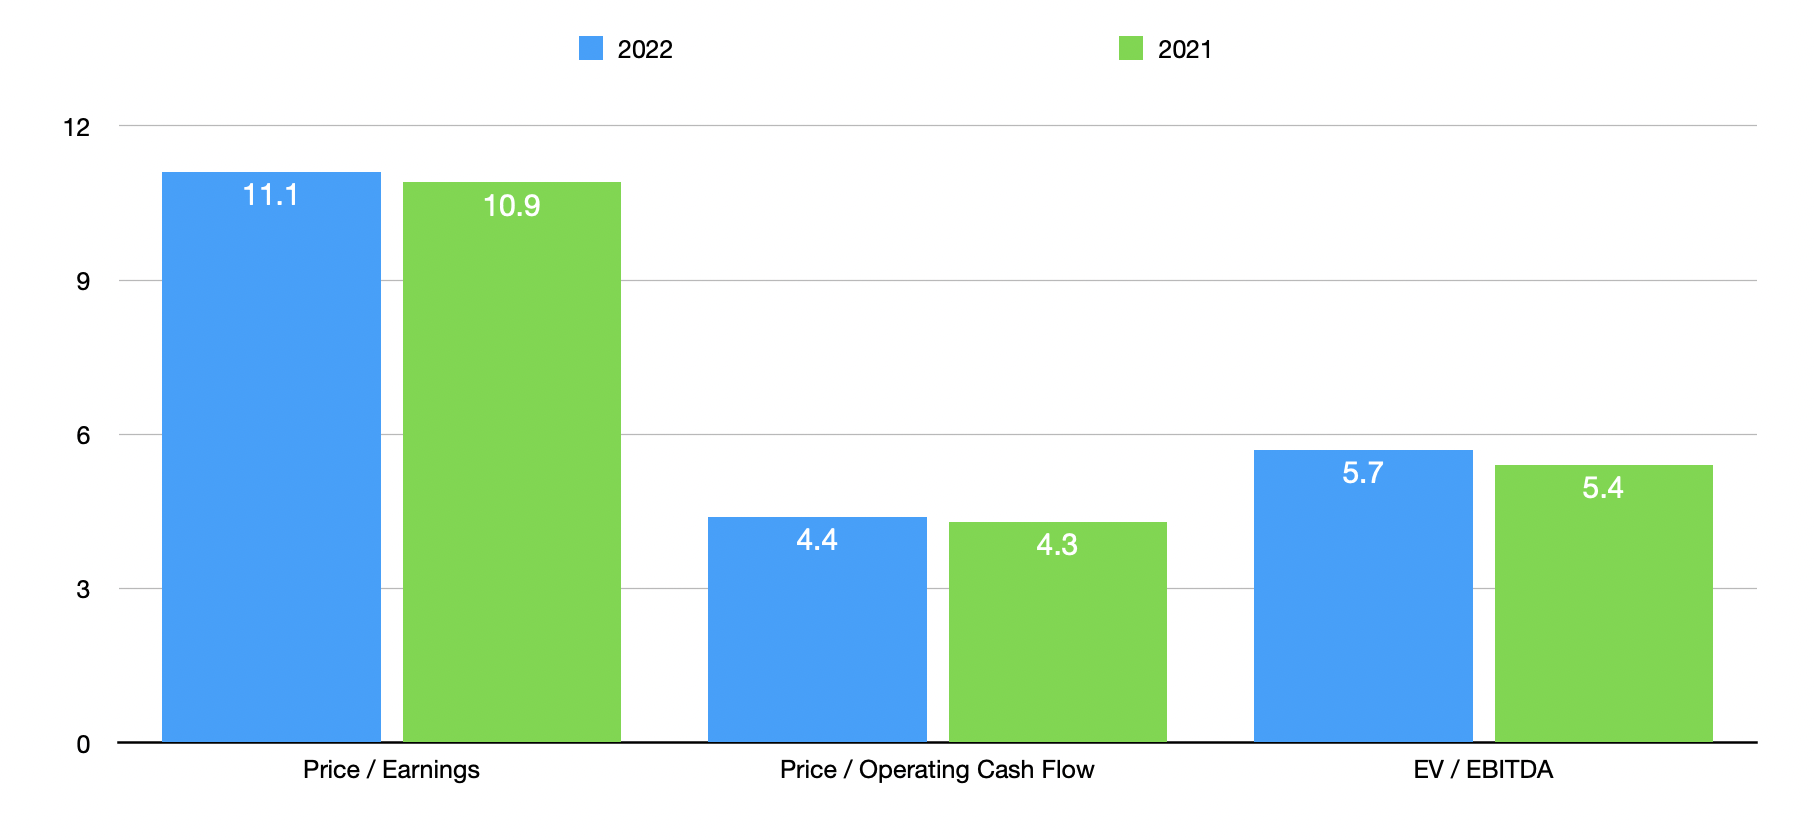
Taking these estimates, as well as the company’s historical financial figures, we can effectively value the business. On a price-to-earnings basis, our 2022 estimates provided by management should result in a trading multiple for the firm of 11.1. This compares to the 10.9 reading that we get using 2021 figures. The price to adjusted operating cash flow multiple should be 4.4, which is up only slightly from the 4.3 figure we get if we rely on 2021 data. And the EV to EBITDA multiple for the company should be 5.7. This stacks up against the 5.4 we get if we rely on 2021 results. Considering that the company’s net leverage ratio is not all that bad, coming in at 1.21 if we rely on 2022 estimates and totaling 1.15 if we rely on 2021 results, these are fairly low prices that shares are trading for.
To put the pricing of the company into perspective, I did decide to compare it to five similar players in the space. On a price to operating cash flow basis, these companies ranged from a low of 7.1 to a high of 21.7. Meanwhile, on an EV to EBITDA basis, the ranges from 5.8 to 23.1. In both of these cases, Albertsons Companies was the cheapest of the group. If, instead, we were to look at the companies through the lens of the price to earnings multiple, the range we would get would be from 4.1 to 54.5. In this case, only one of the five companies was cheaper than our prospect.
| Company | Price / Earnings | Price / Operating Cash Flow | EV / EBITDA |
| Albertsons Companies | 10.9 | 4.3 | 5.4 |
| The Kroger Co. (KR) | 27.0 | 7.1 | 8.7 |
| Sprouts Farmers Market (SFM) | 15.5 | 10.4 | 6.6 |
| Casey’s General Stores (CASY) | 23.9 | 11.4 | 12.1 |
| Grocery Outlet Holding Corp. (GO) | 54.5 | 20.6 | 23.1 |
| Tesco (OTCQX:TSCDY) | 4.1 | 21.7 | 5.8 |
Takeaway
All things considered, Albertsons Companies strikes me as a fundamentally attractive prospect in the food and drug retail markets. The business is trading at fundamentally low levels no matter how you look at it. It’s cheap on both a relative basis and on an absolute basis. On top of that, management has demonstrated a robust track record of growing revenue and profits. Although I generally don’t care too much for players in the retail space, all of these factors combined make me rather bullish on the company at this point in time.
Be the first to comment