

Design Cells
The Chart of the Day belongs to Alaunos Therapeutics (TCRT). I found the stock by sorting Barchart’s Bullish Moving Average watchlist by the most frequent highs in the last month then used the Flipchart feature to review the charts for consistent price appreciation.
This watchlist helps you find today’s best stocks with bullish short, medium, and long-term moving average patterns. These large-cap stocks (greater than 300M) have a 20-day moving average greater than the 50-day moving average, and a 50-day moving average greater than the 100-day moving average. When price is above a moving average, it signals an uptrend. In addition, these stocks have a TrendSpotter “Buy” signal, are within 20% of their 52-week high, and have a 20-day average volume greater than 25,000. These additional filters were added to showcase the best bullish moving average stocks.
TIP: Using FlipCharts, apply your own chart template with a 20, 50, and 100-day moving average to further analyze this group of stocks.
Since the Trend Spotter signaled a buy in 8/3, the stock gained 118.71%.
TCRT vs. Daily Moving Averages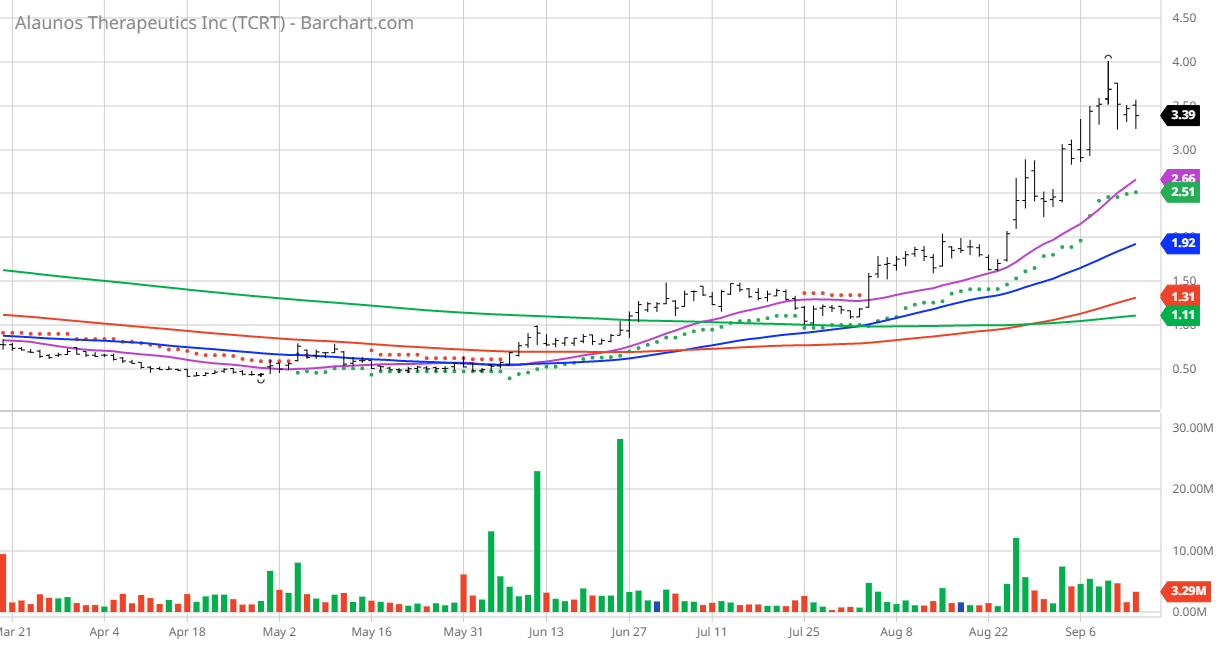
Alaunos Therapeutics, Inc., a clinical-stage oncology-focused cell therapy company, develops adoptive TCR engineered T-cell therapies. It develops TCR Library, which is in Phase I/II clinical trial for ten TCRs reactive to mutated KRAS, TP53, and EGFR from its TCR library for the treatment of non-small cell lung, colorectal, endometrial, pancreatic, ovarian, and bile duct cancers; hunTR, a human neoantigen T-cell receptor platform; and mbIL-15 to treat solid tumors. Alaunos Therapeutics, Inc. has a license agreement with PGEN Therapeutics, Inc.; research and development agreement with The University of Texas MD Anderson Cancer Center; and a patent license agreement, and research and development agreement with the National Cancer Institute. The company was formerly known as ZIOPHARM Oncology, Inc. and changed its name to Alaunos Therapeutics, Inc. in January 2022. Alaunos Therapeutics, Inc. is headquartered in Houston, Texas.
Barchart’s Opinion Trading systems are listed below. Please note that the Barchart Opinion indicators are updated live during the session every 20 minutes and can therefore change during the day as the market fluctuates. The indicator numbers shown below therefore may not match what you see live on the Barchart.com website when you read this report.
Barchart Technical Indicators:
- 100% technical buy signals but increasing
- 7.70- Weighted Alpha
- 107.98% gain in the last year
- Trend Spotter buy signal
- Above its 20-, 50- and 100- day moving averages
- 10 new highs and up 105.45% in the last month
- Relative Strength Index 69.80%
- Technical support level at 3.36
- Recently traded at $3.39 with 50-day moving average of $1.92
Fundamental factors:
- Market Cap $750 million
- On this stock I will not be sharing analysts’ revenue and earnings projections because they are all over the spectrum as is their price targets I share below
Analysts and Investor Sentiment — I don’t buy stocks because everyone else is buying but I do realize that if major firms and investors are dumping a stock it’s hard to make money swimming against the tide:
- Wall Street analysts have 3 strong buy, 1 buy and 2 hold opinions on the stock
- Analysts price targets from 2.00 – 7.50 with an average of 4.20
- The individual investors following stocks on Motley Fool have not discovered this stock yet
- 16,040 investors are monitoring the stock on Seeking Alpha
Ratings Summary
Factor Grades
Quant Ranking
Sector
Industry
Ranked Overall
Ranked in Sector
Ranked in Industry
Be the first to comment