

Darren415
This article was first released to Systematic Income subscribers and free trials on Aug. 23.
In this article, we provide an update on the PIMCO CEF suite. Specifically, we discuss the changes in leverage and coverage for the month of July. We continue to favor the PIMCO Access Income Fund (PAXS) in the taxable suite given its very high coverage level and attractive valuation. We expect the fund to declare a special dividend this year as well as raise its base dividend in the medium term.
Leverage Update
PIMCO taxable CEF borrowings continued to slide, falling for the 4th month in a row. Somewhat unusually, all funds, except for the special case PAXS, cut their borrowings.
Systematic Income CEF Tool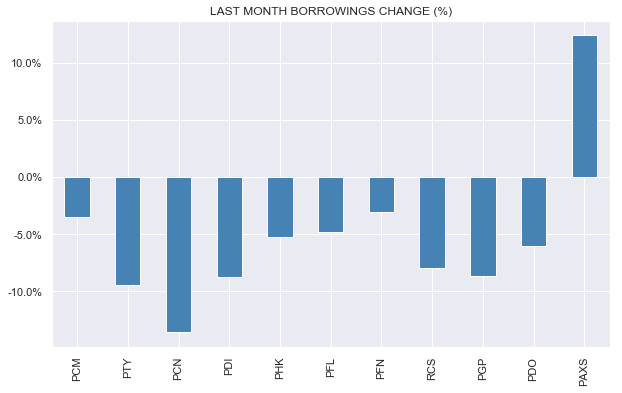
PAXS remains a special case because it is still building up its leverage as it adds assets since its recent IPO.
Systematic Income CEF Tool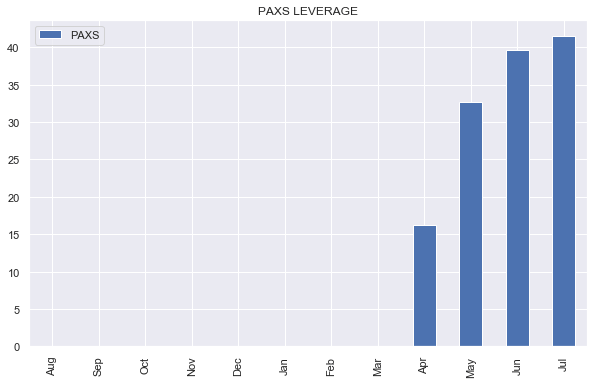
Since borrowings peaked in Q1, the PIMCO taxable funds cut 7-33% of their borrowings. There is not a ton of rhyme-or-reason in the level of cuts. For example, while a higher-leveraged fund like PTY or a high-beta fund with a significant equity holding like PGP would have been expected to significantly cut its borrowings, lower-leverage funds like PFL and RCS also cut a significant amount.
Systematic Income CEF Tool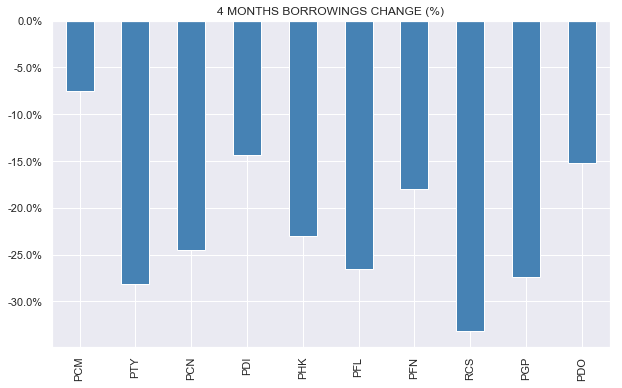
PCM is now, very unusually, the highest leveraged taxable CEF in the suite. PTY, which used to be in the lead, has cut back on its borrowings sharply.
Systematic Income CEF Tool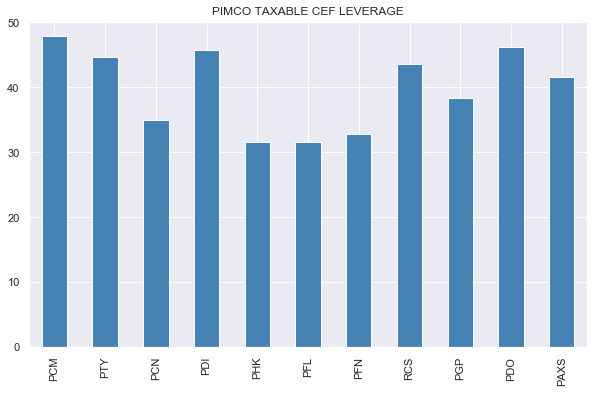
What’s interesting is that PIMCO didn’t need to further deleverage the taxable funds in July because NAVs rose which provided a small organic deleveraging by itself. In other words, PIMCO decided to take down the leverage levels of their funds as a purely discretionary step rather than one that was required by fund mandates. Perhaps they are taking a more bearish view on the current market. So far, this seems to be playing out.
Although the action in taxable funds is always interesting, it’s the Muni funds that caught our attention in July. Recall that in our last update we were left scratching our heads why the Muni fund borrowings were so resilient despite the fact that fund leverage levels rose above 50%, in contradiction of their actual leverage mandates. Our expectation over the last couple of months was that the funds would have deleveraged already. Well, better late than never.
July was a big deleveraging month for the Muni funds with an average cut in borrowings of around 15%.
Systematic Income CEF Tool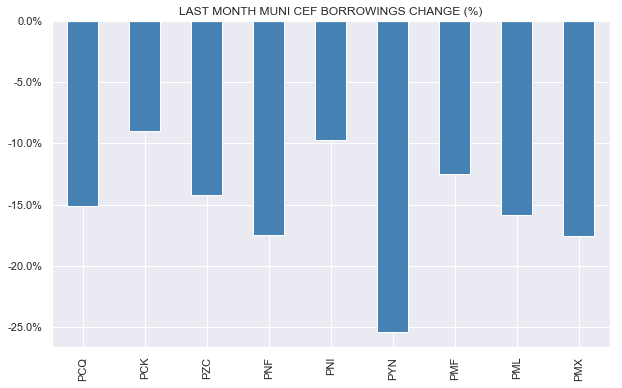
The average leverage level of the suite was cut back to around 44% from a nearly sky-high 50% level.
Systematic Income CEF Tool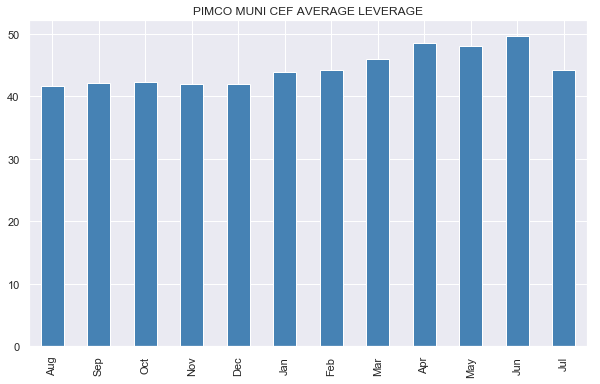
Despite such a large cut-back PIMCO Muni CEFs remain some of the highest-leveraged CEFs in the market.
Systematic Income CEF Tool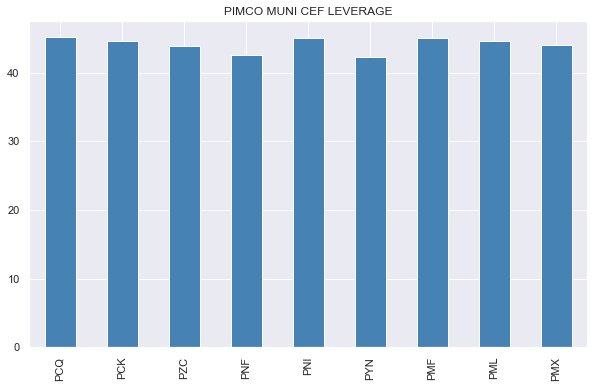
Muni CEF investors may recall that PIMCO Muni funds have a history of deleveraging during difficult drawdowns. The reason this tends to happen more often and with greater impact to them is for the simple reason that they run at a much higher level of leverage which affords them much less room for error when things go awry.
CEF managers have a delicate choice when they target the level of leverage at which to run a given fund. Higher leverage drives more net income but also exposes the fund to permanent economic loss in case of deleveraging which can require the fund to sell assets at low prices only to buy them back higher. At the outset we cannot say at what level of leverage total NAV returns will be maximized. A too-low level of leverage can be as damaging to total returns as a too high level of leverage.
A PIMCO fund like PML pursues a higher-leveraged strategy in the Muni CEF sector. This strategy has a clear reward – a higher level of net income. At the same time this strategy carries additional risk – a forced deleveraging which will cause the fund to sell low and buy back higher. It can be useful to compare the performance of a fund like PML to one like NAD which has a broadly similar allocation but tends to run at a lower level of leverage. To gain some intuition about a management style of a fund like PML versus one like NAD we need to compare total NAV returns over different periods.
This year PML has underperformed NAD due to the drop in Municipal bond prices and its higher level of leverage.
Systematic Income CEF Tool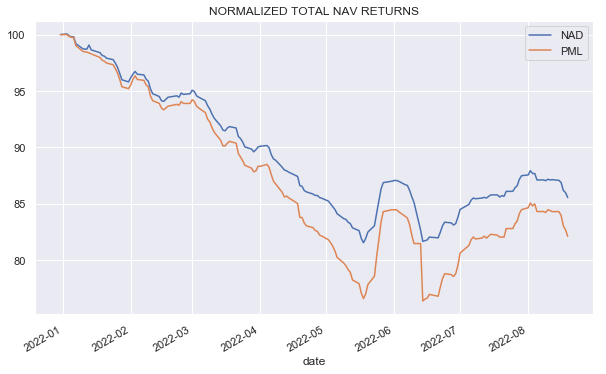
Starting from the COVID shock and through 2021 PML underperformed NAD despite the fact that Municipal bond prices had fully recovered due to its deleveraging over the COVID shock.
Systematic Income CEF Tool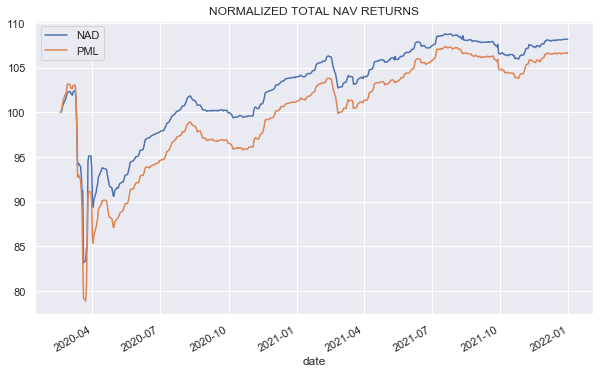
Over the last 10 years, PML has a slight advantage over NAD as the additional carry over the fairly benign decade of 2010 – 2019 allowed it to outperform strongly. The recent drop in Muni prices has narrowed its outperformance but has not fully eroded it.
Systematic Income CEF Tool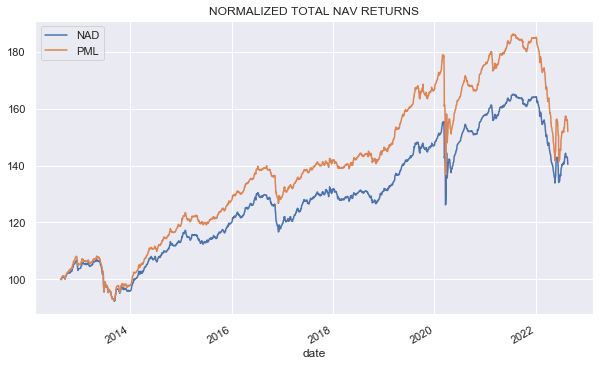
Over the longest possible period for which we have data (starting from the pre-GFC period), PML has underperformed due to its horrific underperformance over the GFC which created a huge gap between it and NAD from which it has not yet climbed out of. The kind of deleveraging the fund saw during the GFC is a good example of how much timing luck has to do with returns of a higher-leveraged fund – everything depends on the kind of environment the fund goes through.
Systematic Income CEF Tool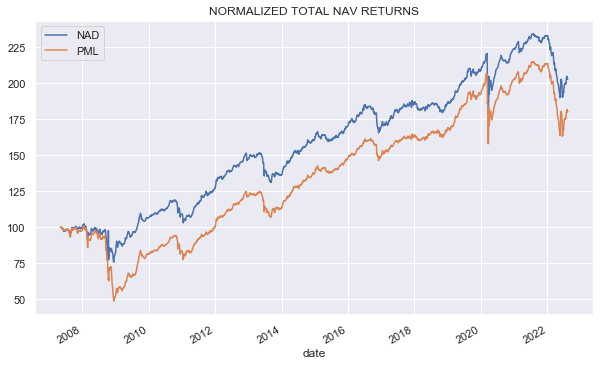
What this comparison shows is that there is no single best answer as to the right strategy to pursue for Muni CEF investors – whether to allocate to a higher-leveraged fund like PML (with its additional risk of deleveraging) or a lower-leverage fund like NAD. Which fund outperforms over the longer-term depends entirely upon the kind of environment we see. A relatively placid environment like the one we saw over 2010-2019 should allow PML to outperform strongly. However, just a single horrific shock will likely leave PML far in the dust. The question for investors as it was in Dirty Harry is “Do I feel lucky?”.
Coverage Update
Taxable coverage was mixed in July. PTY had the biggest drop of 7% while PGP enjoyed a ridiculous gain of 28%.
Systematic Income CEF Tool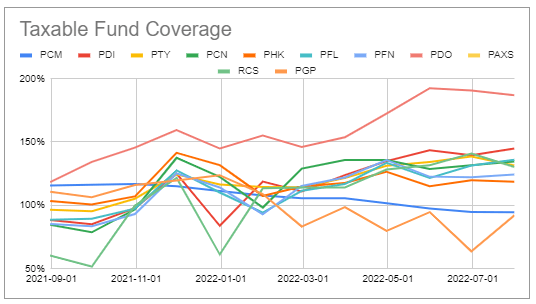
For those keeping score at home, the following extract from our CEF Tool provides the last two monthly 6-month rolling coverage figures.
Systematic Income CEF Tool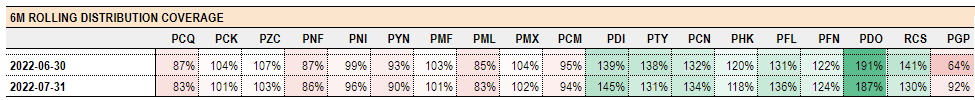
The average taxable coverage figure (red line) rose strongly over July, however, this was entirely due to the weird coverage spike by PGP. Excluding PGP, average coverage would have fallen slightly.
We are keeping an eye on PAXS coverage which has not yet released a 6-month rolling number. Its 3-month rolling number is 171% which is only second to PDO which is at 179%. We expect PAXS coverage to rise above that of PDO given its lower NAV distribution rate as well as a level of leverage which should rise further to match that of PDO.
Systematic Income CEF Tool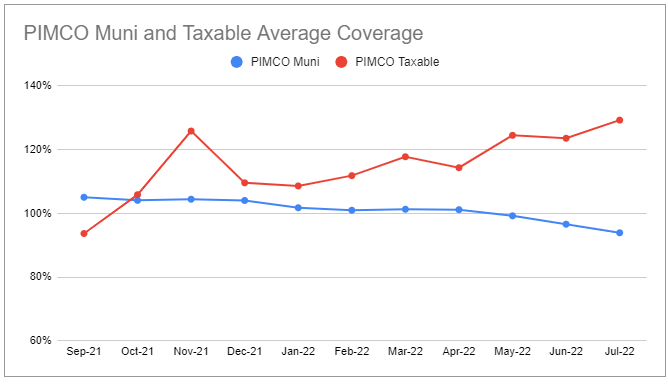
The two biggest drivers of “core” income (i.e. excluding the impact of swaps) of the taxable suite has been the rise in short-term rates as well as the ongoing deleveraging in the suite. Outside of interest rate swaps, taxable CEF net income sensitivity to short-term rates should be fairly flat as we discussed in our last PIMCO update. The deleveraging, however, will be a headwind on income. That said, given the volatility in fund earnings and coverage monthly figures it may take some time to work out a trend.
The trend in the Muni suite, however, is very clear. There, the rise in short-term rates has been a significant headwind for net income, just as it has been for the rest of the Muni suite. The recent deleveraging will likely accelerate the drop in coverage.
Systematic Income CEF Tool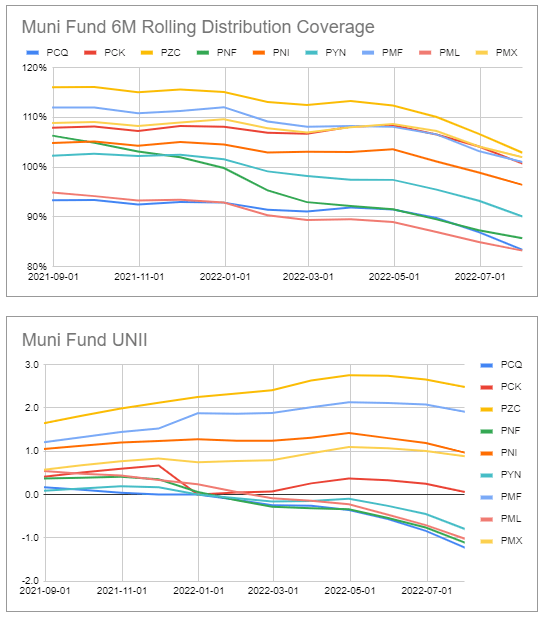
Takeaways
We continue to favor PAXS in the taxable suite. As we discussed in the previous PIMCO update the fair-value discount differential between PDO and PAXS is about 2%. PAXS is currently trading at a 4% wider discount. The fund should see a special dividend this year as well as a distribution hike in the medium term – in essence following in the footsteps of PDO. And much like the outperformance of PDO following its own recent distribution hike we also expect PAXS valuation to outperform relative to the taxable suite in this event. We continue to hold PAXS in our High Income Portfolio.
Be the first to comment