

Lemon_tm/iStock via Getty Images
(This article was co-produced with Hoya Capital Real Estate)
Introduction
Even with the Federal Reserve Bank indicating multiple 25-50bps bumps, others are betting that won’t be enough to tame inflation unless supply chain issues are solved and the war in Ukraine ends sooner than current expectations. One asset class receiving attention amongst investors with income goals are Floating-Rate Closed-End-Funds. These funds should outperform CEFs holding Fixed-Rate assets. While writing about several choices in this market segment, I came across the Apollo Senior Floating Rate Fund (NYSE:AFT) during that time and noticed the potential gain possible if the Price/NAV discount returns to levels seen recently and over the past year. Investors considering floating-rate CEFs, yielding near 6.5%, with history of much better Price/NAV ratio, I would give AFT a Buy rating.
Exploring the Apollo Senior Floating Rate Fund
Seeking Alpha describes this CEF as:
The investment seeks to seek current income and preservation of capital. The fund normally invests at least 80% of assets in floating rate Senior Loans and investments with similar economic characteristics. Senior Loans typically pay interest at rates that are determined periodically on the basis of a floating base lending rate, primarily the London-Interbank Offered Rate, plus a premium. It is non-diversified. Benchmark: LIBOR USD. AFT started in 2011.
Source: seekingalpha.com AFT
The managers describe their CEF as:
Apollo Senior Floating Rate Fund Inc. (the “Fund”) is a diversified, closed-end management investment company. The Fund’s investment objective is to seek current income and preservation of capital by investing primarily in senior, secured loans made to companies whose debt is rated below investment grade and investments with similar economic characteristics. Senior loans typically hold a first lien priority and pay floating rates of interest.
Source: apollofunds.com AFT
AFT has $251m in assets, with a recent yield of 6.5%. Even for a CEF using leverage, the fees are extreme at 289bps, consisting of:
- Manager fee: 150bps
- Other Expenses: 86bps
- Interest cost related to leverage: 53bps
AFT had a 123% portfolio turnover rate in 2021, which explains what seems high for Other Expenses. As rates rise, so will the leveraging costs, recently listed at 34% of assets.
AFT Holdings review
Apollo lists this description to their investment approach:
Apollo uses its core industry expertise and strategic platform to identify investment opportunities and believes that it employs a conservative approach to credit selection that focuses on collateral coverage, structural seniority and credit fundamentals, with a particular emphasis on leading defensible market positions, stable companies with positive cash flow and proven management teams.
Source: apollofunds.com
apollofunds.com 2/28/22 Factsheet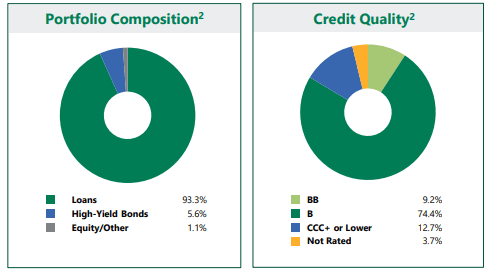
Based on the Issuer data provided, Loans were made direct with the borrower, not one’s banks resold. I calculated the portfolio’s weight rating to be between B and B-. Morningstar gave them a B- at the end of 2021, Apollo says B. AFT actually owns D-rates debt (1.2%). The next charts show the historical default rates by rating. Notice how far above the others is the CCC-rate debt.
spglobal.com/ratings apollofunds.com Factsheet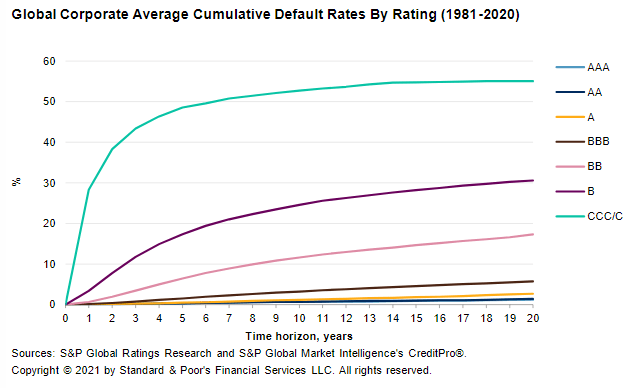
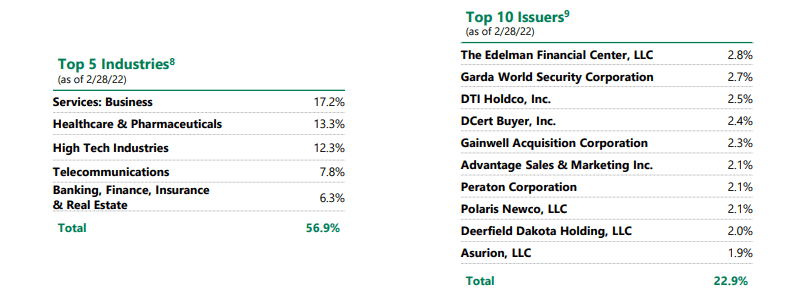
AFT data showed exposure to 15 different industries and 94 different Issuers. Multiple assets for an Issuer are limited as asset count is around 130. Other listed factors included:
- Weighted Average Floating-Rate Spread: 4.33%
- Weighted Average Fixed-Rate Coupon: 6.04%
- Weighted Average Maturity (in years) (floating assets):5.22
- Weighted Average Maturity (in years) (fixed assets): 6.25
- Weighted Average Modified Duration (in years) (fixed assets): 4.65
- Weighted Average Modified Duration (in years): 4.36
It was very disappointing that the most recent asset listing for AFT is from last year-end, and it wasn’t in an easy format to figure out the Top 10 holdings, but for those interested, here is a link to that data. Having recent Issuer data does reduce the need to see actual holdings as the risk is at the Issuer level.
AFT Distributions review
apollofunds.com AFT DVDs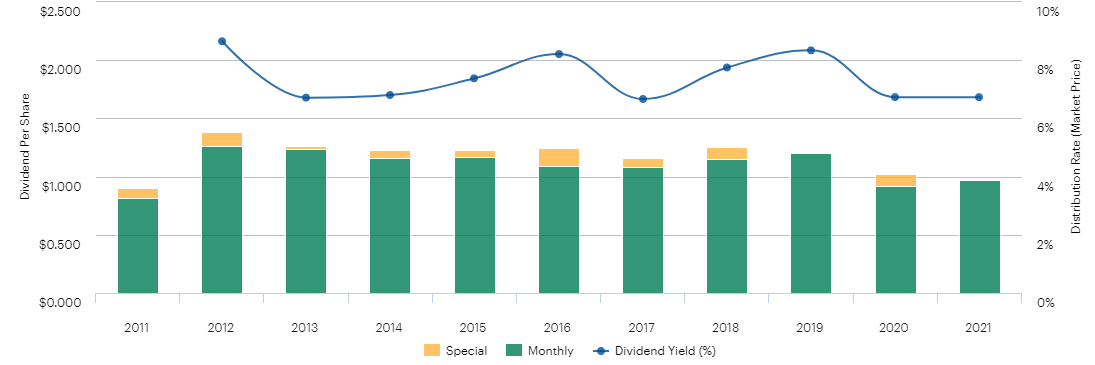
AFT cut their monthly payout from $.085 to $.08 in January and it remains there pending the April announcement. According to tax documents, about 7% of the 2021 payouts were classified as ROC. The make-up of the fund’s distribution can be incorrectly listed, as many sites don’t give an accurate breakdown. Always look for Form 8937 on the fund’s website.
While ATF hasn’t set its distributions as a percent of NAV, the Annual Report does explain the process (edited):
The Funds intend to make regular monthly cash distributions of all or a portion of their net investment income available to common shareholders. The Funds intend to pay common shareholders at least annually all or substantially all of their capital gains and net investment income after the payment to outstanding preferred shares and/or notes or other forms of leverage utilized. This distribution policy may have certain adverse consequences to the Funds and their shareholders because it may result in a return of capital to shareholders, which would reduce the Funds’ NAV and, over time, potentially increase the Funds’ expense ratios. The Board may elect to change AFT’s or AIF’s distribution policy at any time.
Source: apollofunds.com 12/31/21 Annual Report
AFT Price and NAV review
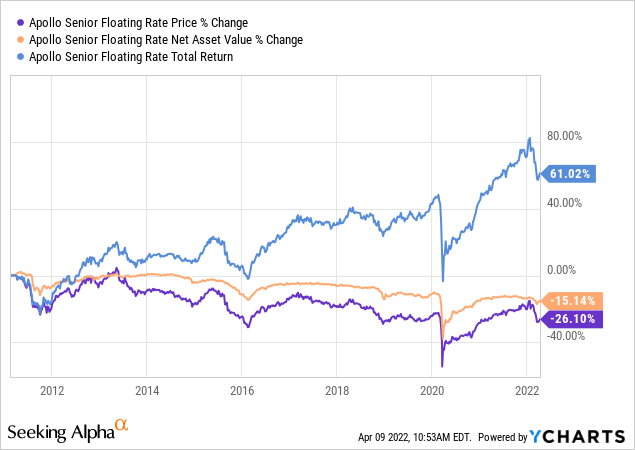
Since inception, AFT has seen its price drop 26% and its NAV by 15%. For investors who reinvested their payouts, AFT is up 61%. Not accounting for the beginning month and the current month, CAGR and risk data would be:
PortfolioVisualizer.com
While the 4.28% CAGR isn’t overly appealing, it is within the range of many other Floating-Rate CEFs I checked. A Sharpe ratio under .4 indicates they are not generating much CAGR for the risks they take or that are inherit to the asset class.
AFT as Discount play
Based on other factors, AFT seems to be your typical floating-rate CEF, nothing special other than its holdings count I believe is much less than most. Buying now and banking on the discount shrinking is the main reason AFT stands out.
CEFConnect.com AFT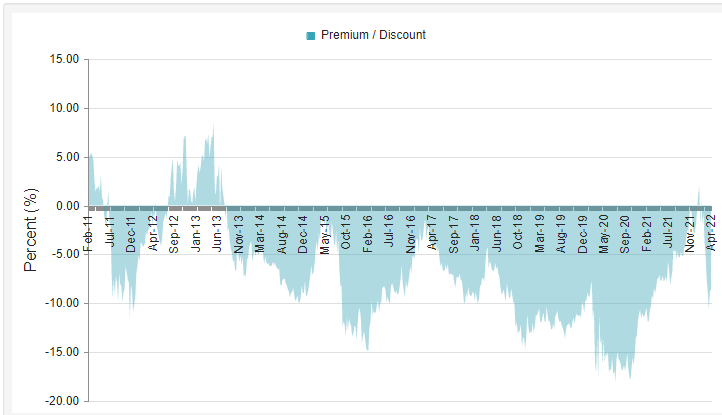
AFT shows a history of selling at a discount with post-Covid breaking the 15% barrier. But from there, it briefly went into Premium territory until the Ukraine invasion occurred.
CEFConnect.com AFT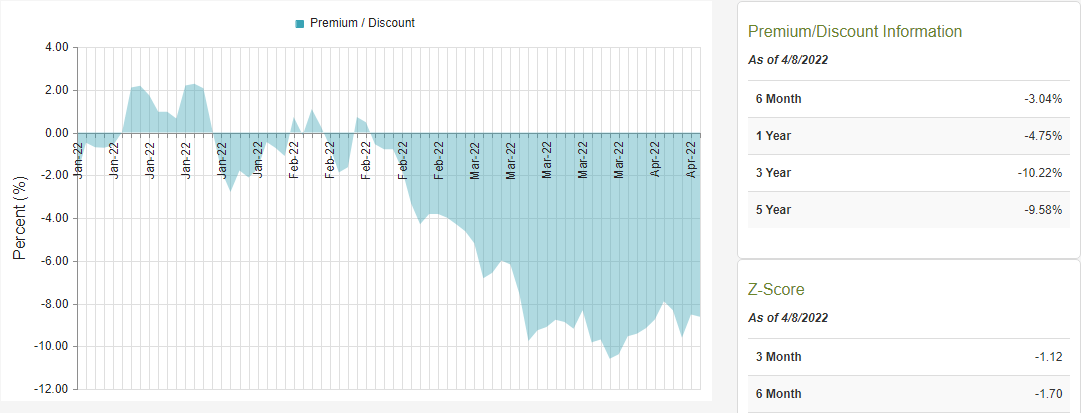
As of 4/8/22, AFT stood at an 8.62% discount, with Z-scores indicating that is not normal for the past 12-months, in a positive for new investors. Even if it takes another year to approach zero, that plus the current yield would provide investors with a CAGR over 14%.
Portfolio Strategy
2022 is going to be a very interesting year for investors. Just look at the list of some of the market effecting events we are facing:
- War in Ukraine: I recently read that the Eastern part of the country is resource rich in fossil fuels and minerals, which could lengthen the war.
- Federal Reserve Bank: We have seen one 25bps rate increase with some experts thinking another 150-200bps could occur before 2023.
- US economic outlook: Inflation is at 40-year highs and unemployment hitting historic lows. Add in supply chain issues caused by the latter, plus COVID effecting China, ability to repay the loans that funds like AFT hold becomes more uncertain.
The more investors fear the above, the less likely the NAV will rise to meet the price and more likely they will meet by the price dropping, not a favorable outcome for investors, even for a fund paying 6+%.
Final Thoughts
After reviewing AFT, I opened a position in this CEF as a potential play on the discount shrinking while collecting the 6+% yield. If investors are considering floating-rate CEFs, yielding near 6.5%, with history of much better Price/NAV ratio, I would give AFT a Buy rating.
For investors looking for another Discount play, the Blackstone/GSO Long-Short Credit Income Fund (BGX), which I recently reviewed, is another possibility. Being more Fixed-Rate oriented, it has greater risk any discount improvement could come from NAV decreases as it has more interest-rate risk.
When and how many rate hikes will affect Fixed-Income funds, even Floating-Rate ones. Another Seeking Alpha contributor, Bill Conerly, recently penned his view of that subject: 7 Fed Rate Hikes In 2022? Needed But Unlikely
Be the first to comment