

Cecilie_Arcurs/E+ via Getty Images
Introduction
Every year the Russell Indexes are rebalanced to bring in new stocks and remove underperforming stocks. The FTSE Russell calls this event the annual reconstitution process. It begins with evaluations and “rankings” in May and moves to the June-transition month. For 2022, beginning on June 3rd, the preliminary selection lists are communicated to the markets. Updates are provided following on June 10, 17, and 24th with the reconstituted indexes taking effect after the close on June 24 this year.
FTSE Russell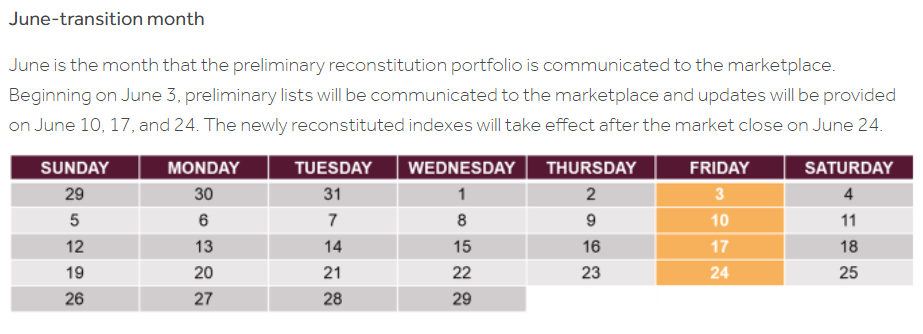
This article proposes a new study for 2022 and addresses the key findings from my multi-year analysis of reported abnormal effects from the Russell 3000 annual reconstitution from June 2017 through June 2022. My tests looked at whether the top-performing new additions to the Russell Index produced abnormally strong results in the following year. Published financial studies have found that:
Stock additions to the Russell 3000 index led to a “dramatic increase” in trading volume ratio in the month of June (Chang et al., 2013).
And that the reconstitution event produced measurable effects worth concentrating on in future studies.
Measurable price effects of the Russell 3000 annual index reconstitution have been documented for both stock additions and deletions (Chang, Hong, & Liskovich, 2013)
Historical Performance Of The Russell 2000 (Small-Cap Index)
The data and results from this study cover the period from June 2017 through June 2022. Intervals are plotted on the Russell 2000 chart (IWM) over the relevant time periods of the studies. The anomaly study was suspended in 2020 due to Covid/QE stimulus distortions and not restarted until last year. The June 2020 selections would likely have been among the largest gains recorded. The 2022 selections will be released to members of the Value & Momentum Breakout community at the end of June following the completion of the FTSE reconstitution June 24th.
FinViz.com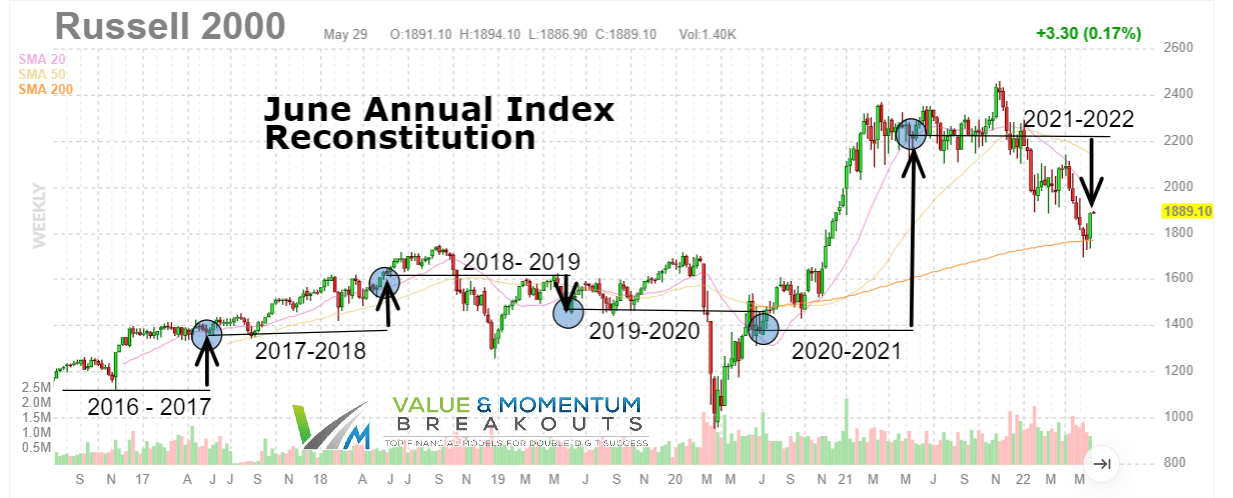
This informal research study has been conducted using different portfolio tests from 2017 to 2021 to evaluate published research and explore new profitable methods to generate abnormal gains from the reconstitution event. So far, the largest impact on the anomaly performance appears to be short term and driven by the broader market conditions. These larger economic forces are closely tied to cracking the hedge fund code with record corporate buybacks and the largest QE 4 accommodative monetary policy in US history. The following S&P 500 index fund (SPY) chart illustrates the Fed intervention since the Global Financial Crisis and the major impact these fund flows create on market studies.
FinViz.com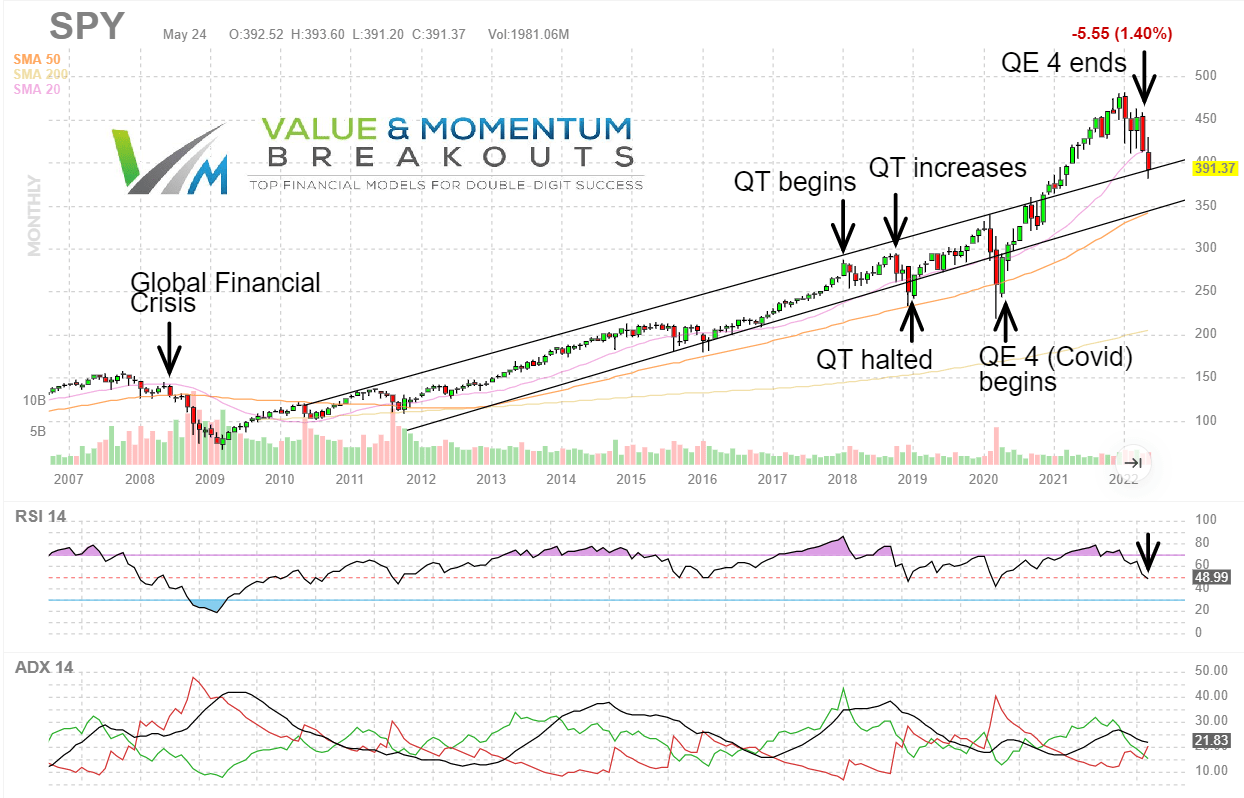
Findings From Scholarly Financial Studies
This section reviews prior published literature documenting excess return results from the Russell’s reconstitution event every June.
Most recently according to Chinco & Sammon (2022) in data from 2001 to 2020 they see a 1.6% abnormal return for additions to the Russell 3000 on reconstitution day that is short lived. Remarkably, their finding validates the Madhavan (2003) study using 1996 to 2001 data and documenting a roughly 2% abnormal return on reconstitution day.
Returns of Russell Index stocks +/- 20 days from Reconstitution day
Chinco & Sammon, 2022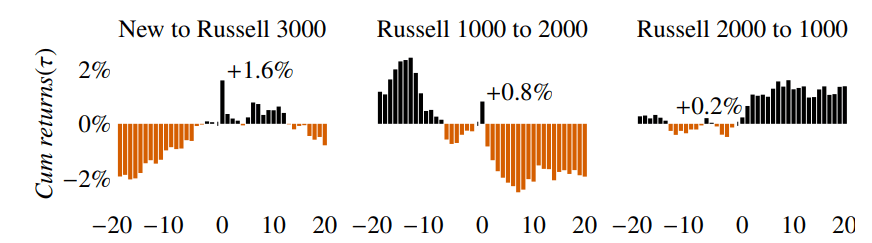
The Russell 3000 index comprises the Russell 1000 and 2000 indices and the charts above also reflects switching effects between the two indices inside the Russell 3000. They document the strongest post reconstitution positive return comes from stocks that move up to the larger cap Russell 1000 index from the 2000 index. This may be intuitive that stocks qualifying to move to a higher cap index are showing more sustainable growth and better economic stability for better returns. It also serves to illustrate where a stronger selection post Russell reconstitution might be better focused to deliver better long term results.
Number of Stocks Switching between Russell 1000 or 2000 indices
Chinco & Sammon, 2022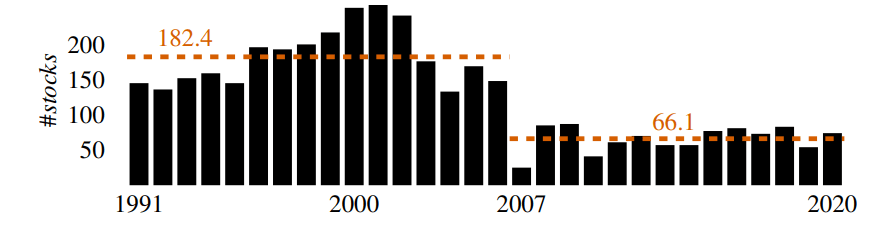
Since the 2007 FTSE/Russell bandwidth rule, there has been a significant decline in the average number of qualified switchers from 182 stocks down to 66 stocks. For 2022 only 60 stocks are migrating between the two indices and this is an area of potentially valuable future analysis.
In the Madhavan (2003) study validate by more current studies, he found several profitable anomalies in the reconstitution data between 1995 through 2001. For example:
- a spread portfolio on the Russell 3000 – long the additions and short the deletions – had a mean return of +6.8% in the month of June as the index was being reconstituted.
- cumulative returns of +27.1% over the months of March to June during the same years.
- the mean return in the month of July for the spread portfolio to be negative -7% following the reconstitution date, suggesting a strong mean reversion.
Cai and Houge (2018) made some remarkable observations that my current ad hoc studies are validating. Their research examined additions and deletions to the small-cap Russell 2000 Index between 1979–2004:
- we found that a buy-and-hold portfolio significantly outperformed the annually rebalanced index by an average of 2.22 percent over one year and by 17.29 percent over five years.
- stocks with good performance grow too big for a small-cap index and continue to have superior performance after being deleted from the index.
- stocks with poor performance become small enough to enter the index but continue to generate low returns.
- we found that in the first year after index rebalancing, the deleted stocks outperformed the added stocks by 67 bps per month.
Zdorovtsov, Tang, and Onayev (2017) evaluated 14 years of Russell 3000 reconstitution behavior between 2000 and 2013 and observed strong positive post-event returns for additions to the index.
Zdorovtsov, Tang, and Onayev (2017)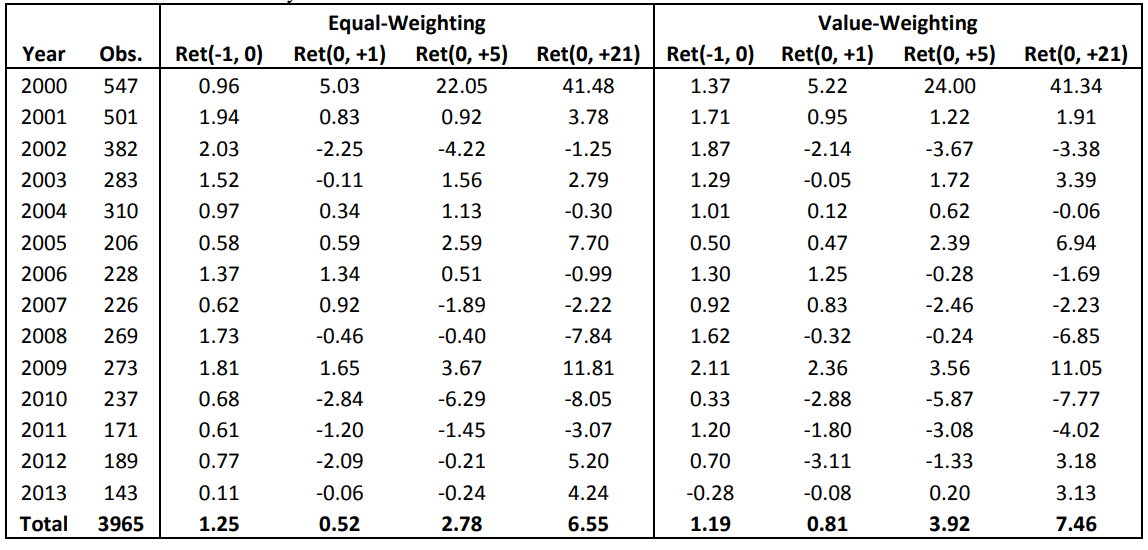
The table from their research above shows the equal and value-weighted returns of the portfolios of stocks which entered the Russell 3000 on the reconstitution day Ret (-1,0) and the next one, five, and 21-day returns.
Prior Russell Anomaly Test Studies
My prior multi-year ad hoc studies are summarized here. The most recent study from the 2021 – 2022 reconstitution period ended the full-year measurement period on Friday, June 24th and the analysis follows. Some strong validation of prior research was observed:
- Validating results from Cai and Houge (2018), a buy/hold Russell 2000 portfolio significantly outperformed all three sample addition portfolios from 2021.
- The 1-year Russell 2000 index return was -25.75%.
- The 1-year return for the Top 20 stocks by most positive 1-month formation performance was -48.4%
- The 1-year return for the Bottom 20 stocks by least positive 1-month formation performance was -49.6%
- The 1-year return for the Control group of 20 stocks most unchanged in the formation period was -48.9%
These one-year results support Cai and Houge (2018) multi-year findings that in the long term a buy/hold portfolio significantly outperforms new addition stock portfolios. The poor performance results of the smaller Russell 2000 stocks again this year also validates their findings that, “stocks with poor performance become small enough to enter the index but continue to generate low returns.”
However, these current 1-year reconstitution study results from 2021 tend to undermine the price momentum anomaly. Fama and French (2008) define price momentum phenomenon, “where stocks with low returns over the last year tend to have low returns for the next few months and stocks with high past returns tend to have high future returns.” Even different sample portfolios based on the different positive, negative and no momentum conditions in the 1-month formation period ended up with no significant difference in their 1-year performance results.
Unlike the study results in 2017 where 83% of the total gains from the sample portfolio were highly positive and realized in the first six months, this latest study resulted in progressively worse performance from the June start to the end. Much of that reflects the macro-economic conditions that have produced the worst 100-day start to the major stock market indices since 1939 and the worst 6-month start since 1962.
The final results of the 2021-2022 1-year returns are posted below. The most positive stock returns appear to be the result of merger, acquisition or positive drug trials having no bearing or close proximity in time to the June reconstitution event.
| Stock | Category | % Gain / Loss 1-year |
| (TRIL) | Top | 71.77% *acquired by PFE Nov 2021 |
| (ACET) | Bottom | 40.08% *positive drug results Dec 2021 |
| (IMPL) | Bottom | 24.83% |
| (STON) | Top | 24.11% *merger talks May 2022 |
| (NFE) | Control | -0.10% |
| (BRBS) | Control | -8.28% |
| (ALPN) | Control | -10.49% |
| (ACRS) | Bottom | -15.57% |
| (LPI) | Top | -16.86% |
| (AFCG) | Bottom | -17.54% |
| (KRT) | Control | -17.65% |
| (NXPI) | Control | -21.84% |
| (BMEA) | Bottom | -23.25% |
| (BHR) | Control | -23.72% |
| (GSAT) | Top | -24.71% |
| (IWM) | Index | -25.75% Russell 2000 ETF buy/hold |
| (DSGN) | Bottom | -32.43% |
| (THRY) | Top | -33.07% |
| (JHG) | Control | -34.36% |
| (PRVA) | Top | -34.40% |
| (ALT) | Top | -36.48% |
| (HQI) | Top | -39.40% |
| (JOAN) | Bottom | -40.76% |
| (TALS) | Bottom | -42.22% |
| (BSY) | Control | -42.46% |
| (GNOG) | Control | -43.79% |
| (CLVT) | Bottom | -44.72% |
| (REPX) | Top | -47.45% |
| (XXII) | Control | -47.62% |
| (AMTX) | Control | -51.12% |
| (POWW) | Top | -52.00% |
| (BGFV) | Bottom | -53.78% |
| (DSEY) | Control | -55.23% |
| (NUVB) | Bottom | -56.85% |
| (ASAN) | Top | -63.58% |
| (BYRN) | Control | -65.38% |
| (QS) | Control | -65.67% |
| (KMPH) | Top | -67.37% |
| (PCT) | Top | -68.44% |
| (CLSK) | Control | -70.32% |
| (TIL) | Top | -73.78% |
| (CTXR) | Top | -75.13% |
| (CVAC) | Bottom | -75.54% |
| (GMTX) | Bottom | -75.68% |
| (SEEL) | Bottom | -76.09% |
| (RPHM) | Control | -76.66% |
| (FUV) | Top | -76.74% |
| (GTBP) | Bottom | -79.13% |
| (FOA) | Bottom | -79.16% |
| (DNMR) | Control | -79.18% |
| (PLBY) | Bottom | -80.67% |
| (SMMT) | Bottom | -82.30% |
| (TSP) | Top | -83.81% |
| (KOPN) | Control | -84.57% |
| (ATOS) | Top | -85.23% |
| (CRIS) | Bottom | -86.62% |
| (HGEN) | Control | -88.17% |
| (MMAT) | Top | -89.13% |
| (SKLZ) | Control | -92.48% |
| (TNXP) | Bottom | -94.69% |
| (HYRE) | Top | -96.58% |
The New 2022/2023 Russell Index Reconstitution Study
A new study will begin for 2022 as result of the research from Chinco & Sammon (2022) that find the strongest excess returns from stocks moving from the smaller cap Russell 2000 index to the larger cap Russell 1000 index. This is further supported by findings from Cai and Houge (2018) who concluded that stocks with good performance grow too big for a small-cap index and continue to have superior performance.
This year the FTSE Russell reports that “315 companies are departing the Russell 2000 Index. 21 companies are moving to the Russell 1000 Index, 249 are moving to the Russell Microcap Index, and another 45 companies are leaving the Russell US Indexes universe altogether.
This next study will be very unique from all prior years and will study the performance results of the 60 migrating companies between the Russell 2000 and 1000 indices. 21 companies are moving up from the Russell 2000 to the Russell 1000 index and 39 companies are moving down to the Russell 2000.
FTSE Russell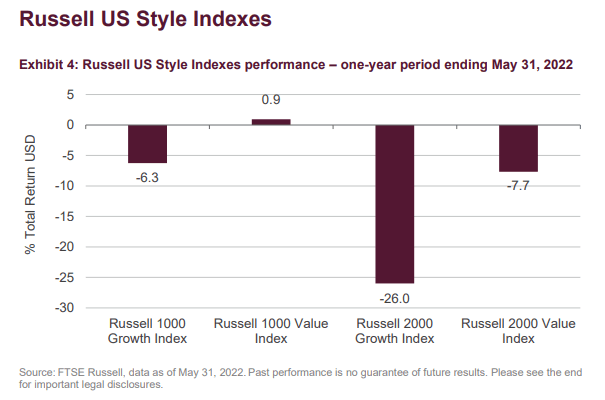
The 1-year results above from FTSE Russell show how much better the larger cap 1000 Growth Index outperformed the 2000 Growth Index this year. It is also possible that the migrating stocks to the Russell 1000 index carry additional positive momentum that generates abnormal returns above all the Russell indices. This fascinating new study has the potential for greater abnormal returns into 2023 and will be tracked live on the V&M Dashboard spreadsheet exclusively for members.
References
Cai, J. & Houge, T. (2018). Long-Term Impact of Russell 2000 Index Rebalancing. Long-Term Impact of Russell 2000 Index Rebalancing
Chang, Y., Hong, H., & Liskovich, I. (2013). Regression Discontinuity and the Price Effects of Stock Market Indexing. doi:10.3386/w19290
Chinco, A. & Sammon, M. (2022). Excess Reconstitution-Day Volume. Available at http://dx.doi.org/10.2139/ssrn.3991200
Fama, E. F., & French, K. R. (2008). Dissecting Anomalies. The Journal of Finance, 63(4), 1653-1678. doi:10.1111/j.1540-6261.2008.01371.x
Zdorovtsov, V., Tang, O. & Onayev, Z., Predatory Trading Around Russell Reconstitution (2017). Available at http://dx.doi.org/10.2139/ssrn.3021022
Be the first to comment