

landbysea
Introduction
Transocean (NYSE:RIG) released its third quarter 2022 results on November 2, 2022.
Also, Transocean published its last fleet Status Report on October 13, 2022.
Note: I have followed RIG quarterly since 2014. This new article is a quarterly update of my article published on August 22, 2022.
The company indicated, “The aggregate incremental backlog associated with these fixtures is approximately $1.6 billion. As of October 13, the company’s total backlog is approximately $7.3 billion.”
Since then, Transocean announced two significant contracts on December 7, 2022, for an additional backlog of $1,039 million. It was good news showing a healthy contracting in H2 2022.
- Deepwater Corcovado was awarded a four-year contract, which contributes an estimated $583 million in backlog and is expected to begin in the third quarter of 2023 in direct continuation of the rig’s current contract. The daily rate is estimated at $400/day.
- Deepwater Orion was awarded a three-year contract, which contributes an estimated $456 million in backlog and is expected to commence during the fourth quarter of 2023. The daily rate is estimated at $416/day.
As of December 8, 2022, the estimated backlog jumped to $8.1 billion. The second consecutive increase in the backlog registered by the company for years.
RIG recently declared that one of its subsidiaries, along with Perestroika A.S., formed a joint venture named Liquila Ventures Ltd.
Finally, on November 11, 2022, Transocean, Perestroika A.S. and funds managed by Lime Rock Management L.P. (joint venture recently formed) announced that they acquired,
the ultra-deepwater newbuild drillship — formerly known as West Aquila — Hull 3623 from the South Korean shipbuilding firm Daewoo Shipbuilding & Marine Engineering Co., Ltd. The consideration for the transaction is approximately $200 million.
This purchase is a good sign that the company is turning increasingly confident shortly.
1 – 3Q22 Results snapshot
Transocean came out with a better-than-expected quarterly loss of $28 million or $0.04 per share compared to a loss of $0.20 per share a year ago. Transocean posted a third-quarter loss narrower than estimates and revenues outperforming analysts’ expectations.
Cash from operations was $230 million, and quarterly free cash flow was estimated at $143 million in 3Q22.
Operating and maintenance expense was $411 million, compared to $433 million in the prior period. However, despite a better-than-expected quarter loss, the company can still not generate a profit which I see as very concerning due to the massive debt load.
Below is the backlog history since 2015. The backlog has dropped continuously despite two acquisitions (Songa Offshore and Ocean Rig) and has reached a low of $6.1 billion in 1Q22.
On the positive side, the company is now turning around, and contracts are finally showing improvements in duration and daily rate. The question is how much of it will improve the bottom line. I have estimated the backlog at $8.1 billion as of December 8, 2022, including the two recent contracts mentioned earlier.
RIG Quarterly Backlog history (Fun Trading)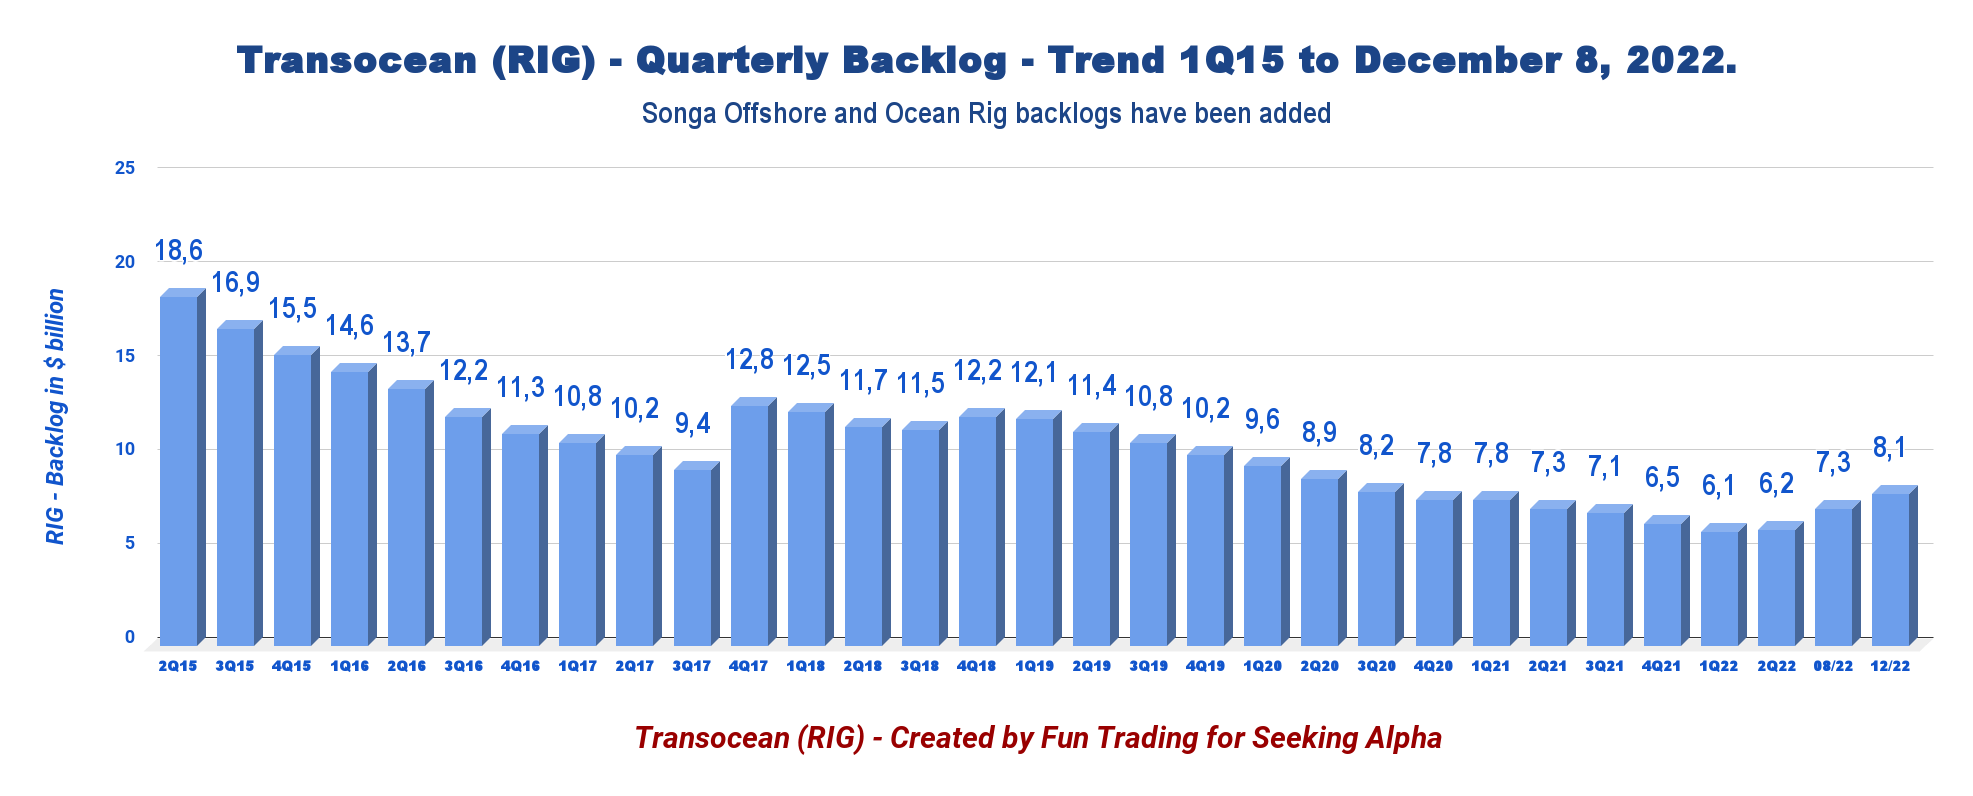
Transocean’s Ultra-deepwater floater revenues represent 62.7% of the total contract drilling revenues, while Harsh Environment floaters accounted for the remaining 37.3%. Also, the ultra-Deepwater backlog represents approximately 90.5% of the total backlog.
I have estimated 15 drillships, or Harsh Environment stacked or idled out of a fleet of 40 rigs.
During 3Q22, revenues from the Ultra-deepwater and HE floaters are $433 million and $258 million, from $428 million and $198 million in 3Q21.
2 – Investment thesis
The rally in oil prices from March to June 2022 triggered a robust positive effect on the offshore drilling sector. However, It took Transocean about two quarters to show some improvements in the backlog, but it finally happened, and shareholders should be delighted with the recent backlog news.
RIG Oil and Gas chart 1-year (Fun Trading StockCharts)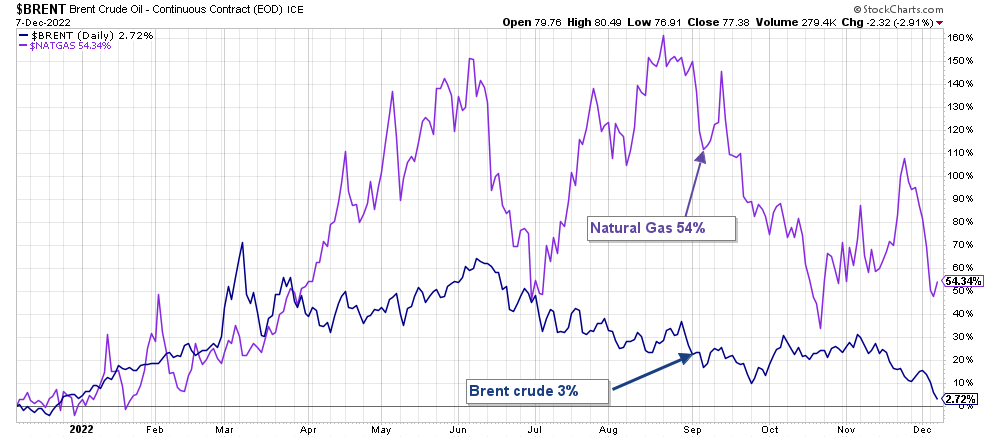
However, oil prices have retraced significantly in the past few months and are back to the level a year ago. It is natural to think that if bullish oil prices can lift the offshore drilling sector, it can have an adverse effect if they turn bearish again, as we experience now.
The world economy is slowly tipping into a recession induced by the Fed, which will affect oil demand. It is widely expected that the Fed will raise interest rates by 50 points on December 14.
The bottom line is that Transocean’s balance sheet is weak despite the recent oil price shift, and it seems unable to cut its massive debt burden of about $7.2 billion.
Thus, RIG is not suited for a savvy investor’s portfolio but fits a special kind of trader looking for high-risk/reward potential.
Nothing has changed since my preceding article, and I suggest trading short-term LIFO, about 60%-80% of your RIG position, and keeping only a tiny long-term core position for a higher target.
This dual strategy entitles you to take full advantage of the offshore drilling sector’s high volatility and inherent cyclicity. It is what I recommend in my marketplace, “The Gold and Oil Corner.”
3 – Stock performance
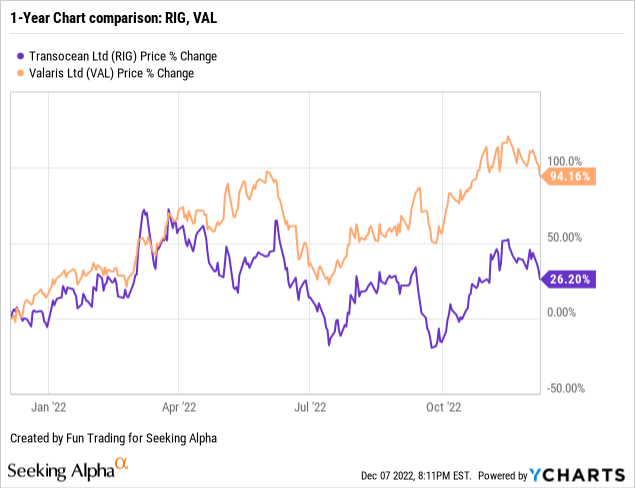
Transocean has significantly underperformed Valaris Ltd. on a one-year basis. However, RIG is now up 26% on a one-year basis.
4 – Average day rates and utilization for 3Q22
The third quarter average day rate decreased to $343.4k/d from the year-ago level of $367.1k/d. However, the average daily rate increased significantly sequentially, which is encouraging. Utilization increased from the same quarter a year ago to reach 59.4%.
| Day rates | 3Q21 | 4Q21 | 1Q22 | 2Q22 | 3Q22 |
| The average daily rate is $k/d | 367.1 | 352.5 | 334.5 | 358.1 | 343.4 |
| Average Utilization | 53% | 53.4% | 52.7% | 58.2% | 59.4% |
Transocean – 3Q22 and Selected Financials History – The Raw Numbers
| Transocean | 3Q21 | 4Q21 | 1Q22 | 2Q22 | 3Q22 |
| Total contract drilling in $ Billion | 0.626 | 0.621 | 0.586 | 0.692 | 0.691 |
| Net Income in $ Million | -130 | -260 | -175 | -68 | -28 |
| EBITDA $ Million | 249 | 192 | 165 | 249 | 284 |
| EPS diluted in $/share | -0.20 | -0.40 | -0.26 | -0.10 | -0.04 |
| Cash from operating activities in $ Million | 141 | 185 | -1 | 41 | 230 |
| Capital Expenditure in $ Million | 37 | 71 | 106 | 115 | 87 |
| Free Cash Flow in $ Million | 104 | 114 | -107 | -74 | 143 |
| Cash and short-term investments $ Billion | 0.900 | 0.976 | 0.911 | 0.729 | 0.954 |
| Long-term debt in $ Billion (including current) | 7.348 | 7.170 | 7.011 | 7.223 | 7.201 |
| Shares outstanding (diluted) in Million | 653 | 658 | 664 | 692 | 714 |
| Backlog | 3Q21 | 4Q21 | 1Q22 | 2Q22 | 3Q22 |
| RIG Backlog in $ billion | 7.1 | 6.5 | 6.1 | 6.2/7.4 | 7.3/8.1* |
Source: press release
* Estimated by Fun Trading
Analysis: Revenues, Earnings Details, Free Cash Flow, and Net Debt
1 – The company posted quarterly revenues of $691 million in 3Q22
Note: The total adjusted contract drilling revenues were $730 million, from $722 million in 2Q22.
RIG Quarterly Revenues history (Fun Trading)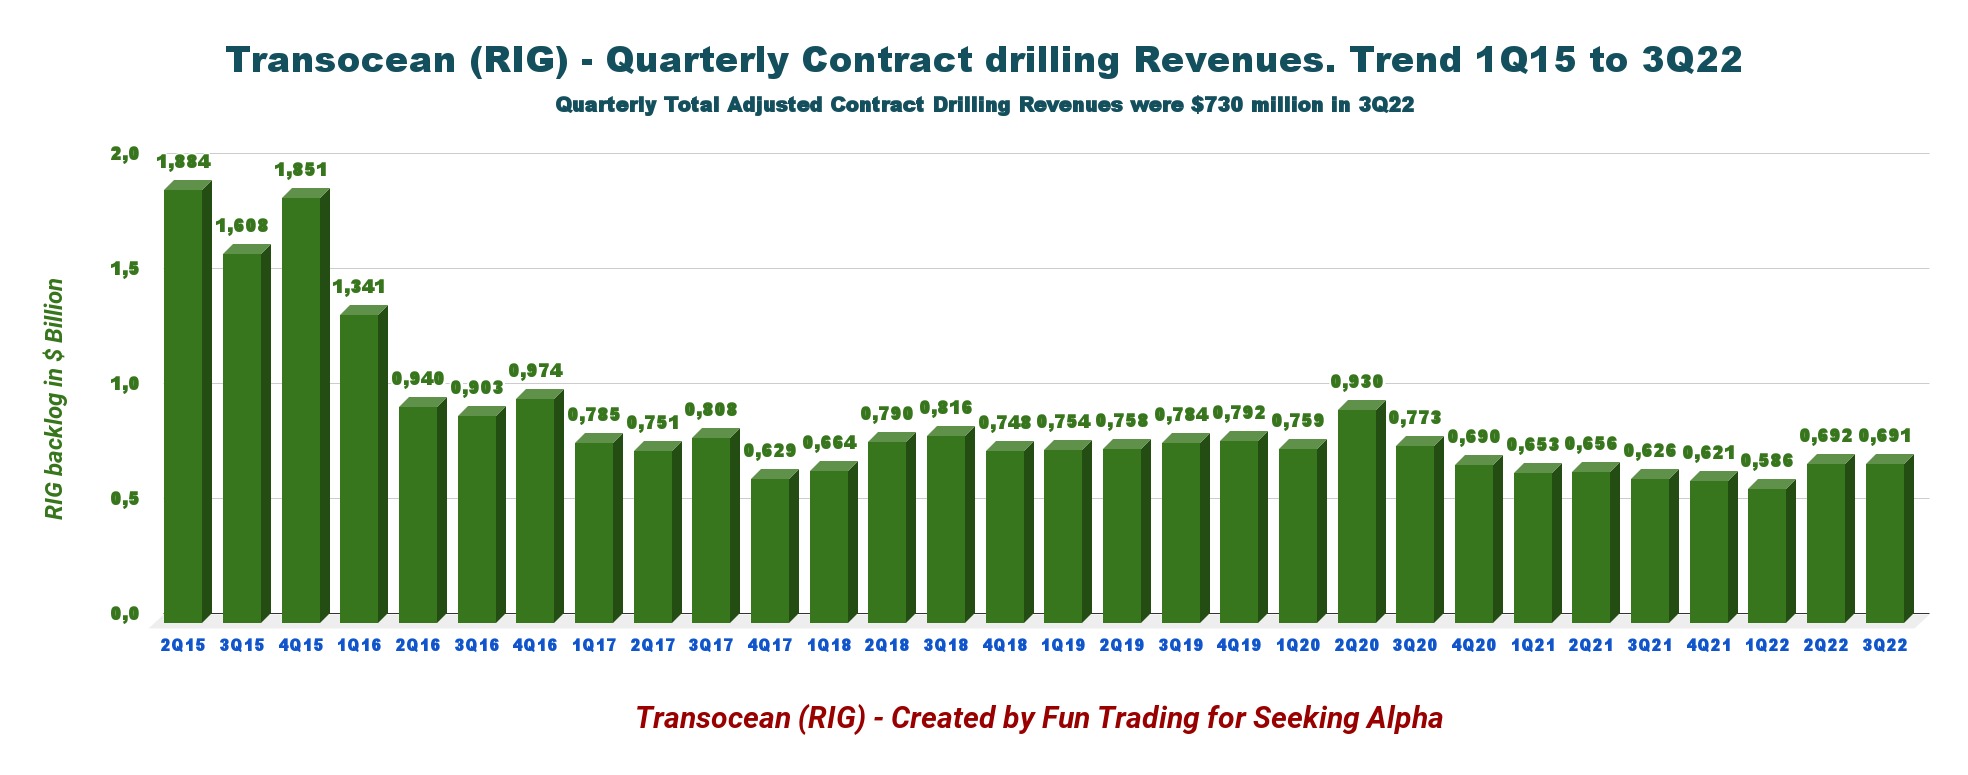
Transocean’s revenues in 3Q22 increased to $691 million from $626 million in 3Q21, an increase of 10.4%. Total adjusted contract drilling revenues were $730 million in 3Q22. Revenue efficiency was high this quarter at 95%, compared to 97.8% in the prior quarter.
The net loss in the third quarter of 2022 was $28 million or $0.04 per diluted share.
The adjusted EBITDA was $268 million, compared to $245 million in the prior quarter, resulting in an adjusted EBITDA margin of approximately 37%.
The 3Q22 earnings beat analysts’ expectations.
CFO Mark Mey said in the conference call:
Revenues above our previous guidance due to a combination of more than anticipated operational days and early termination payment on the Equinox and higher reimbursables, partially offset by lower-than-expected revenue efficiency.
2 – Free cash flow was $143 million in 3Q22
RIG Quarterly Cash versus Debt history (Fun Trading)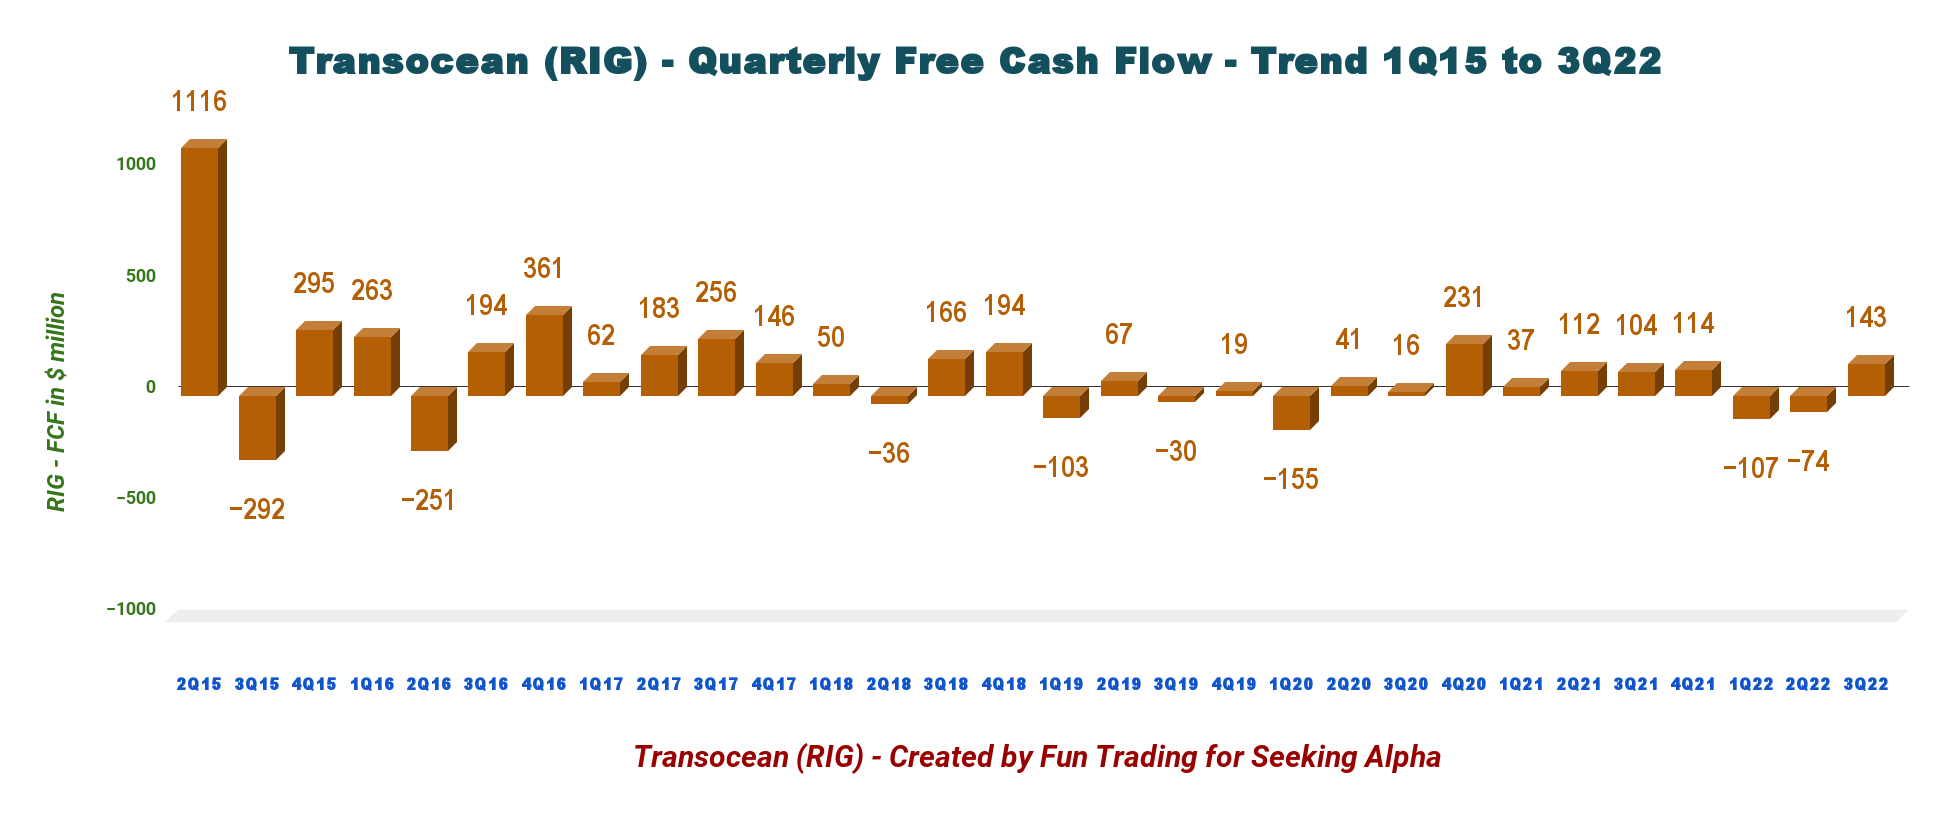
Important Note: The generic free cash flow is the cash from operating activities minus CapEx.
The cash from operations jumped to $240 million in 3Q22, while CapEx stayed low at $87 million from $115 million the preceding quarter. RIG had a free cash flow estimated at $143 million in 3Q22. Trailing 12-month free cash flow was $76 million.
3 – Net debt (gross debt minus total cash) was $6.25 billion in 3Q22
RIG Quarterly Cash versus Debt history (Fun Trading)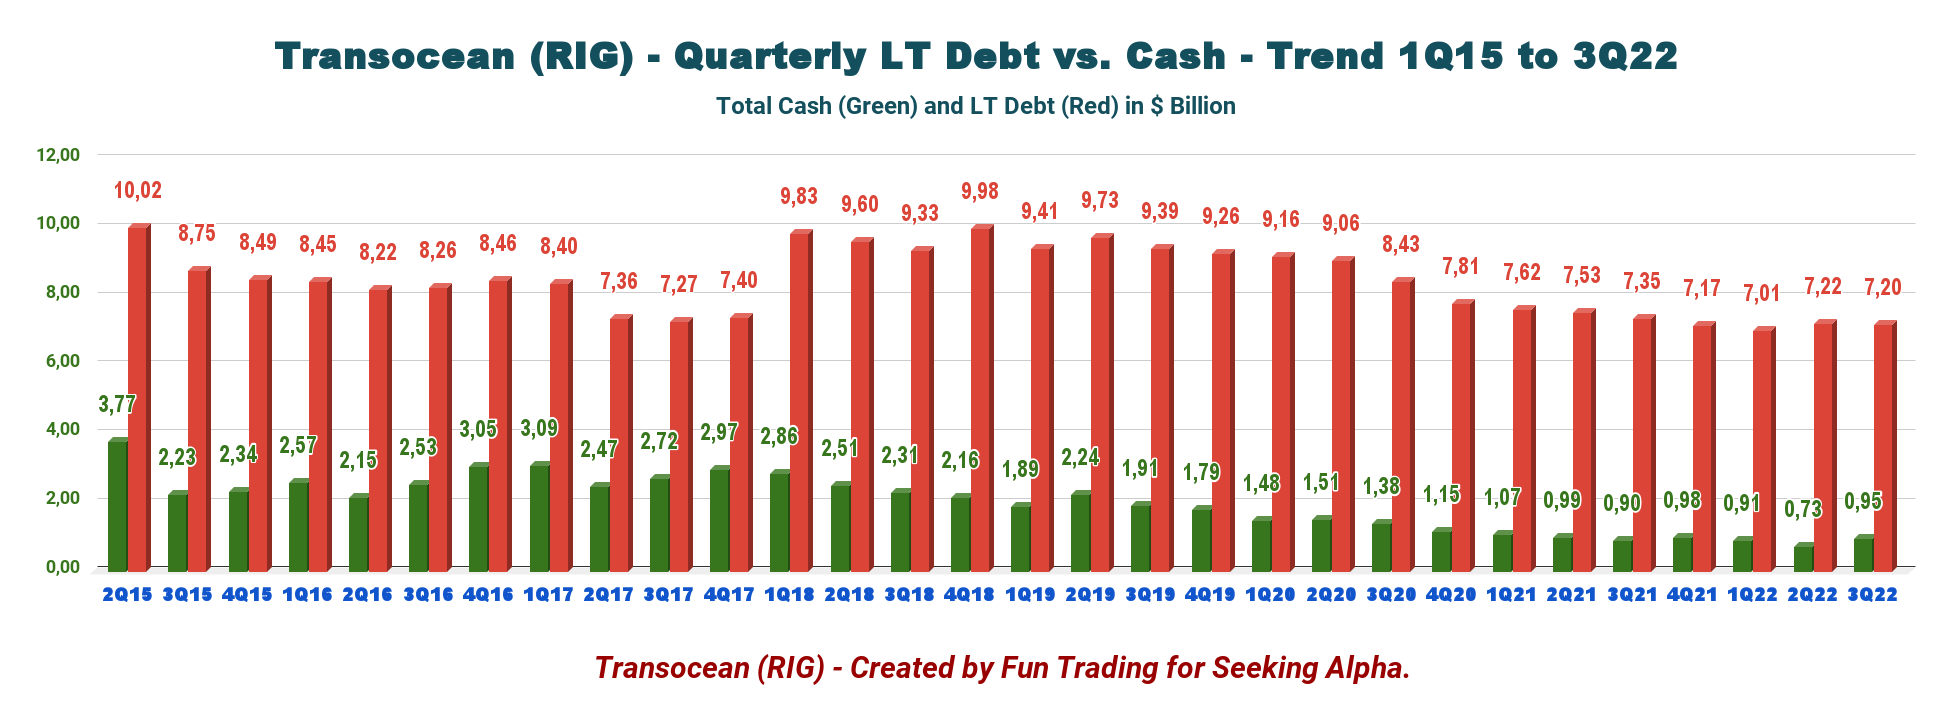
Net debt is about $6.25 billion as of September 30, 2022, compared to $6.45 billion in the same quarter a year ago. Total liabilities increased from $1,303 million in December 2021 to $1,505 million.
However, the total cash was $954 million, up significantly sequentially (please see the chart above). Transocean indicated that it received proceeds of $264 million from issuing shares, net of issue costs this quarter. The company has an ATM program. Here is an excerpt from the 10Q:
On August 5, 2022, we entered into an equity distribution agreement with a sales agent for the offer and sale of our shares, with a maximum aggregate net offering price of up to $435 million, under the ATM Program. In the three and nine months ended September 30, 2022, we received aggregate cash proceeds of $58 million and $264 million, respectively, net of issue costs, for the aggregate sale of 16.2 million and 61.0 million shares, respectively, under the ATM Program. In the three and nine months ended September 30, 2021, we received aggregate cash proceeds of $75 million and $141 million, respectively, net of issue costs, for the aggregate sale of 16.5 million and 31.7 million shares, respectively, under the ATM Program.
The shares outstanding diluted for 3Q21 jumped to 714 million shares, up 9.3% on a one-year basis.
Transocean’s debt structure is the leading cause for concern, as the company has $7.20 billion in debt (including current) and is still unable to be profitable on a net income basis.
On July 27, 2022, Transocean amended the bank credit agreement for its Secured Credit Facility to extend the maturity date from June 22, 2023, to June 22, 2025.
Finally, on September 30, 2022, in connection with the issuance and sale of the 4.625% Senior Guaranteed Exchangeable Bonds in the 2022 Private Exchange, Transocean issued 22.2 million warrants to purchase Transocean Ltd. shares. Holders may exercise the warrants before the close of business on March 13, 2026, at an exercise price equal to $3.71 per share.
Technical Analysis and Commentary
RIG TA Charts short-term (Fun Trading StockCharts)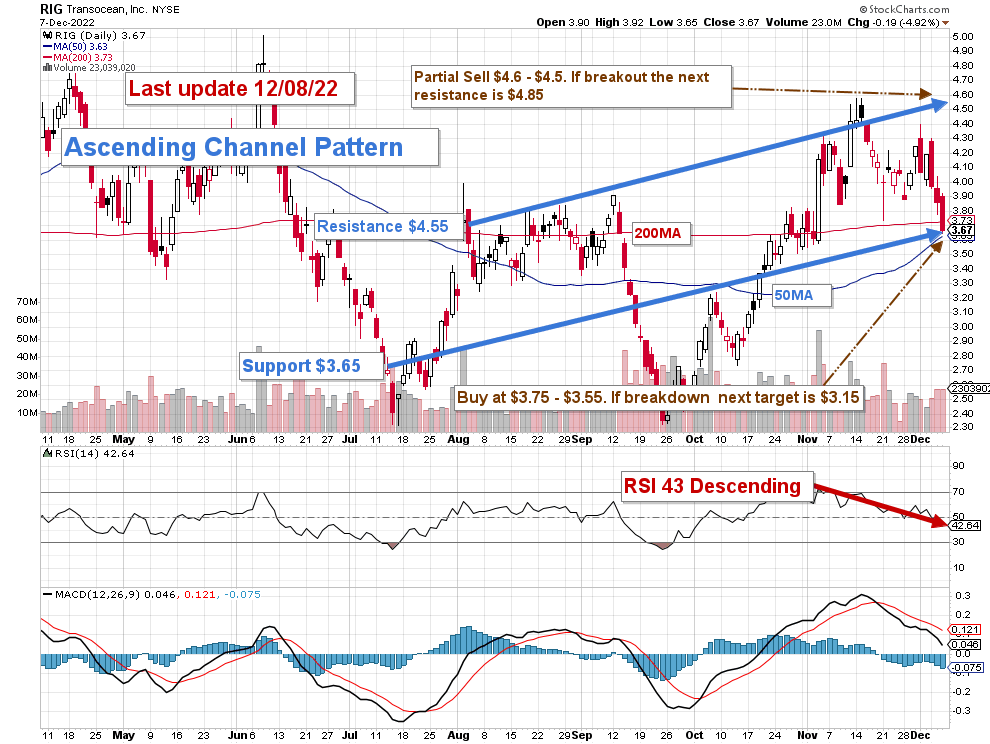
RIG forms an ascending channel pattern with resistance at $4.55 and support at $3.65. Ascending channel patterns are short-term bullish moving higher within an ascending channel, but these patterns often form within longer-term downtrends as continuation patterns. RSI is now 43 and shows selling pressure and may indicate a breakdown soon.
The trading strategy that I recommend is to keep a tiny long-term position and use about 80% to trade LIFO while waiting for a higher final price target for your core position between $5 and $6.
I suggest selling ~40% between $4.50 and $4.60 and another 40% above $4.85. I recommend waiting for a retracement between $3.75 and $3.55 to accumulate again, with possible lower support at $3.15 if support cannot hold.
RIG will move with the general oil sector and may enter a period of consolidation if oil prices stay depressed. The risk of a recession in 2023 is increasing, and oil demand may drop significantly, affecting oil prices and the oil industry, including offshore drilling.
Warning: The TA chart must be updated frequently to be relevant. It is what I am doing in my stock tracker. The chart above has a possible validity of about a week. Remember, the TA chart is a tool only to help you adopt the right strategy. It is not a way to foresee the future. No one and nothing can.
Author’s note: If you find value in this article and would like to encourage such continued efforts, please click the “Like” button below to vote for support. Thanks.
Be the first to comment