

Sundry Photography
Health Care Equipment & Services stocks have fared well against the S&P 500 over the last year. Many thanks go to stalwart UnitedHealth Group (UNH) while the second-largest component in the industry has performed poorly, though. Could an earnings report be an upside catalyst for Abbot Labs?
UNH Strong, ABT Weak in Health Care Equipment & Services
Goldman Sachs Investment Research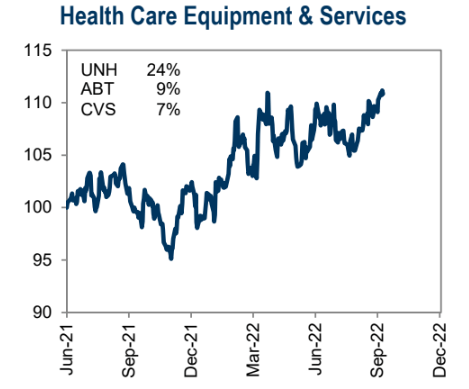
According to Bank of America Global Research, Abbott Laboratories (NYSE:ABT) is a leading diversified global Health Care company that develops, manufactures, and markets branded generics, medical devices, nutritional products, and diagnostic solutions.
The Illinois-based $176 billion market cap Health Care Equipment & Supplies industry stock within the Health Care sector trades at an above-market 21.1 trailing 12-month GAAP price-to-earnings ratio and pays a 1.9% dividend yield, according to The Wall Street Journal. The firm endured challenges regarding baby formula shortages earlier this year, but its management team also boosted earnings guidance following its Q2 report back in July.
ABT had achieved strong earnings growth before 2022, warranting a premium valuation. Its solid balance sheet was thought to be durable during a recession, but the market seems to think otherwise given the significant stock price drop off the high this year. Perhaps reduced Covid testing revenue pressures profits. Other risks include issues regarding its product pipeline, exposure to struggling emerging markets, and a further strengthening of the U.S. dollar.
On valuation, analysts at BofA see earnings falling about 5% this year and another 8% in 2023. Some reversion to moderate EPS growth is expected by 2024, however. The Bloomberg consensus per-share profit forecast is slightly more optimistic than BofA’s.
Even with decent free cash flow yield, the stock’s operating and GAAP P/E ratios look to remain elevated. If we give the stock a 20x multiple, that puts shares fairly priced near $95 assuming a slight cut to earnings given recent market and FX events.
Abbott: Earnings, Valuation, Dividend Forecasts
BofA Global Research
Looking ahead, corporate event data from Wall Street Horizon show a confirmed Q3 2022 earnings date of Wednesday, Oct. 19 BMO with an earnings call immediately following numbers crossing the wires. You can listen live here. There is also a dividend pay date slated for Nov. 15.
Corporate Event Calendar
Wall Street Horizon
The Options Angle
Digging into expectations around this week’s earnings report, data from Option Research & Technology Services (ORATS) show a small 2.9% expected stock price swing post earnings using the nearest-expiring at-the-money straddle. That is on the lower end of its historical implied share price move post-earnings range since 2019
ORATS also shows a $0.94 consensus EPS forecast which would be a significant 33% per-share profit drop from the same quarter a year ago. Since its July upside earnings surprise, there have been three analyst upgrades of ABT and a single downgrade. Also positive for the firm is a fantastic EPS beat rate history with bottom-line numbers topping estimates in each quarter since Q3 2019. Historical stock price reactions have been mixed, though, per ORATS data.
ABT: Strong Earnings Beat Rate History, Mixed Stock Price Reactions
ORATS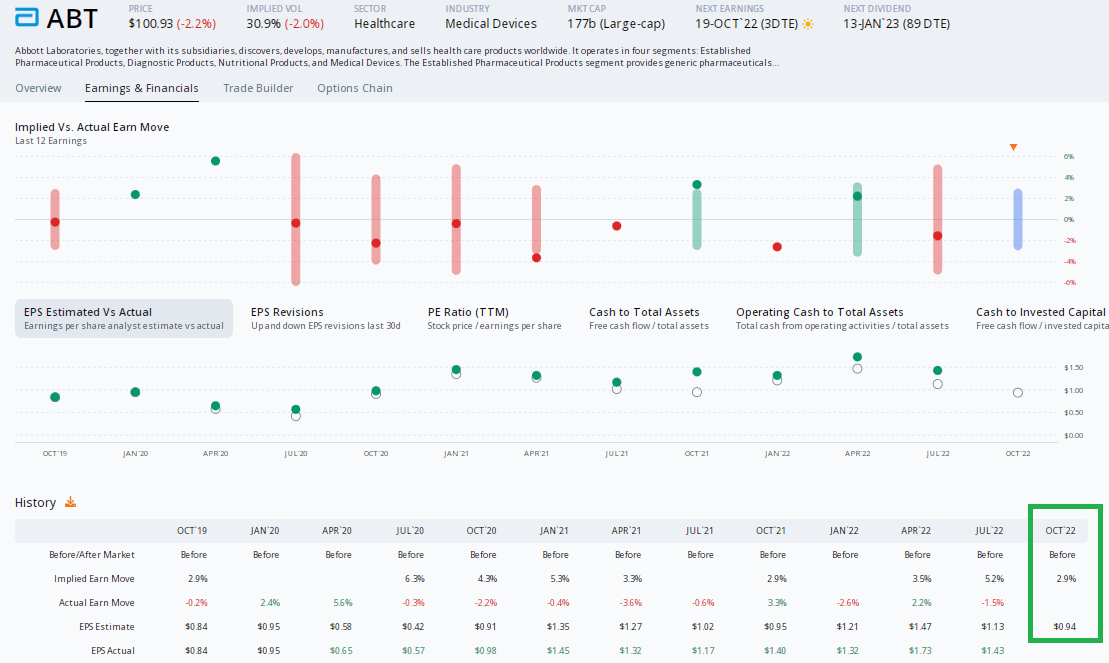
The Technical Take
ABT continues to endure a sharp downtrend off its early 2022 peak. Looking at an 8-year chart, the stock has retraced more than a third of its 2016 to 2022 rally. The key Fibonacci retracement levels are thought to be 38.2% and 61.8%. If that’s the case, then next support would be way down near $77. Perhaps buyers step up near some congestion around the stock’s pre-Covid high near $90 – that would be a 50% rally retracement and a nearly 40% pullback off the all-time high.
Shares still look to head lower technically. Take a look at the RSI indicator at the top of the chart. It’s clearly confined to the bearish 20 to 60 range. Technicians say that for bullish trends to be in place, a range of 40 to 90 would be seen. RSI, in this case, further cements a bearish trend.
ABT: Bearish RSI Range, Lack Of Buyers At Current Prices
Stockcharts.com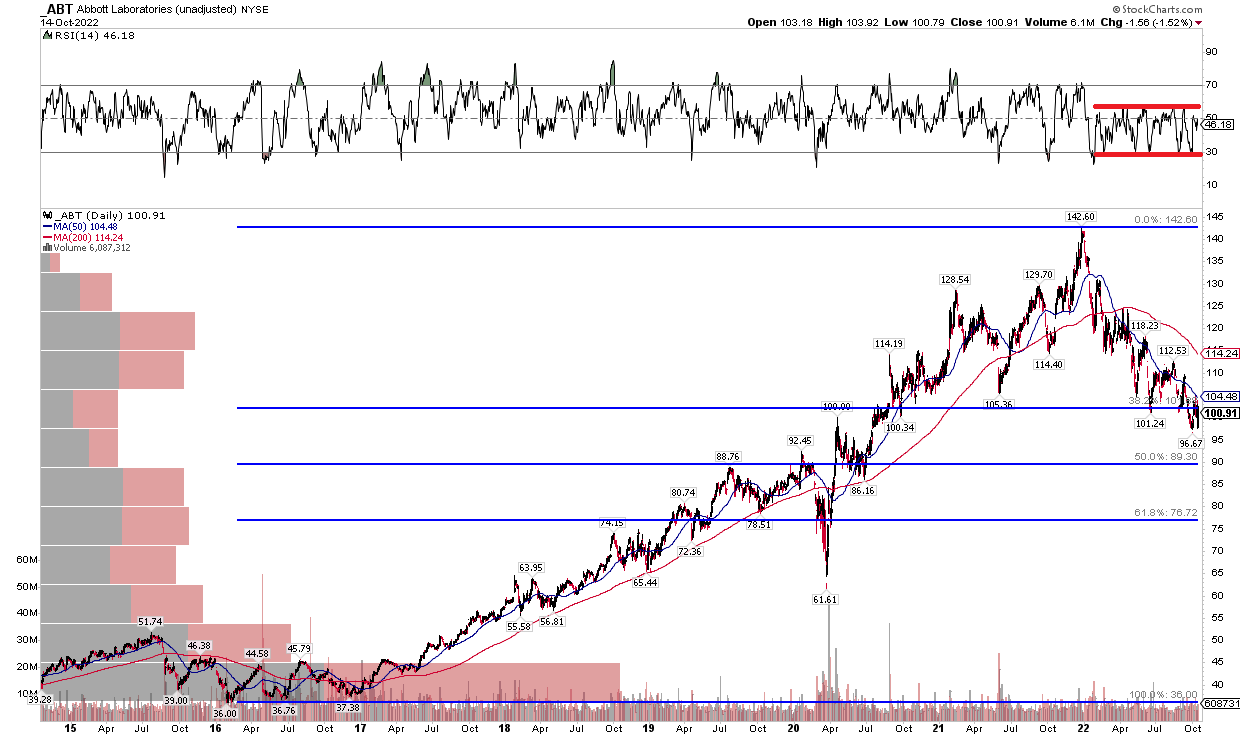
The Bottom Line
I think ABT might have more downside room to go based on bearish technical momentum and a stock that does not scream value or even GARP quite yet. While the firm will likely beat on earnings this week, the stock might trade lower. Look to buy on a further pullback to its pre-Covid high or even at the 61.8% retracement point.
Be the first to comment