

da-kuk
Once again, there are too many bears
In similar fashion to where markets were positioned in June, we again are reaching a point where this sell-off may have become a little long-in-the-tooth, with several market indicators suggesting another bear market rally may be forthcoming. Namely, bearish sentiment and market positioning have once again reached levels where further downside appears unlikely in the short term despite the fundamental and macro case for such an outcome.
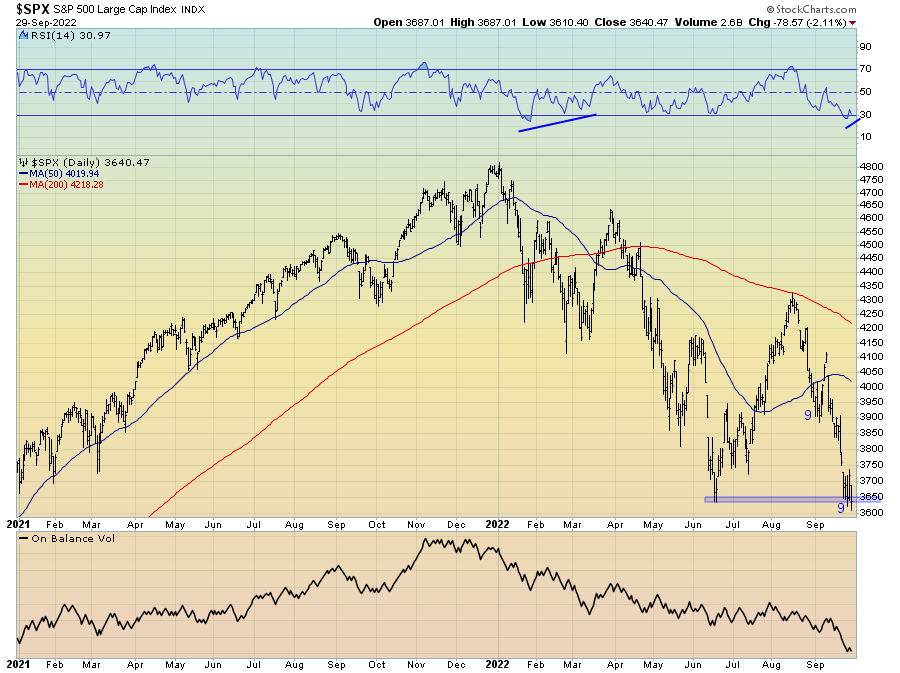
From a technical perspective, since the outright rejection by the 200-day moving average that saw the end to the summer rally in stocks, the renewed bear market has seen equities again trade down to the June lows, with this area being around 3,650 for the S&P 500. Encouragingly, this support area has held up thus far and has been accompanied by a DeMark sequential 9 buy signal and perhaps a slight positive divergence in momentum per the RSI.
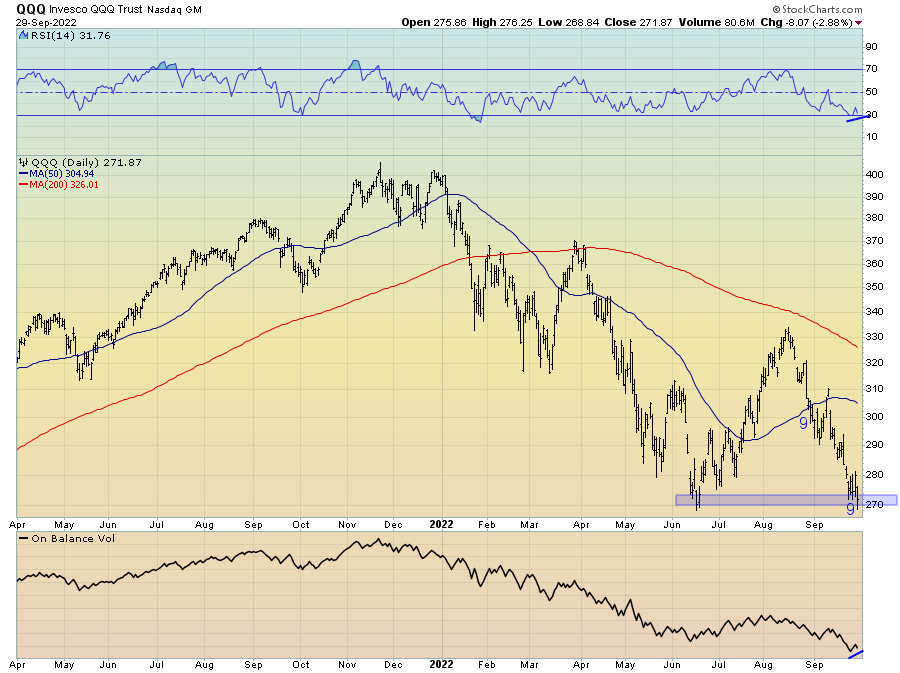
The same can be said of the Nasdaq. This test of horizontal support appears to be an excellent starting point for a needed countertrend rally to an oversold stock market.
Though the technical picture is nothing to rave about, through the lens of risk appetites, positioning and sentiment, a countertrend move does appear justified. Indeed, several measures of investor risk appetites are perhaps most strongly of this opinion.
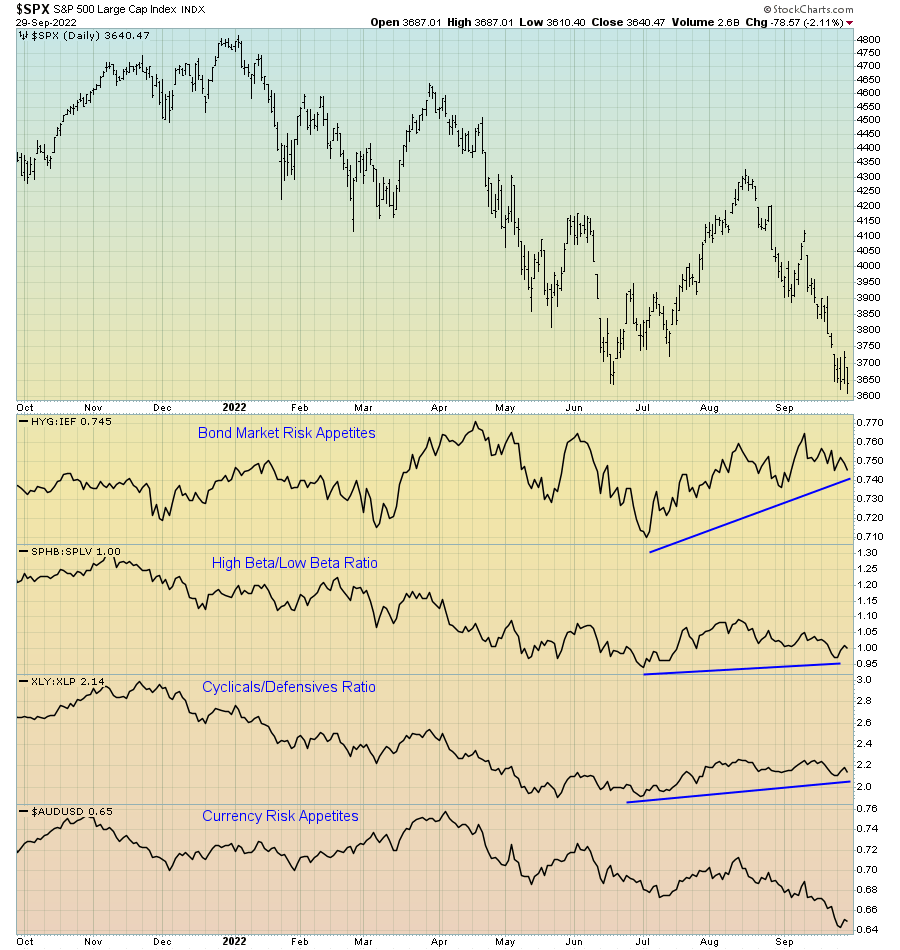
In a more notable fashion than what occurred at the June lows, this recent move lower in stocks has now seen significant positive divergences in bond market risk appetites, the ratio of high-beta stocks to low-beta stocks ratio and that of cyclical stocks to defensive stocks. Generally, when measures of market internals such as these diverge in such a way from the price action of the overall index, it does a good job of foretelling what may lie ahead.
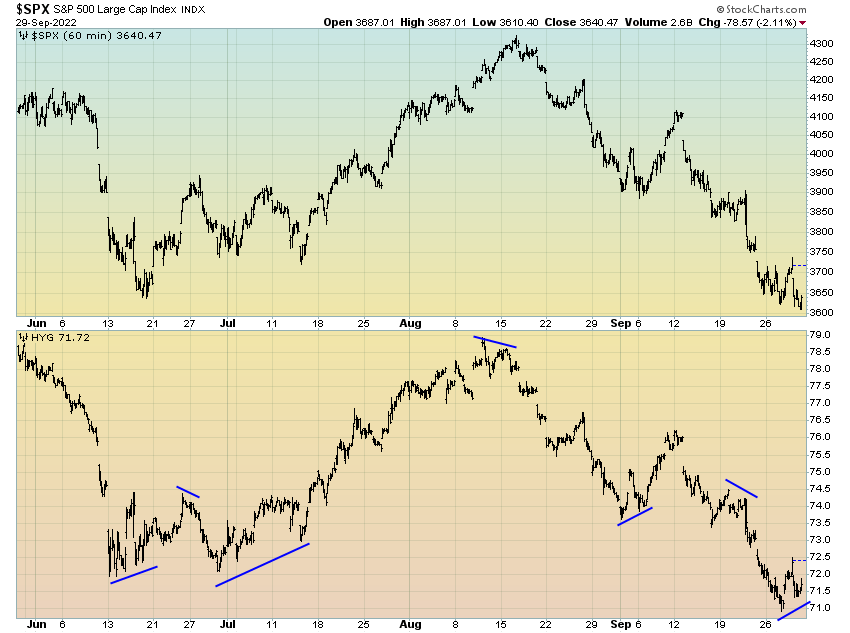
Similarly, when we compare the price action of the S&P 500 to junk bonds (via HYG), the latter does a decent job of leading the former over the short-term at local highs and local lows. This week’s price action has seen junk bonds diverge positively from stocks in a manner that suggests the selling may be done for now.
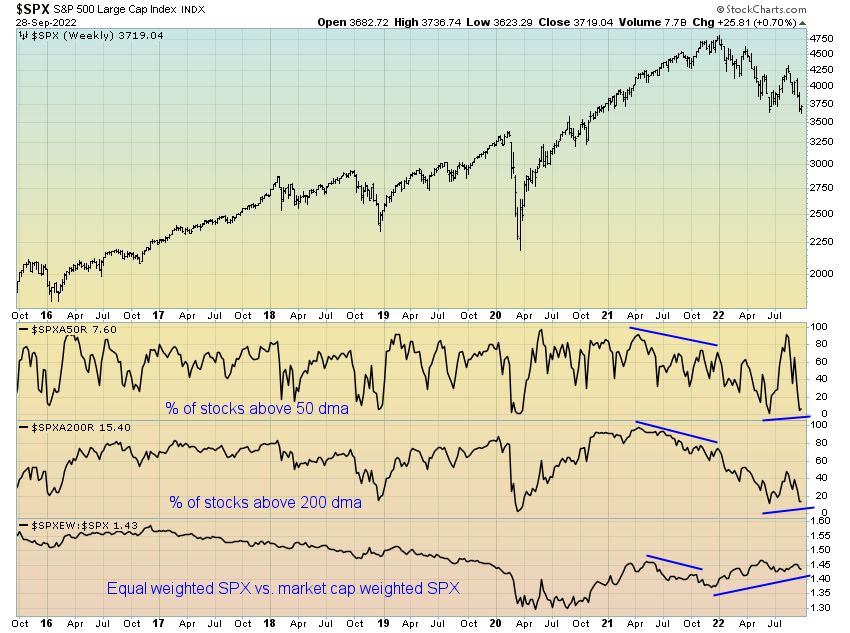
In a manner similar to risk appetites sending a seemingly bullish signal, positive divergences are also beginning to show up in several of the market breadth measures I monitor. Notably, the percentage of stocks trading above their 50-day moving averages has again reached single digit levels, suggesting a short-term low may be nearing.
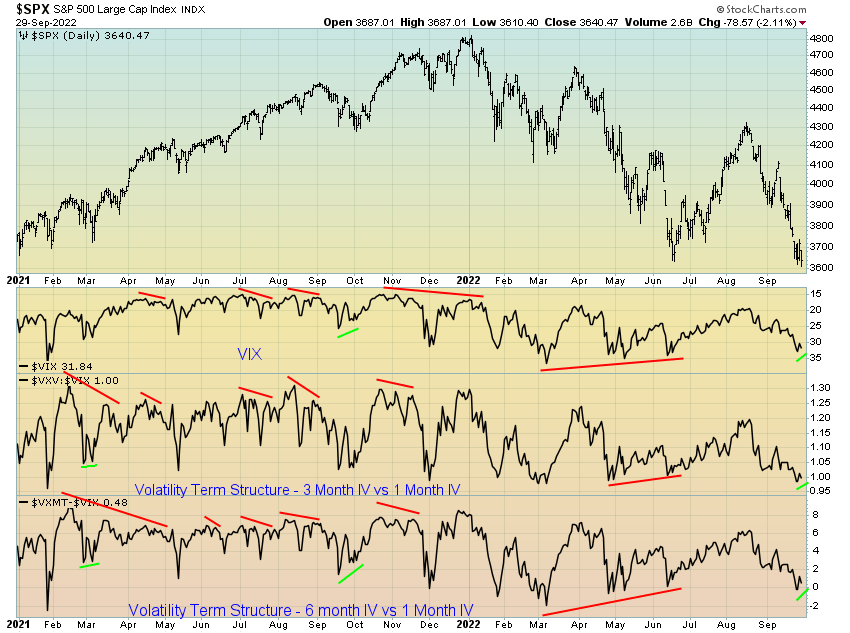
Additionally, both the VIX term structure and VIX itself look to be diverging positively from price, another indicator with a reliable ability to presage future price action.
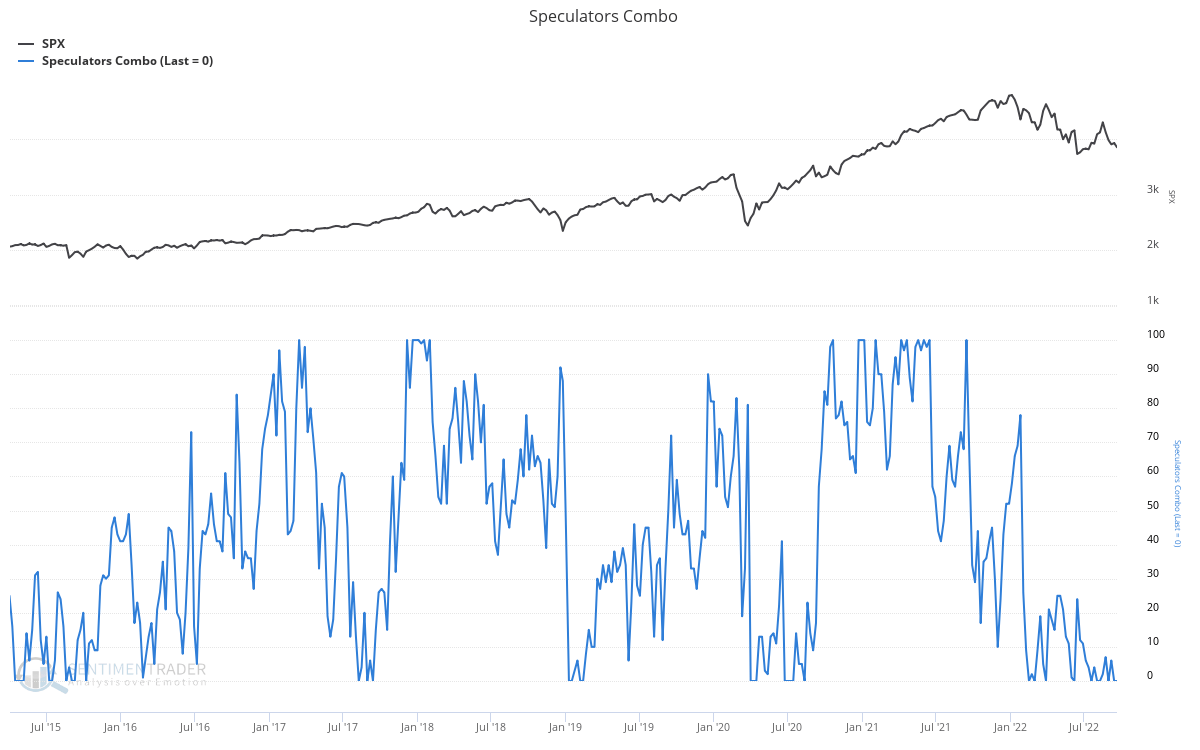
From a sentiment and positioning standpoint, by nearly every measure, investors are bearish and short the market (which I am sure is not of news to you dear reader). Indeed, the combined speculative positioning in the various equity futures markets is max-short. Though this has been the case for much of 2022, at least some level of short-covering looks to be a requirement before we see stocks continue lower as fundamentals and macro conditions say they should.
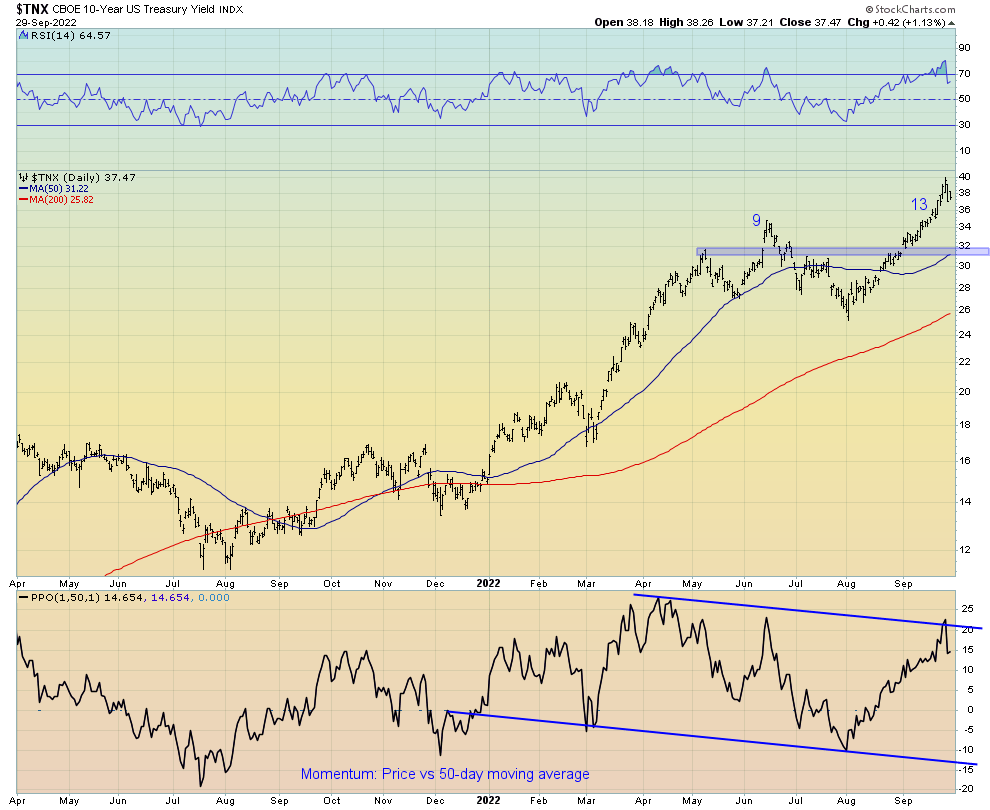
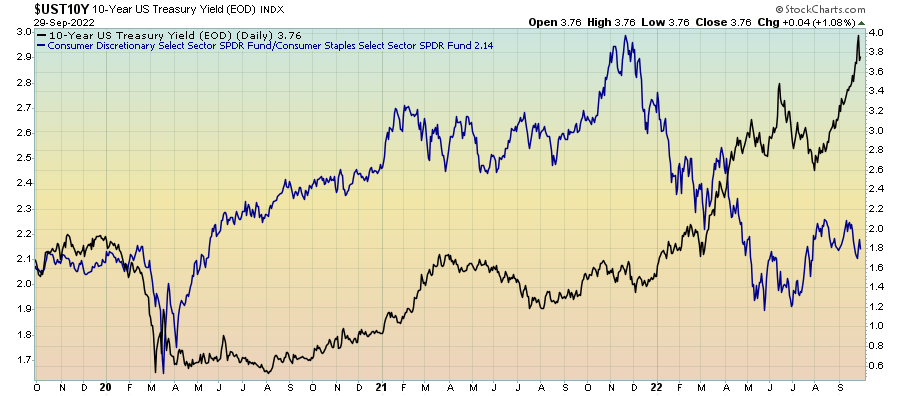
One asset class that would lend credence to the idea of another short-covering rally is a pull-back in yields. The new highs across the entire Treasury curve have come on the back of lackluster liquidity within the rates market along with structural issues brought about via Fed tightening, dollar strength and persistent inflation.
Such dynamics are perhaps causing rates to not act as they should, or at least not how they have done so in recent times given the macro outlook. However, worth noting is how the new highs in the 10-year have not been confirmed via new highs in momentum (measured here via the price relative to the 50-day moving average).
Similar to stocks, the bond sell-off looks oversold (yields overbought) and due for respite. A pull-back in yields seems plausible from here, if only temporary.
Indeed, yields can only diverge from fundamentals for so long.
Another would be the dollar. Like yields, the dollar too looks in need of a pullback or at the very least a consolidation of the recent gains.
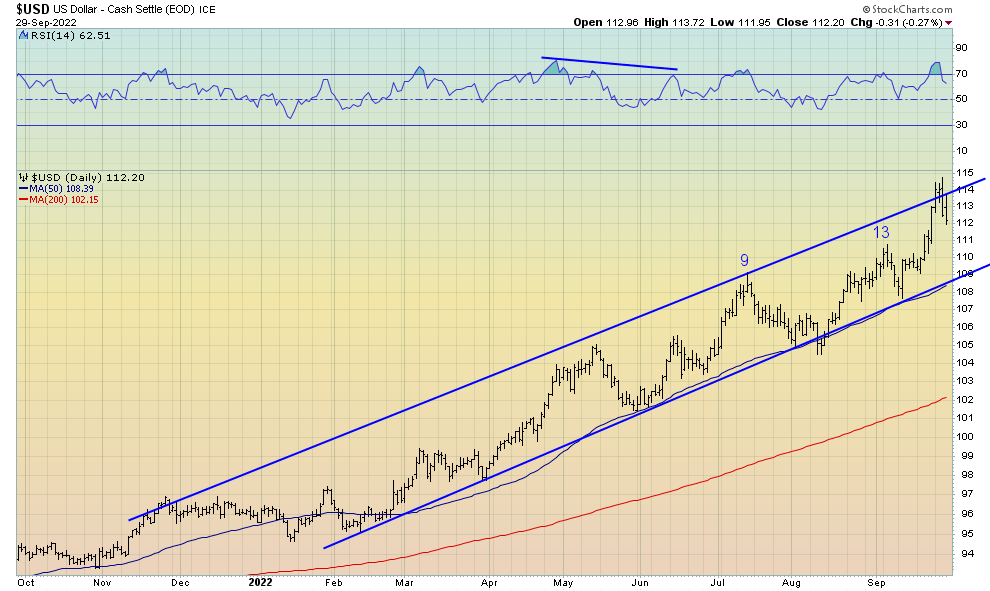
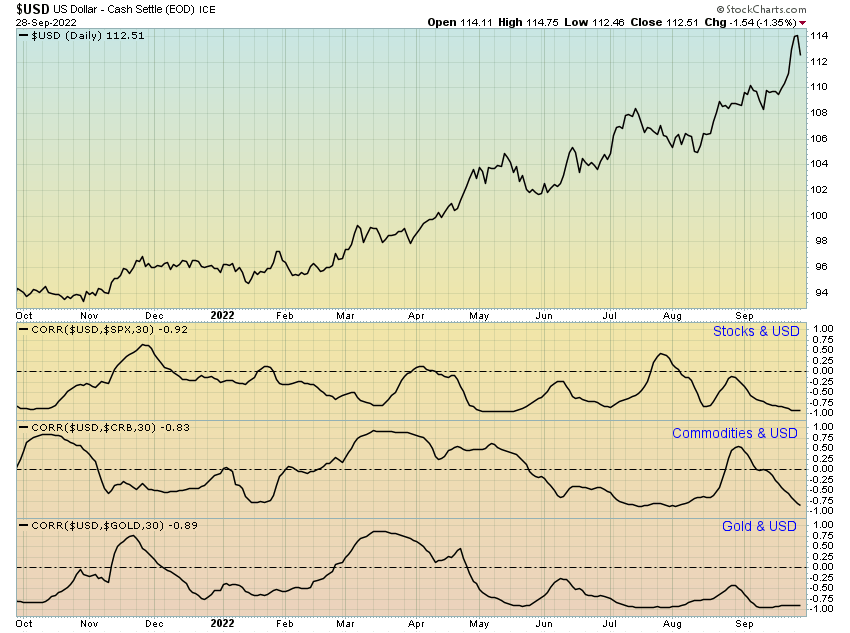
Though I expect continued strength and any correction to be short lived for now, given how negatively correlated almost all asset classes have been to the dollar in recent months, a correction would certainly provide some relief not only to stocks but precious metals and commodities also.
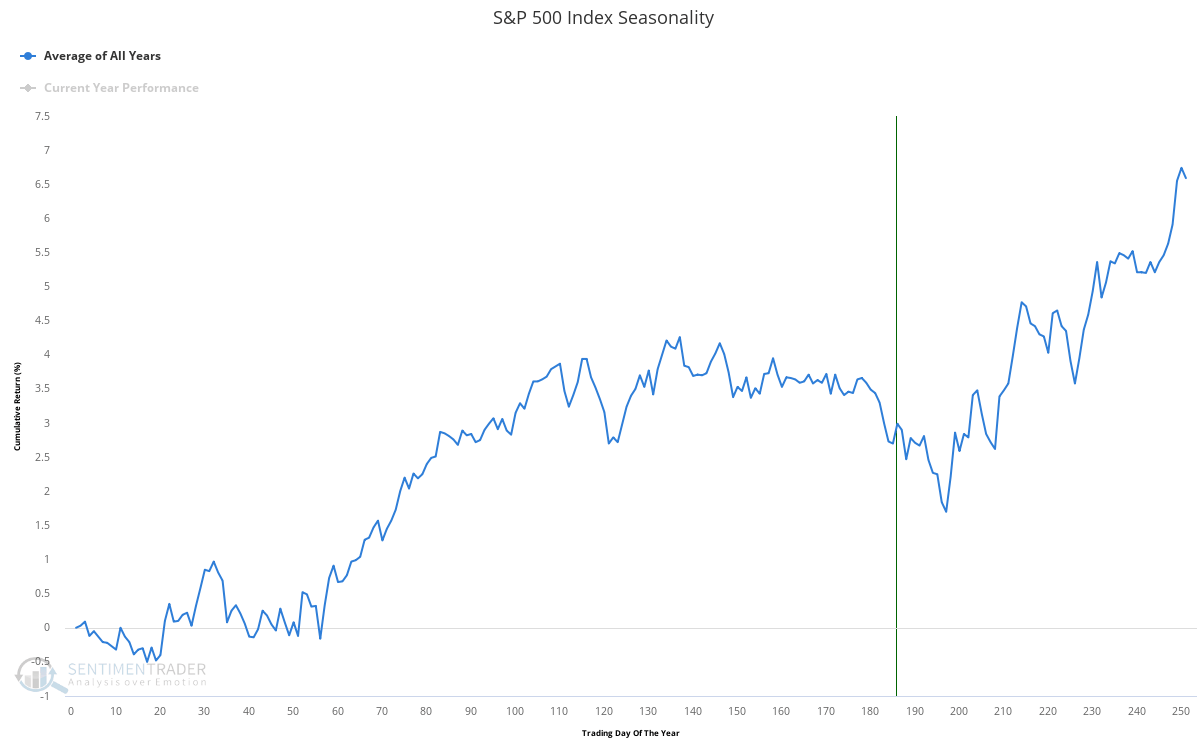
However, it is important to consider a couple of non-fundamental headwinds facing stocks in the coming weeks that fly in the face of what I have opined here. Firstly, the next 10 or so trading days tend to be one of the worst periods for stocks on a seasonal basis, as we can see below. Though seasonality should only form a small part of one’s trading decisions, it does matter and is a noteworthy consideration.
And secondly, the rolling of JP Morgan’s equity hedge is set to take place at the end of the month, which according to Tier1 Alpha should see a $12b sale of equity futures this Friday. So, it may be that we go lower before we go higher (if at all).
Editor’s Note: The summary bullets for this article were chosen by Seeking Alpha editors.
Be the first to comment