

DariaRen
File this under “You Don’t See This Very Often.”
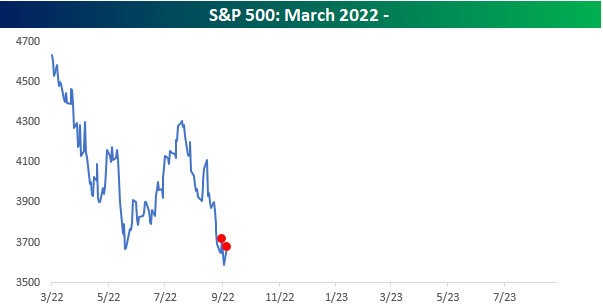
Equities surged over 2% yesterday reversing a recent trend of relentless declines since late August. It wasn’t just equities that rallied though. Everything did. Crude oil gushed more than 4.5% and even Treasuries caught a bid as prices at the long end of the curve jumped 1.5%. Taken by themselves, yesterday’s moves in all three asset classes were large but hardly out of the norm. It was the 29th time this year that the S&P 500 rallied 1.5% or more in a single day, the 66th time that crude oil advanced at least 1.5%, and the long-bond future has now rallied more than 1.5% six different times this year.
Again, nothing to raise eyebrows at.
What was unique about yesterday, or at least used to be considered unique, was the fact that all three asset classes rallied 1.5%+ on the same day. All three asset classes tend to rally for different reasons, so what’s good for one isn’t always good for the others. Therefore, it’s very uncommon to see them all rally like that on the same day. It’s so uncommon, in fact, that since the late 1970s, it has only happened four other times, and one of them was last week on 9/28! The three other occurrences were on 10/7/88, 9/16/97, and 11/4/08.
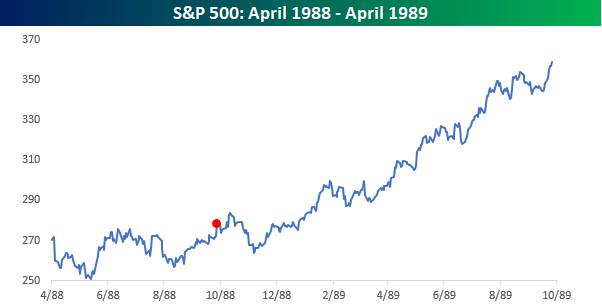
Below we have included charts of the S&P 500 in the six months before and one year after each of the three prior occurrences. Again, these are the three times prior to last week that the S&P 500, the long bond, and crude oil all rallied more than 1.5% on the same day.
Back in October 1988, markets were concerned about Fed rate hikes and a weaker than expected non-farm payrolls report along with a downward revision to readings from prior months. These were the catalysts for the move as economic growth was still strong but at a pace that was not as strong as anticipated, which raised hopes that the FOMC would not have to be as aggressive in hiking rates. While the S&P 500 experienced a pullback of about 7% shortly after the one-day rally, the longer-term uptrend remained intact, and the S&P 500 was up more than 25% over the course of the next 12 months.
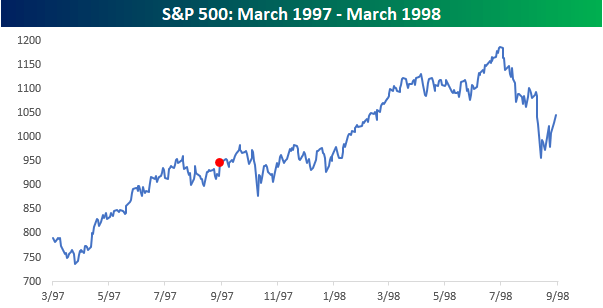
The move in September 1997 came right before the downturn from the Asia Financial Crisis and was spurred on by a weaker-than-expected CPI report. The S&P 500 was in the middle of a sideways range at the time of the simultaneous rallies and it remained there for the next three months. Over the next 12 months, the S&P 500 was up over 10% after rallying as much as 25%.
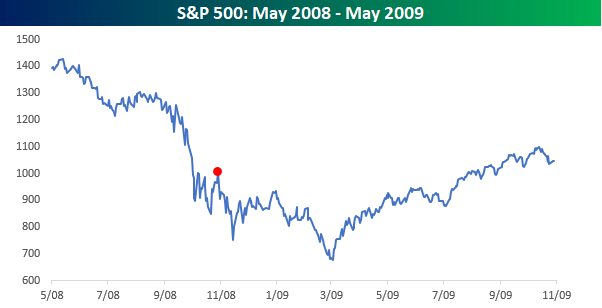
The third prior occurrence in early November 2008 capped off a six-trading day 19% rally in the S&P 500, and the index was back at new lows by the end of the month. The move came on Election Day, but polls had already shown a clear path to victory for Obama, so it wasn’t anything election specific that caused the move. More likely, the rally followed what had essentially been a waterfall decline where everything declined and declined sharply. From that close to the ultimate trough in March 2009, the S&P 500 lost a third of its value before finally bottoming, but one year later, the S&P still managed to gain just over 4% in total.
Again, the current period is unique relative to the prior three since we’ve seen it happen twice within the same week! Like the period in 2008, yesterday’s move followed a period in the market where everything was declining. Unlike the 2008 occurrence, though, both moves came the day after the S&P 500 closed at a 52-week low rather than just late in a near 20% rally in the S&P 500. Like the first two occurrences in 1988 and 1997, although the market isn’t in an uptrend this time around, the move was spurred on by weaker economic data, raising hopes that the FOMC would take a less hawkish approach to monetary policy.
While there isn’t a clear common link between the current period and the prior three, moves like yesterday where stocks, bonds, and crude oil all rallied sharply (1.5%+) have been extremely uncommon over the last 45 years.
Editor’s Note: The summary bullets for this article were chosen by Seeking Alpha editors.
Be the first to comment