

Bet_Noire
2022 has been a year marked by volatility for markets. At the heart of this market volatility is inflation uncertainty, which results in policy uncertainty. The U.S. Federal Reserve (“Fed”), once the leader of “team transitory” is shifting its strategy. Heading into the second half of the year, the path of rate policy will have great implications for market returns, recession risk, long-run inflation, and the durability of the 60/40 portfolio.
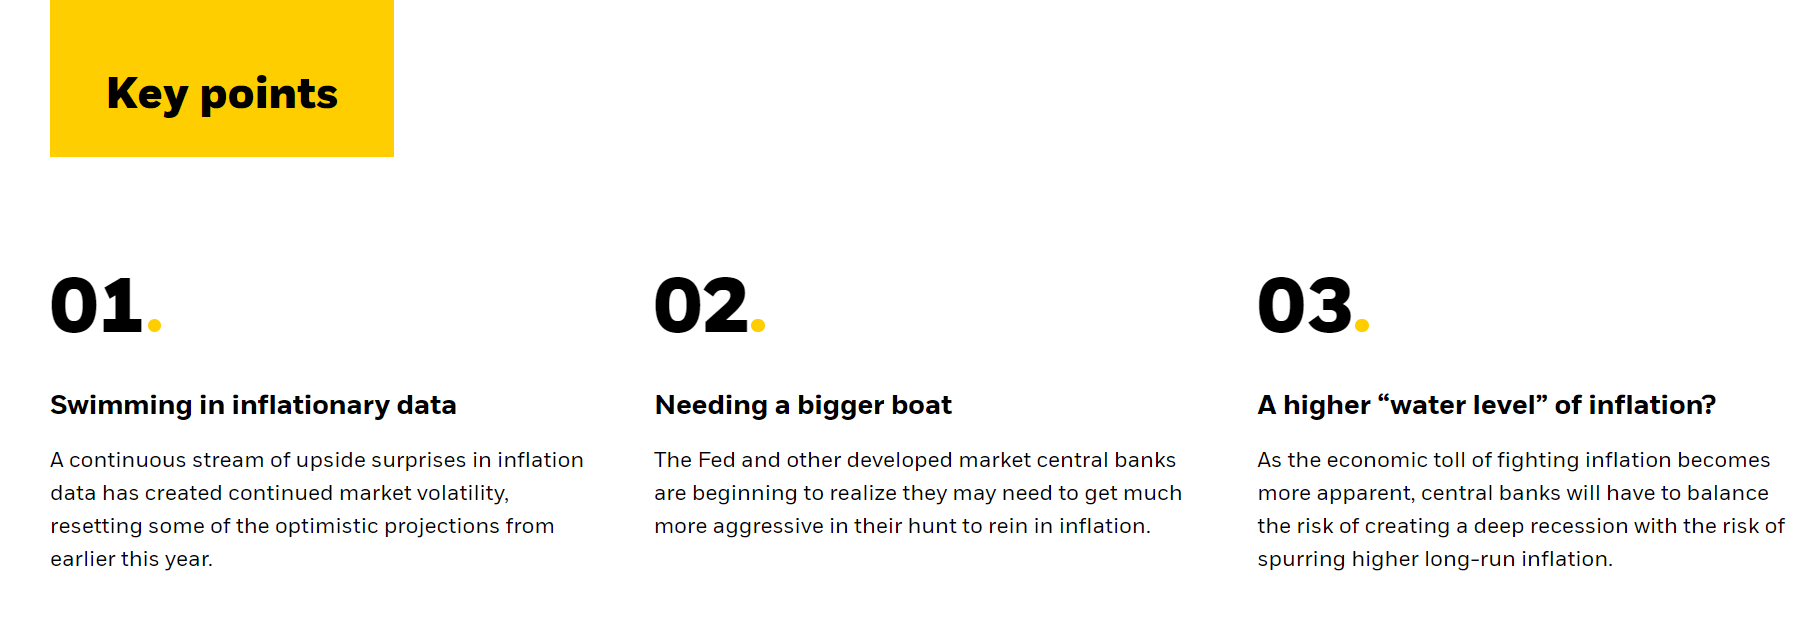
Swimming In Inflationary Data
Throughout 2022, markets have been awash in inflationary data. The surprisingly strong May Consumer Price Index (“CPI”) print pushed markets significantly lower as they now expect significantly increased monetary policy tightening from the Fed. In the subsequent June Federal Open Market Committee (“FOMC”) meeting, the Fed validated those concerns by cementing its move away from “team transitory” towards “team tightening.” This marks a significant departure from how we have characterized the central bank’s approach following the retirement of “transitory.” That approach we colloquially dubbed “the immaculate disinflation” as the Fed previously forecasted a smooth and steady return of inflation to its pre-COVID 2% level, but with miraculously no impact on economic growth or unemployment.
Now, the Fed begins a new chapter in setting policy and providing forward guidance to markets. The recognition that inflation won’t decline on its own without significant demand destruction implies policy will need to move beyond “neutral” into restrictive territory. Historically, that means policy rates need to end up above the rate of inflation. But if inflation doesn’t ease and do a lot of the work for the Fed, rates will have to pick up the slack. The June FOMC projections move the Fed towards acknowledging this reality. If their prior forecasts were best described as “magical thinking” the latest might be described as “magical realism.” Figure 1 highlights this shift. In March, they believed there would be virtually no impact to unemployment as they fight off inflation.
Figure 1: From “magical thinking” to “magical realism”
U.S. Federal Reserve Summary of Economic Projections
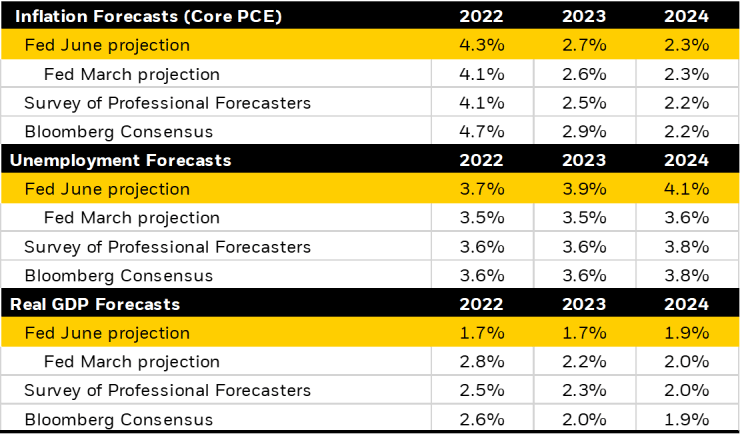
Source: U.S. Federal Open Market Committee, as of June 15, 2022.
While the June forecast has a tinge of reality, a lot of underlying magic remains. They still expect to get inflation under control while only seeing small increases in unemployment.
Why the shift in storyline? The May CPI upside surprise, along with the University of Michigan longer-run inflation expectations breaking higher, altered the Fed’s narrative. The transitory supply side arguments for anticipating declining inflation took a blow as the data highlights the broadening of inflation and a shift from the goods to services sector (Figure 2).
Figure 2: Inflation shifting from goods to services sector
Goods versus services inflation
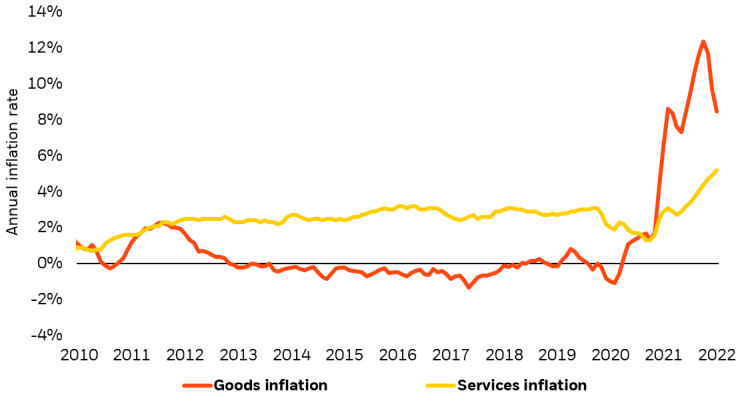
Source: U.S. Bureau of Labor Statistics, as of May 2022.
Similarly, peak inflation expectations increased as many critical areas unrelated to supply side bottlenecks showed acceleration (Figure 3). The cost of shelter, medical care, and recreation are all elevated. Alongside them, wages are increasing, adding a strong current to this pro-inflationary stream of data.
Figure 3: From transitory to entrenched?
Annualized growth rates in persistent areas of inflation
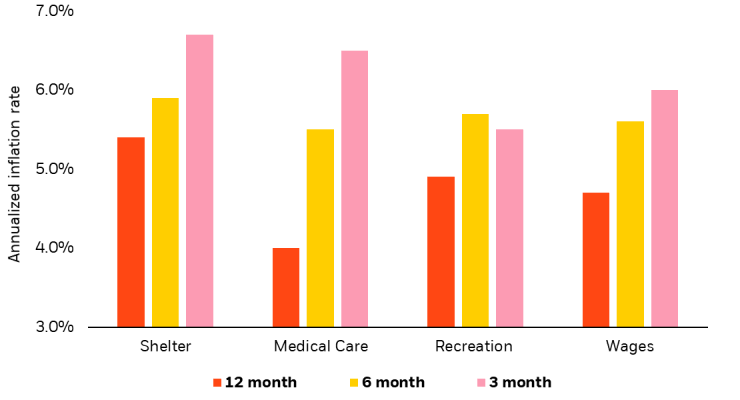
Source: U.S. Federal Reserve Banks of St. Louis and Atlanta, as of May 2022.
Needing A Bigger Boat
The market’s response to these inflationary currents is similar to previous surprises—the expectation of a faster pace of Fed tightening near the neutral rate of 3.5% by the end of 2022. Once again, there appears to be confidence that the faster pace will successfully rein in inflation. The market also prices a relatively soft-landing scenario with the hikes resulting in rates being slightly too tight and then the Fed gently easing back towards neutral.
Rather than viewing this as the base case, we view it as the best-case scenario. The surprising May CPI report and increases in inflation expectations have forced the Fed to pull the path towards neutral forward and consider becoming “slightly restrictive.”
Figure 4 highlights the Fed’s realization that it is going to need a bigger boat to hunt inflation, although only slightly bigger… for now.
Looking at the righthand portion of Figure 4 shows the market expectations for Fed policy rates in 1 year and 2 years’ time. After the June FOMC meeting, we see a rapid repricing in the level of tightening that the market thinks the Fed will deliver—the rate hikes come sooner. But the 2 years ahead metric shows that they continue to think the Fed will be successful at reining in inflation quickly. The 2-years ahead policy rate is currently below the 1-year ahead rate—implying the Fed will be cutting interest rates in 2024. This highlights the market consensus expects the inflation rate to drop in part due to over-tightening, and therefore the Fed will then decide to back off and cut rates. Whether or not that becomes reality remains to be seen.
Figure 4: We are going to need a bigger boat
U.S. Federal Reserve implied policy rates (1 & 2 yrs ahead)
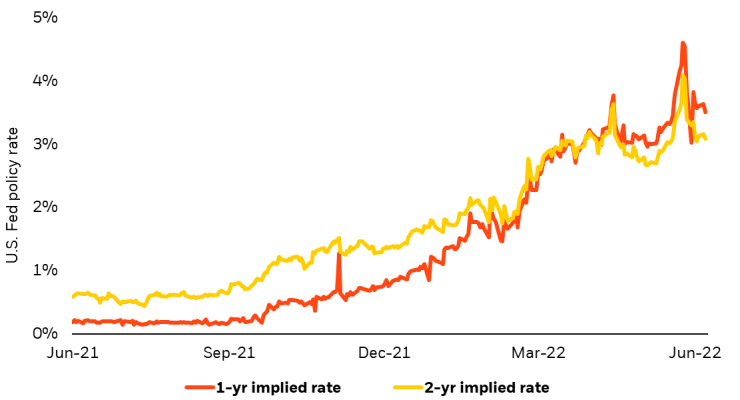
Source: Bloomberg, as of June 30, 2022.
A key lesson from the recent market volatility is consensus expectations have been proven overly optimistic and wrong many times over. The Fed needs a much bigger boat if it plans to get >8.0% inflation under control in that amount of time.
Maybe a fleet
Globally, a fleet of developed market central banks are now aligning to fighting inflation, creating a rising tide of hawkish monetary policy. Rates around the world continue to shift higher with the European Central Bank’s (“ECB”) responding with a historic first increase in rates in over a decade. The ECB faces a more complex policy environment than the U.S. The ECB has to both fight inflation through hiking rates and at the same time limit fragmentation of policy across the Eurozone. Tighter policy leads to segmentation, which creates yield differences at the individual country level depending on their specific sovereign risk and domestic dynamics. If ultra-low rates and unlimited liquidity support were a winning formula for all countries that reduced fragmentation, higher rates and less support could do the opposite, creating more disparities.
The ECB’s move towards the creation of an explicit “anti-fragmentation” tool in the context of the current tightening phase highlights the challenges of normalizing policy to ward off inflation without exacerbating the unwanted side effect of greater fragmentation. The initial result of tightening is a notable widening in intra-European bond spreads (Figure 5). They are now approaching the wides of the 2020 COVID levels and are about halfway to the extremes of the 2010-2012 Eurozone Sovereign Debt Crisis. These market moves have prompted the ECB to start developing an explicit anti-fragmentation tool which has resulted in spread retightening since the announcement.
Figure 5: Growing fragmentation in Europe
Eurozone key rate and Italy vs. Germany 10-year bond spreads
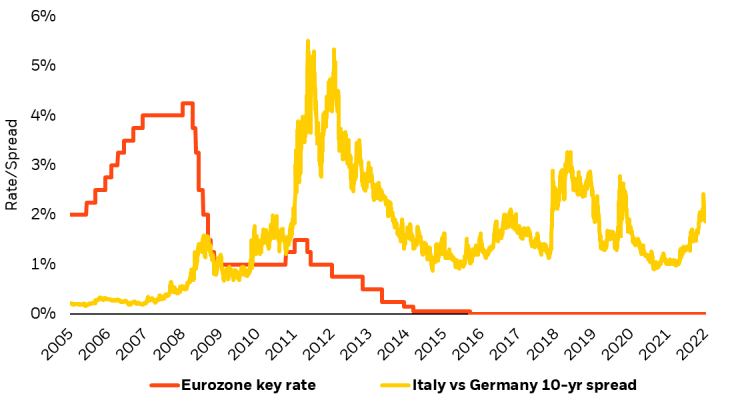
Source: Bloomberg, as of June 30, 2022.
The global fight against inflation is missing one major player: the Bank of Japan (“BOJ”). There we see a notable outlier as a result of their Yield Curve Control policy—the 10-year bond is stubbornly below the 0.25% target. With much lower rates than the rest of the world, pressure is increasing on its currency with the Yen down ~20% this year. A troubled currency and a simmering inflation outlook, means the BOJ may need to adjust course soon. All told, a hawkish shift in Japan could create significant steepening in global interest rate term premia.
A Higher “Water Level” Of Inflation?
Stronger than expected inflation data highlights the risk to the consensus market and central bank viewpoint that only modestly restrictive policy with a modest impact of slowing demand will be enough to slow inflation and return it to its pre-COVID 2% levels.
However, increases in inflation in its more persistent forms—like shelter, medical services, and wages—suggest alternative, less idyllic conditions need to be considered. Though many possible scenarios exist, we highlight two key considerations for the path of the Fed (Figure 6). The first is more inflation surprises forcing the Fed to hike rates more significantly in order to curtail consumer demand and ease inflation pressures before they become more entrenched. The second scenario calls for a more accommodative Fed. One who accepts higher, yet slowing, inflation and engages in less policy tightening. The primary goal being to avert a near-term recession, but at the potential risk of a creating an environment with a higher “water level” of inflation.
The knee jerk reaction of a flattening yield curve after each inflation report surprising on the upside implies markets are more worried about the former than the latter. However, the risk of longer-run inflation outcomes is possible, especially once we start to see a more significant policy trade-off for raising interest rates. It is easy to raise rates by 75 basis points in a single meeting when inflation is raging out of control and the job market is still white hot. Less robust jobs reports or even rises in unemployment will force the Fed to reassess its priorities.
Figure 6: A risk for a higher “water level” of long-run inflation?
Potential outcomes by Fed policy strategy
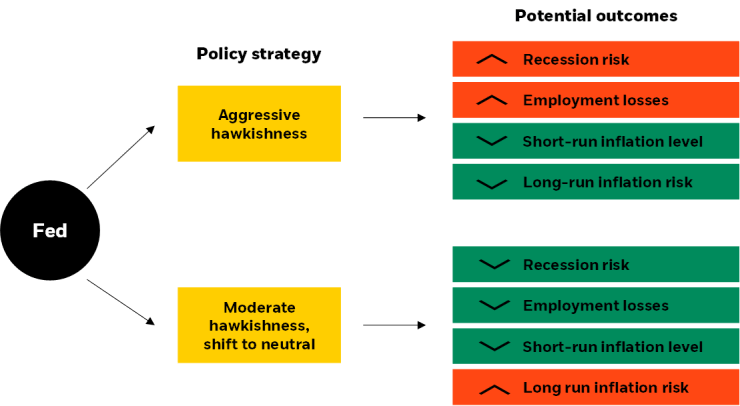
Source: BlackRock. Hypothetical scenario analysis based on the views of the BlackRock Systematic Fixed Income team as of July 2022.
They will be in a very different position when inflation shows a downward trend at the same time the labor market is cooling. Such an outcome later this year may make it harder to predict the Fed’s path. One course may favor an “unconditional” inflation fight, as is the current guidance. The other route may balance inflation fighting with supporting the economy. This more dovish Fed scenario seeks to avoid recession, but at the potential cost of failing to rein in long-term inflation.
Which way the Fed chooses will hold significance for how interest rates behave along the yield curve. Current market expectations imply an eventual recession will lead to future Fed cuts, resulting in a very flat yield curve. A more accommodative Fed that limits recession fears but risks higher inflation in the long run, may result in a steeper yield curve.
For the first time in decades, we will learn just how tolerant central bankers will be of inflation as it now comes at the cost of higher unemployment and lower economic growth. This all creates a level of inflation and policy uncertainty that is likely to translate into continued volatility in both stock and bond markets.
A Key Vulnerability Of The “Diversified” 60/40 Portfolio
Typically, when growth assets, like stocks, sell off due to economic slowdowns, safer assets, like bonds, appreciate as investors seek stability. While stocks tend to suffer in a recession due to less economic growth, bonds can rally because the U.S. Federal Reserve typically cuts interest rates to support the economy. When interest rates are cut, bond yields drop but bond prices go up. This provides a shock absorber in the portfolio, helping to cushion overall returns when stocks are falling. This stock-bond balancing act has been the foundation of “diversified” 60/40 portfolios for decades. However, a higher level of inflation means that the Fed has much less flexibility to come to the rescue of equity markets by lowering rates – effectively making the “Fed put” go kaput.
What we can learn from 1969
Based on history, declines in both stocks and bonds are truly rare. Figure 7 illustrates the historical calendar year return history of U.S. stock and bond investments going back to 1929. 2022 so far stands as the worst year on record for bonds which leads to the second worst year of combined stock and bond performance in nearly a century.
Figure 7: When bonds DON’T go up when stock go down
Annual U.S. stock vs. bond returns (1929-2022)
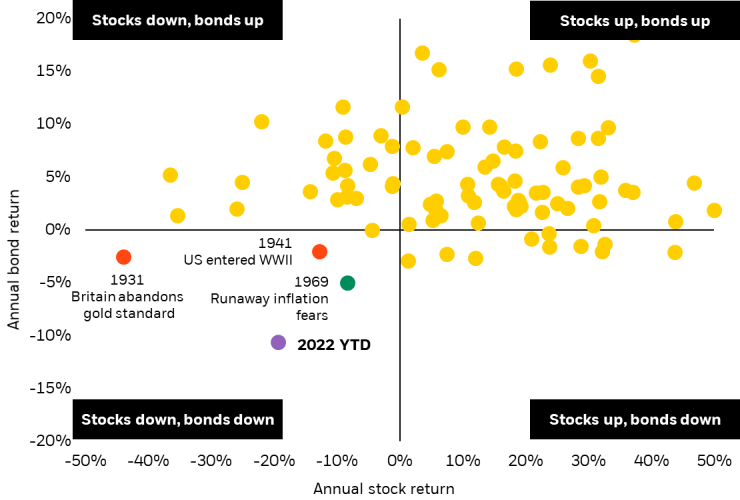
Source: Bloomberg, as of June 30, 2022. Notes: The return of bonds are based on the annual return of Bloomberg U.S. Aggregate Bond Index from 1976 to 2022. Prior to 1976, the returns are based on the 10-year U.S. Treasury Bond. Stocks are represented by the S&P 500 Index from 1957 to 2022. Prior to 1957, the returns are based on the price changes in the S&P Composite Index. Index performance shown for illustrative purposes only. You cannot invest into an index. Past performance is no guarantee of future results.
For traditional 60/40 portfolio investors, this troubling combination has left them no place to hide. Going back to 1929, there have only been 3 years where bonds didn’t go up when stocks went down. Outside of 1931 when Britain abandoned the gold standard (leading to falling stocks but rising interest rates to defend the currency) and 1941 when the U.S. entered World War II (leading to rising inflation and falling stocks), 1969 had stood as the exception that proved the rule for reliable stock-bond diversification.
The reasons for losses in that period mirror today, with rapidly rising inflation unleashing a Fed tightening cycle that eventually resulted in recession. That period illustrated that bonds provide a great diversifier to stocks unless stocks are falling due to concerns over inflation.
The breakdown in stock-bond correlation and the consumption-inflation link
Looking at markets on a more frequent basis, the past 20 years have witnessed a remarkable negative correlation of stock and bond returns even in daily terms. Figure 8 highlights the rolling three-month correlation of daily stock and bond returns since 1970. From 1970 to 2000, the correlation of daily stock and bond returns averaged around positive 30%, from 2000 onwards, a negative 30%.
Figure 8: Stock-bond correlation shifting into positive territory
Rolling 3-month correlation of U.S. stocks and bonds
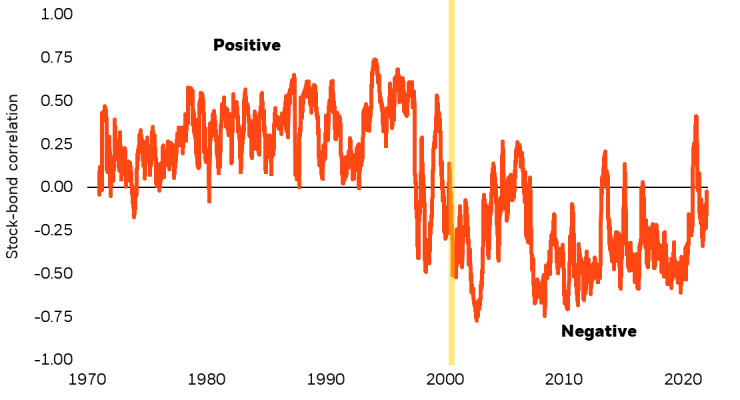
Source: Bloomberg, as of June 30, 2022.
In 2022 however, we have seen the average daily stock-bond correlation rise towards zero, reflecting several significant periods when both stocks and bonds were falling at the same time. Such a change in stock-bond correlation reflects a deeper more fundamental change in the relationship of the economy, consumption, and confidence to inflation.
As we have clearly seen this year, rising inflation is perceived as too high, sapping the purchasing power of consumers, leading to collapsing confidence and a negative outlook for the economy. Rising input costs for producers are pressuring margins, but also leading to the ability to pass on price increases for the first time in a generation. This contributes to the potential for a wage-price spiral which is the basis for some of the more concerning long-term views on inflation.
The outlook for consumption, and by extension the outlook for the broader economy, is now negatively related to increases in inflation. This leads to a change in the relationship between stocks and bonds.
Periods of rising inflation are now not only bad for bonds (as they typically are) but are now bad for stocks (as inflation undermines confidence, spending and growth). Beyond top-level growth, inflation can also potentially hurt company profit margins, creating an additional element of uncertainty for stocks.
Figure 9 captures the relationship between consumption and inflation throughout history. Like the stock-bond correlation in Figure 7, the relationship between consumption and inflation shows a structural break around the 2000 period. Prior to this period, inflation and consumption averaged a negative 30% correlation—notably similar to the negative relationship we are witnessing today where rising inflation leads to declining consumption.
Figure 9: Inflation may now harm growth
Long-term correlation of consumption and inflation
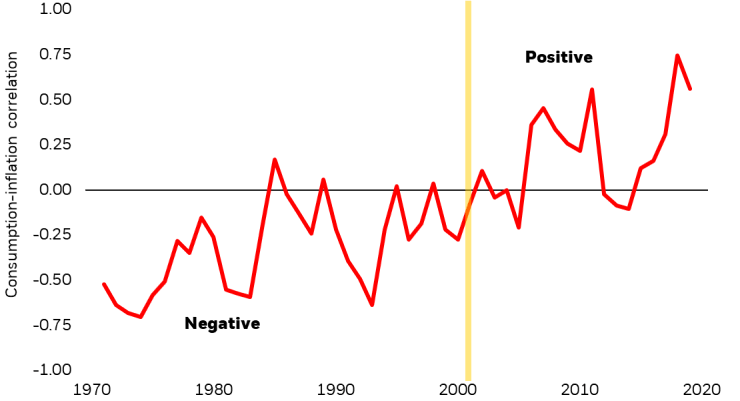
Source: Federal Reserve Bank of St. Louis, as of June 2022. Calculations based on those presented in NBER working paper No. 27861 “Stock-bond return correlation, bond risk premium fundamental, and fiscal-monetary policy regime” September 2020.
However, the period after 2000 showed a structural change that was marked by a low level of inflation and even fears of deflation. In this post-2000 period, modestly rising inflation was seen as a positive, which could translate to stronger consumption and growth, and by extension, better stock returns. The period reflected an environment with positive consumption-inflation correlation of about 15% on average. This meant that declining inflation was bad for stocks, but good for bonds and vice versa. In other words, negative stock-bond correlation.
Implications for investors
The key portfolio implication is that until we see a return to a positive consumption-inflation relationship, we may not see the return of a reliable form of negative stock-bond correlation. It was this negative correlation that made bonds an effective portfolio diversifier and acted as the foundation of the traditional 60/40 investment framework.
Conclusion
The direction of inflation is the number one issue driving markets today. As long as it remains unclear if central banks are succeeding at reeling in inflation, we will have an environment where stock markets and bonds markets have the potential to move down together. The reliability of the diversifying properties of bonds is going to be an open question during this time. While this period could be as short as a few quarters, it could also be a more prolonged environment.
If we appear to be winning the inflation battle later this year, will the Fed stop raising rates to avoid further destruction of employment and growth? Will they mistakenly stop too early or just tolerate higher inflation? This scenario has the potential for a longer period of inflation uncertainty, and it is that uncertainty that will continue to drive volatility in markets. In the meantime, it looks like central banks are going to need a much bigger boat in the fight against inflation.
© 2022 BlackRock, Inc. All rights reserved.
This material is prepared by BlackRock and is not intended to be relied upon as a forecast, research or investment advice, and is not a recommendation, offer or solicitation to buy or sell any securities or to adopt any investment strategy. The opinions expressed are as of July 2022 and may change as subsequent conditions vary. The information and opinions contained in this material are derived from proprietary and nonproprietary sources deemed by BlackRock to be reliable, are not necessarily all-inclusive and are not guaranteed as to accuracy. As such, no warranty of accuracy or reliability is given and no responsibility arising in any other way for errors and omissions (including responsibility to any person by reason of negligence) is accepted by BlackRock, its officers, employees or agents.
This material may contain “forward-looking” information that is not purely historical in nature. Such information may include, among other things, projections and forecasts. There is no guarantee that any of these views will come to pass. Reliance upon information in this material is at the sole discretion of the reader. This material is intended for information purposes only and does not constitute investment advice or an offer or solicitation to purchase or sell in any securities, BlackRock funds or any investment strategy nor shall any securities be offered or sold to any person in any jurisdiction in which an offer, solicitation, purchase or sale would be unlawful under the securities laws of such jurisdiction.
Stock and bond values fluctuate in price so the value of your investment can go down depending upon market conditions. The two main risks related to fixed income investing are interest rate risk and credit risk. Typically, when interest rates rise, there is a corresponding decline in the market value of bonds. Credit risk refers to the possibility that the issuer of the bond will not be able to make principal and interest payments. The principal on mortgage- or asset-backed securities may be prepaid at any time, which will reduce the yield and market value of these securities. Obligations of US Government agencies and authorities are supported by varying degrees of credit but generally are not backed by the full faith and credit of the US Government. Investments in non-investment-grade debt securities (“high-yield bonds” or “junk bonds”) may be subject to greater market fluctuations and risk of default or loss of income and principal than securities in higher rating categories. Income from municipal bonds may be subject to state and local taxes and at times the alternative minimum tax.
Index performance is shown for illustrative purposes only. Indexes are unmanaged and one cannot invest directly in an index.
Investing involves risk, including possible loss of principal.
Prepared by BlackRock Investments, LLC, member FINRA.
©2022 BlackRock, Inc. BLACKROCK, BLACKROCK SOLUTIONS, BUILD ON BLACKROCK, ALADDIN, iSHARES, iBONDS, FACTORSELECT, iTHINKING, iSHARES CONNECT, FUND FRENZY, LIFEPATH, SO WHAT DO I DO WITH MY MONEY, INVESTING FOR A NEW WORLD, BUILT FOR THESE TIMES, the iShares Core Graphic, CoRI and the CoRI logo are trademarks of BlackRock, Inc., or its subsidiaries in the United States and elsewhere. All other marks are the property of their respective owners.
USRRMH0722U/S-2271951
This post originally appeared on the iShares Market Insights.
Editor’s Note: The summary bullets for this article were chosen by Seeking Alpha editors.
Be the first to comment