

peshkov
The market went straight up for four weeks, an impressive 17.5% off the June 16th low.
Ycharts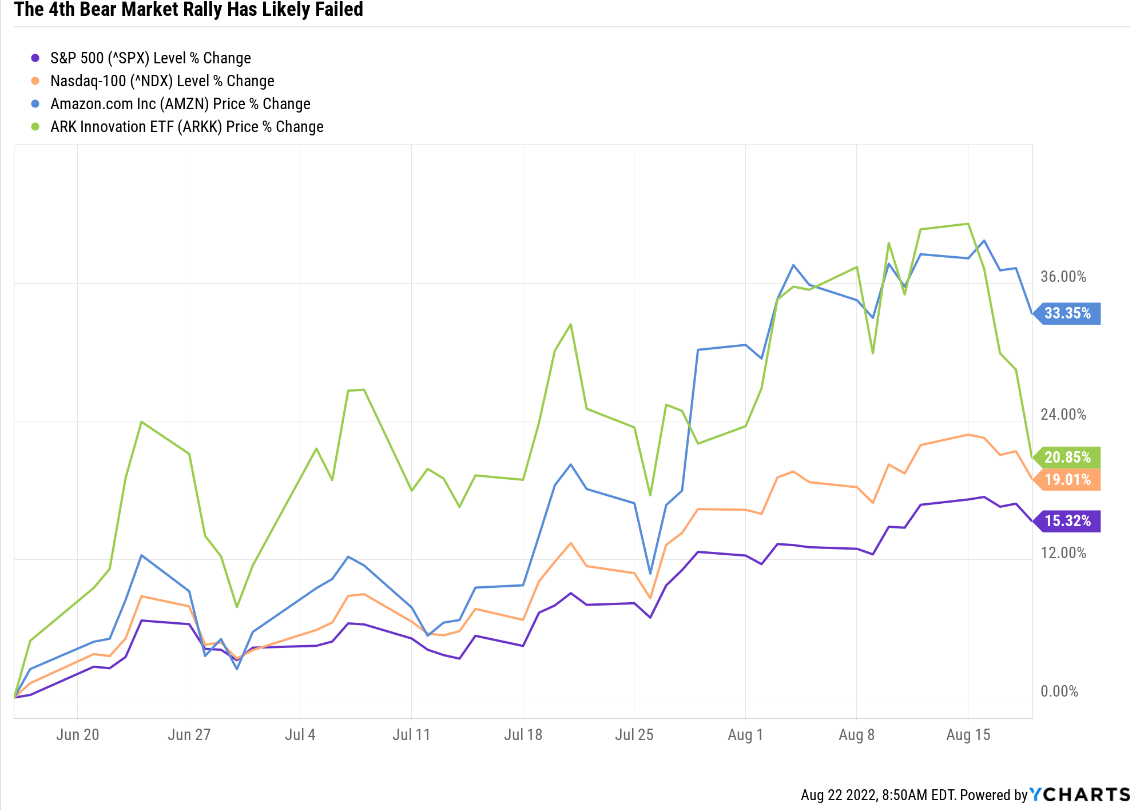
But stocks have likely started falling again, which should not be a surprise. I have warned readers for weeks now that this was likely a bear market rally. The 17.5% size of the rally might have lulled some into complacency but was historically normal.
Daily Shot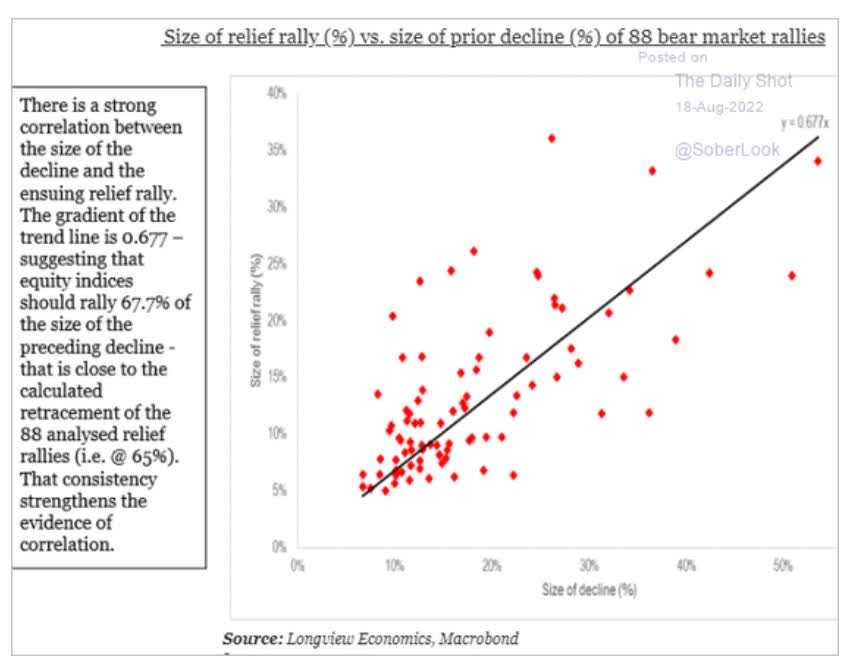
Historically, the last 88 bear market rallies average a 68% retracement of the decline.
- From a 24% peak decline, a 16.3% rally is historically expected
So what’s coming next for the market? History is merely a guide to what might happen, not what will happen, but here’s what history and today’s economic data says is potentially coming.
Daily Shot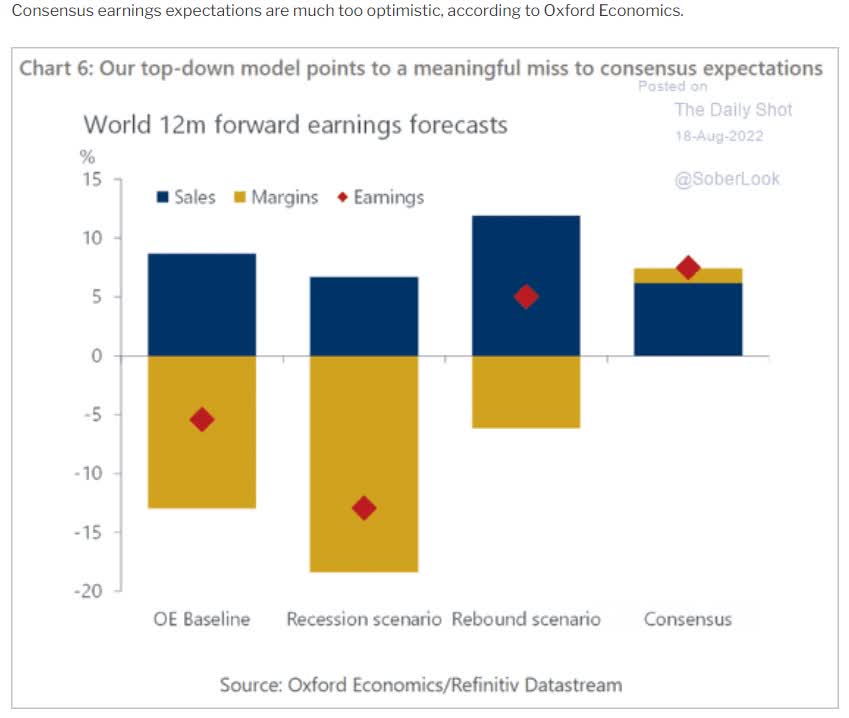
In terms of earnings, expect estimates to keep falling as they have for weeks. Oxford economists’ base-case is that earnings fall 5% and 13% if we get a recession in 2023.
- 13% is the average and median EPS decline in recessions for the S&P 500 since WWII
The historical trough PE bottom range for bear markets (outside of the Great Recession) is 13X to 15X.
So if we apply Oxford’s earnings estimates (which agree with the blue-chip consensus), we could expect the true market bottom:
- 3,075 to 3,550 on the S&P 500 if we avoid a recession (likely closer to the upper end of that range)
- 2,816 to 3,250 if we have a recession in 2023 (80% probability according to the bond market)
- 16% to 27% decline from here if we avoid recession (closer to 16% more likely)
- 26% to 37% peak decline in S&P 500 if we avoid recession (26% more likely)
- if we get a recession in 2023, then a 23% to 37% further decline is historically likely.
- 33% to 42% total peak decline for the S&P 500 if we get a recession
- The historical base case: 13% EPS decline and 14X trough PE would mean a 3,033 historical bottom on the S&P, a 28% further decline, and a peak decline of 37%
| Time Frame | Historically Average Bear Market Bottom |
| Non-Recessionary Bear Markets Since 1965 | -21% (Achieved May 20th) |
| Median Recessionary Bear Market Since WWII | -24% (Citigroup base case with a mild recession) June 16th |
| Non-Recessionary Bear Markets Since 1928 | -26% (Goldman Sachs base case with a mild recession) |
| Average Bear Markets Since WWII | -30% (Morgan Stanley base case, no recession) |
| Recessionary Bear Markets Since 1965 | -36% (Bank of America recessionary base case) |
| All 140 Bear Markets Since 1792 | -37% |
| Average Recessionary Bear Market Since 1928 |
-40% (Deutsche Bank, Bridgewater, SocGen Severe Recessionary base case, Morgan Stanley Recessionary Base Case) |
|
(Sources: Ben Carlson, Bank of America, Oxford Economics, Goldman Sachs) |
About -37% on the market in a recessionary bear market is also the base-case from most blue-chip economists, the most accurate in the world as tracked by Bloomberg.
Does this mean the market is absolutely going to crash 28% from here? No. But it is what history and fundamentals say could happen. If the market ends up hitting -37% around the historical bear market bottom forecast date of February 2023, you should not be surprised.
So is it time to go to cash and wait for the market to fall out of bed? Of course not; that kind of “all or none” market timing doesn’t work. It also means you risk the kind of incredible gains that come after the bear market finally ends.
Charlie Bilello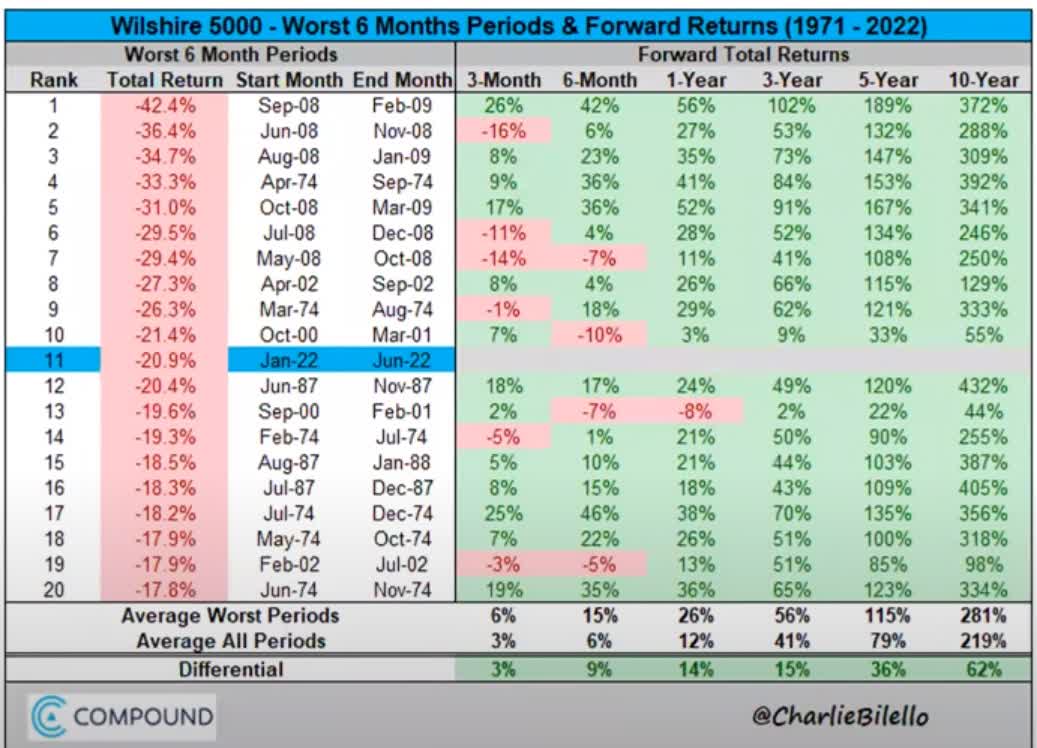
Returns like the average 3.8X 10-year gain after an 18+% six-month crash like we just had.
This is where the world’s best high-yield, low volatility blue-chips can help you stay sane, safe, and profit from the incredible bull market that is coming in the next 10 years.
- get paid to wait out the likely storm
- and likely suffer smaller declines and sleep better at night when more speculative companies are getting ravaged
What if there is no market crash in the coming months? What if we merely retest the June lows and then trade sideways? That’s certainly possible.
But the great thing about high-yield low volatility blue-chips is they tend to work great in any market crash, whether it’s in the next month or years from now in the next bear market.
How To Find The Best High-Yield Low Volatility Blue-Chips For The Next Market Crash (Whenever It Finally Arrives)… In 3 Minutes
I use the Dividend Kings Zen Research Terminal in every article to find the best blue-chips for any specific goal or need. This runs off the DK 500 Masterlist.
The DK 500 Master List is one of the world’s best watchlists, including
- every dividend aristocrat (S&P companies with 25+ year dividend growth streaks)
- every dividend champion (every company, including foreign, with 25+ year dividend growth streaks)
- every dividend king (every company with 50+ year dividend growth streaks)
- every foreign aristocrat (every company with 20+ year dividend growth streaks)
- every Ultra SWAN (wide moat aristocrats, as close to perfect quality companies as exist)
- 40 of the world’s best growth stocks
Let me show you the quick and easy screen to find the best high-yield low volatility blue-chips for the next market crash.
- Good buy, strong buy, very strong buy, ultra value buy (margin of safety sufficient for each company’s risk profile): 164 companies remain
- yield 3+% ( competitive with high-yield ETFs): 63 companies remain
- 81+% dividend safety score (2% or less risk of a cut in severe recessions): 41 companies remain
- 80+% quality score (SWAN, sleep well at night, quality): 35 companies remain
- 8+% long-term consensus total return potential (my rule of thumb for defensive stocks): 31 companies remain
- add the annual volatility column
- sort by annual volatility (15-year average)
- select the 7 lowest volatility names
- use the “build your watchlist” tab to select only those eight blue-chips
- Total Time: 3 minutes
Now we can select as many or as few of the 60 fundamental metrics as we want, sort by any of them, and see the average of each fundamental for the complete eight-company mini-portfolio.
7 High-Yield Retirement Dream Blue-Chips For The Coming Market Crash
(Source: Dividend Kings Zen Research Terminal)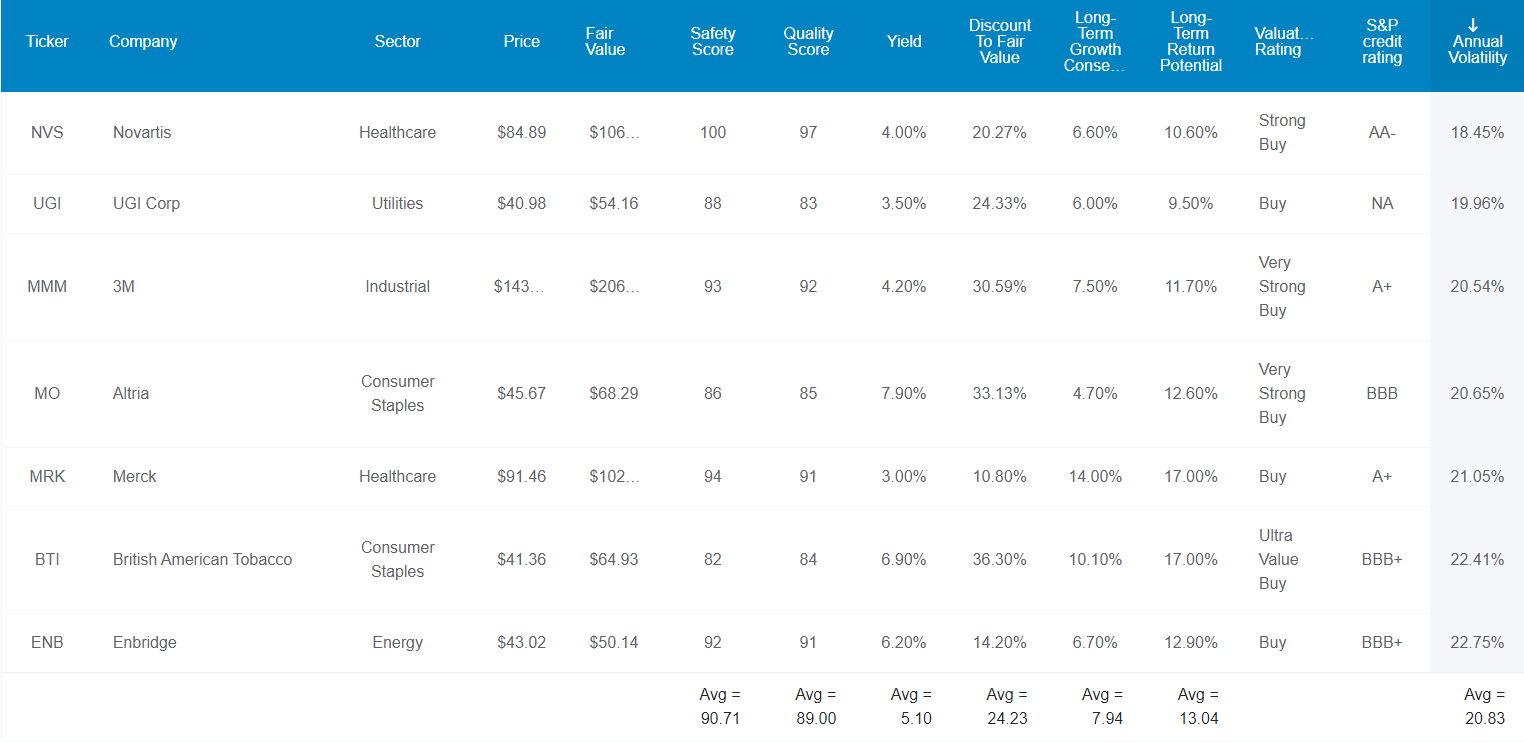
I’ve linked to articles exploring each company’s growth prospects, investment thesis, risk profile, and return potential.
Here are the seven best high-yield low volatility blue-chips you can safely buy today, in order of lowest volatility.
- Novartis (NVS)
- UGI Corp (UGI)
- 3M (MMM)
- Altria (MO)
- Merck (MRK)
- British American Tobacco (BTI)
- Enbridge (ENB)
For context:
- The average standalone company has 28% average annual volatility
- the average aristocrat 24%
These low volatility blue-chips average under 21% average volatility.
- combined, they average 13.6% volatility over the last 26 years (more on this later)
FAST Graphs Up Front
Novartis 2024 Consensus Return Potential
(Source: FAST Graphs, FactSet Research)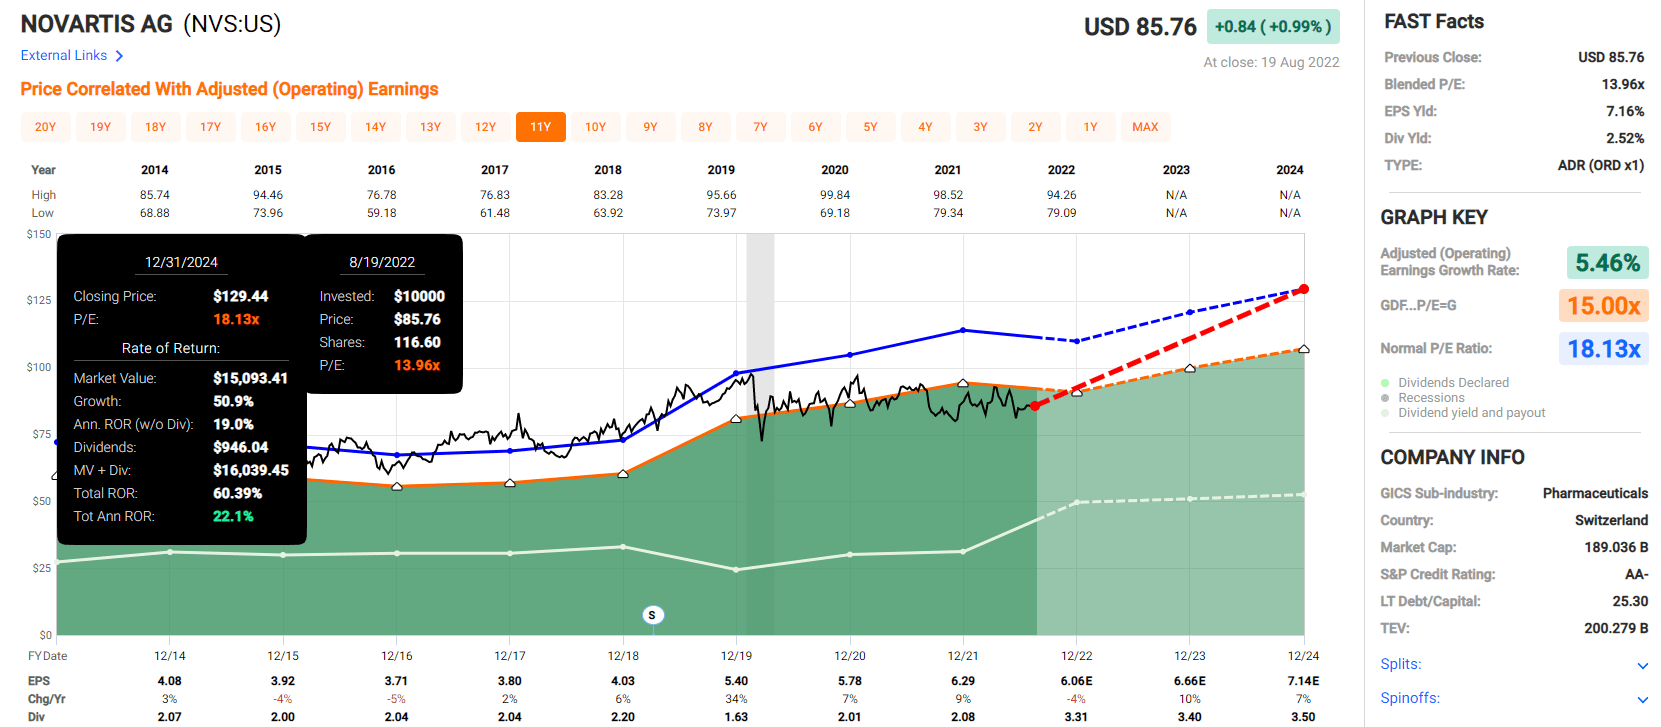
UGI Corp 2024 Consensus Return Potential
(Source: FAST Graphs, FactSet Research)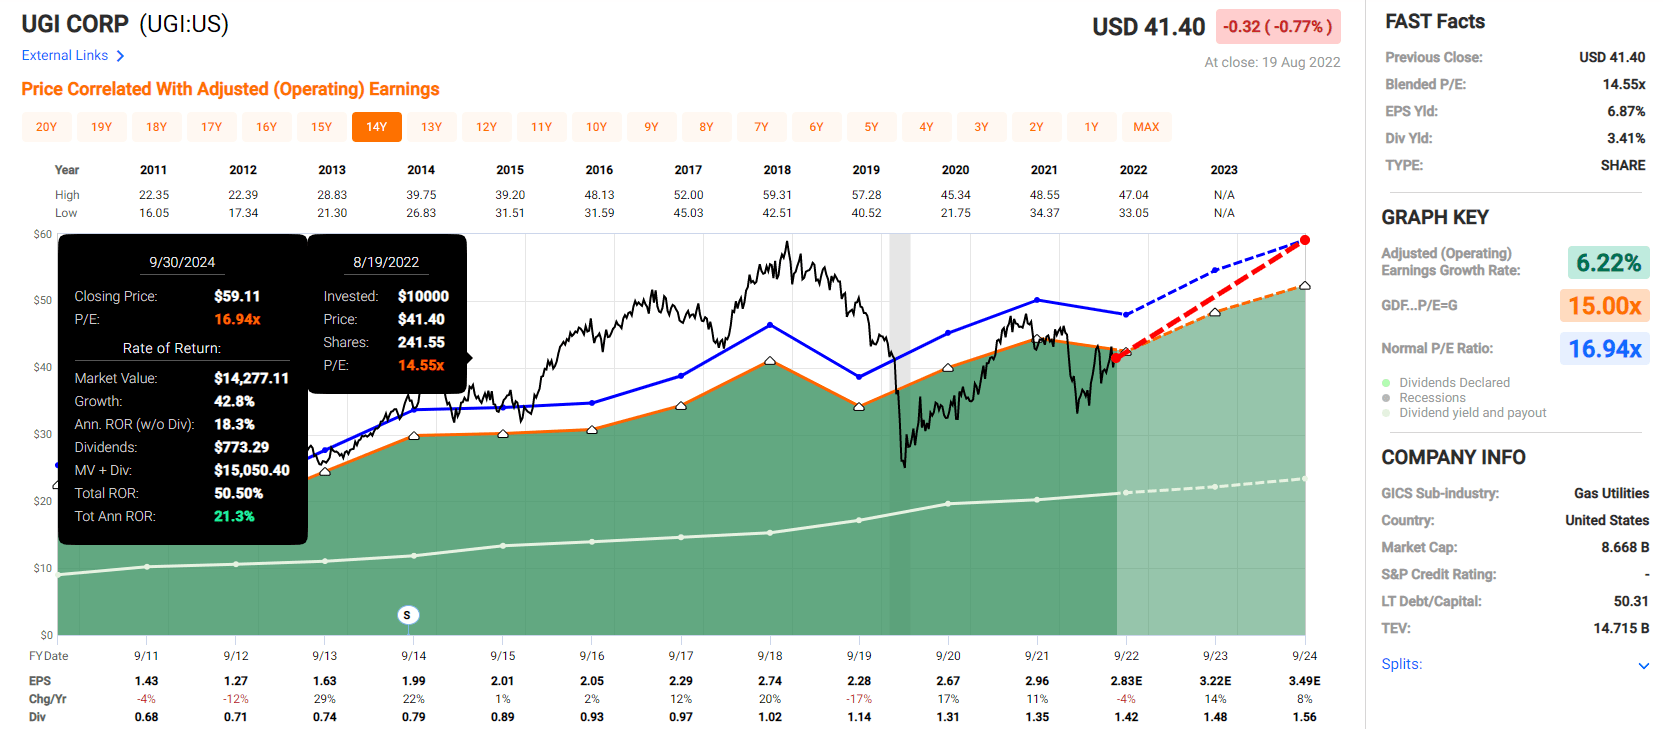
3M 2024 Consensus Return Potential
(Source: FAST Graphs, FactSet Research)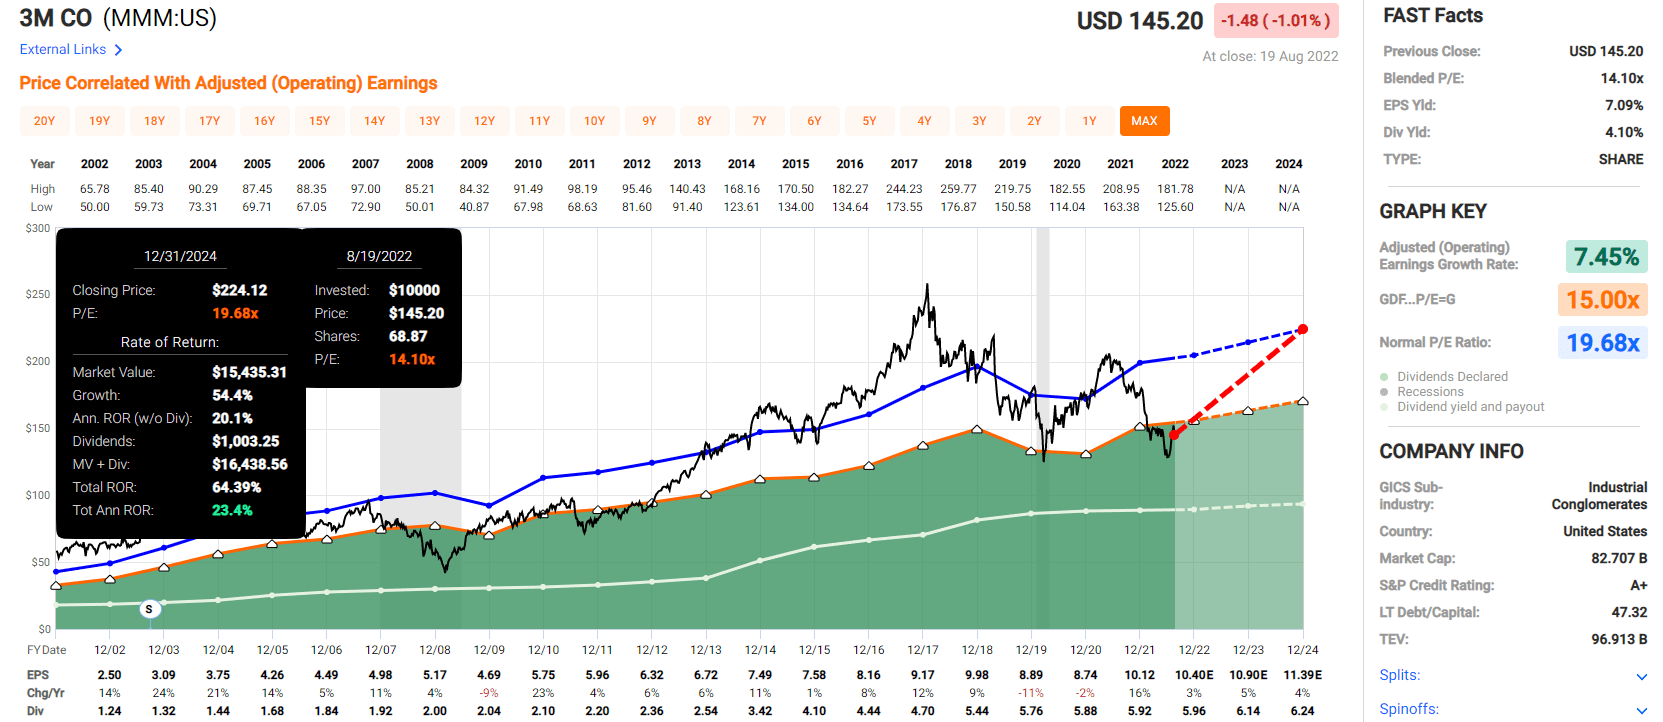
Altria 2024 Consensus Return Potential
(Source: FAST Graphs, FactSet Research)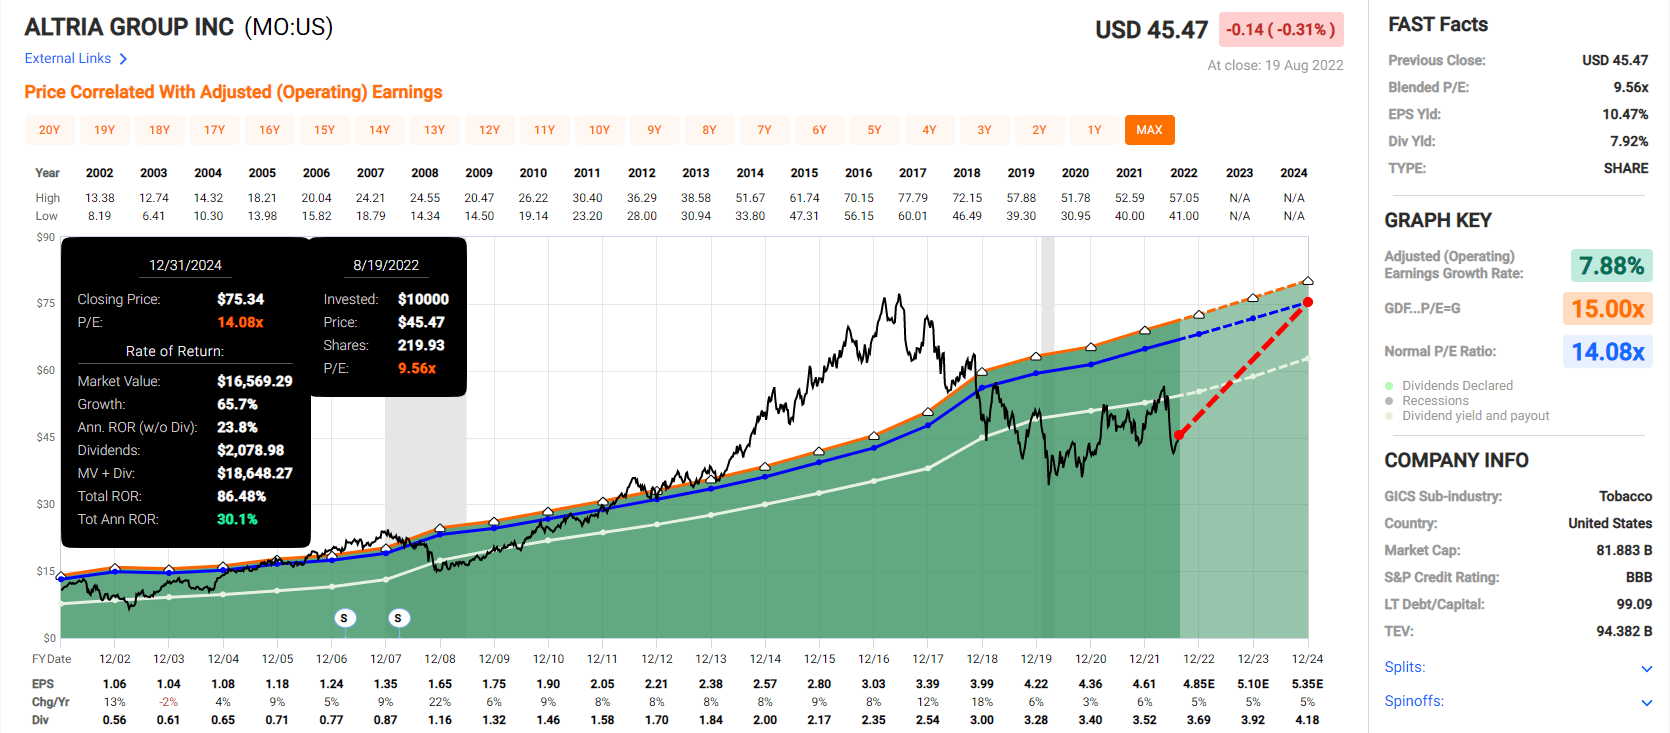
Merck 2024 Consensus Return Potential
(Source: FAST Graphs, FactSet Research)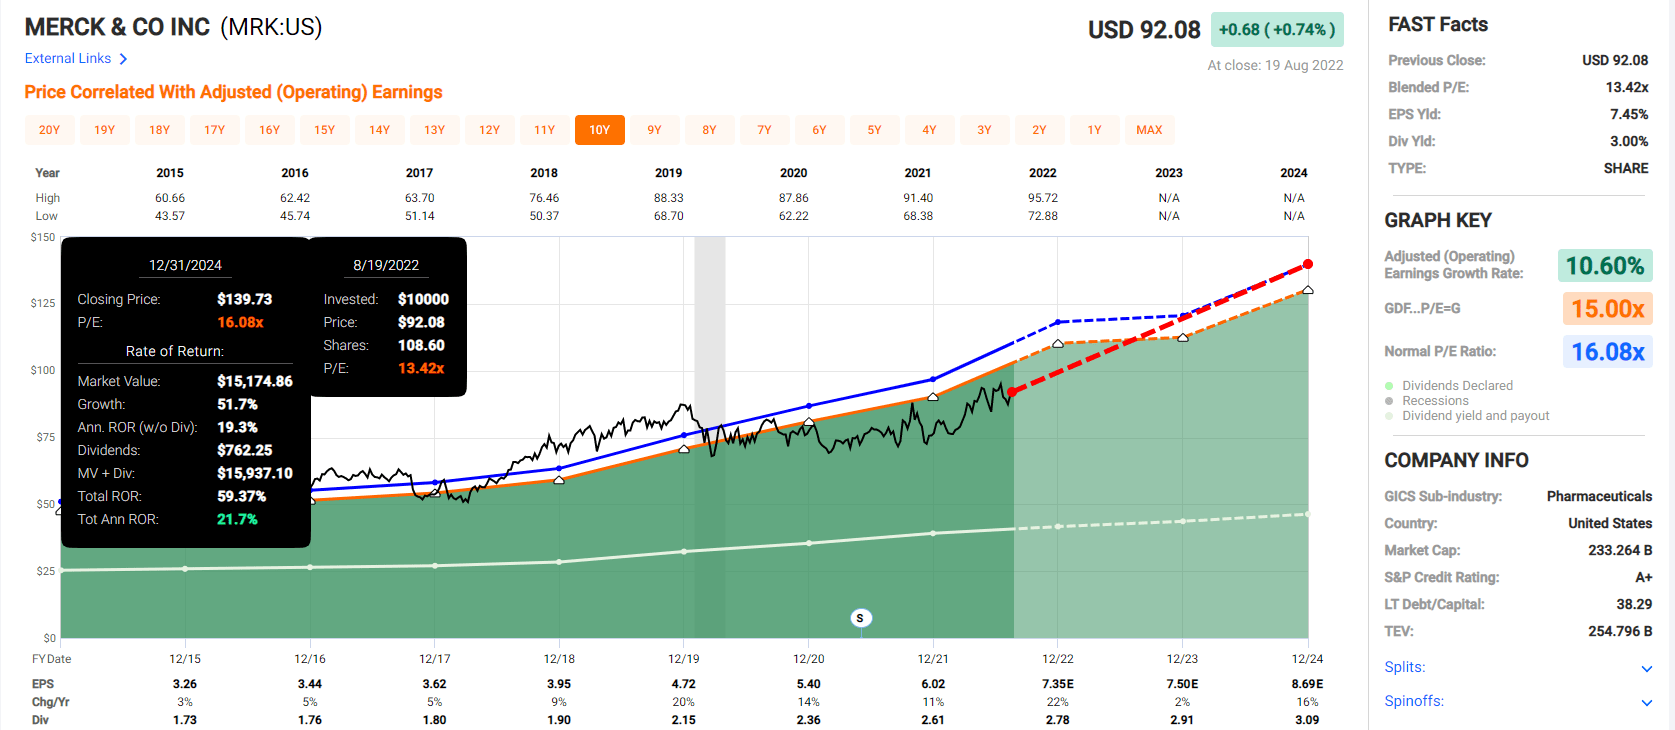
British American Tobacco 2024 Consensus Return Potential
(Source: FAST Graphs, FactSet Research)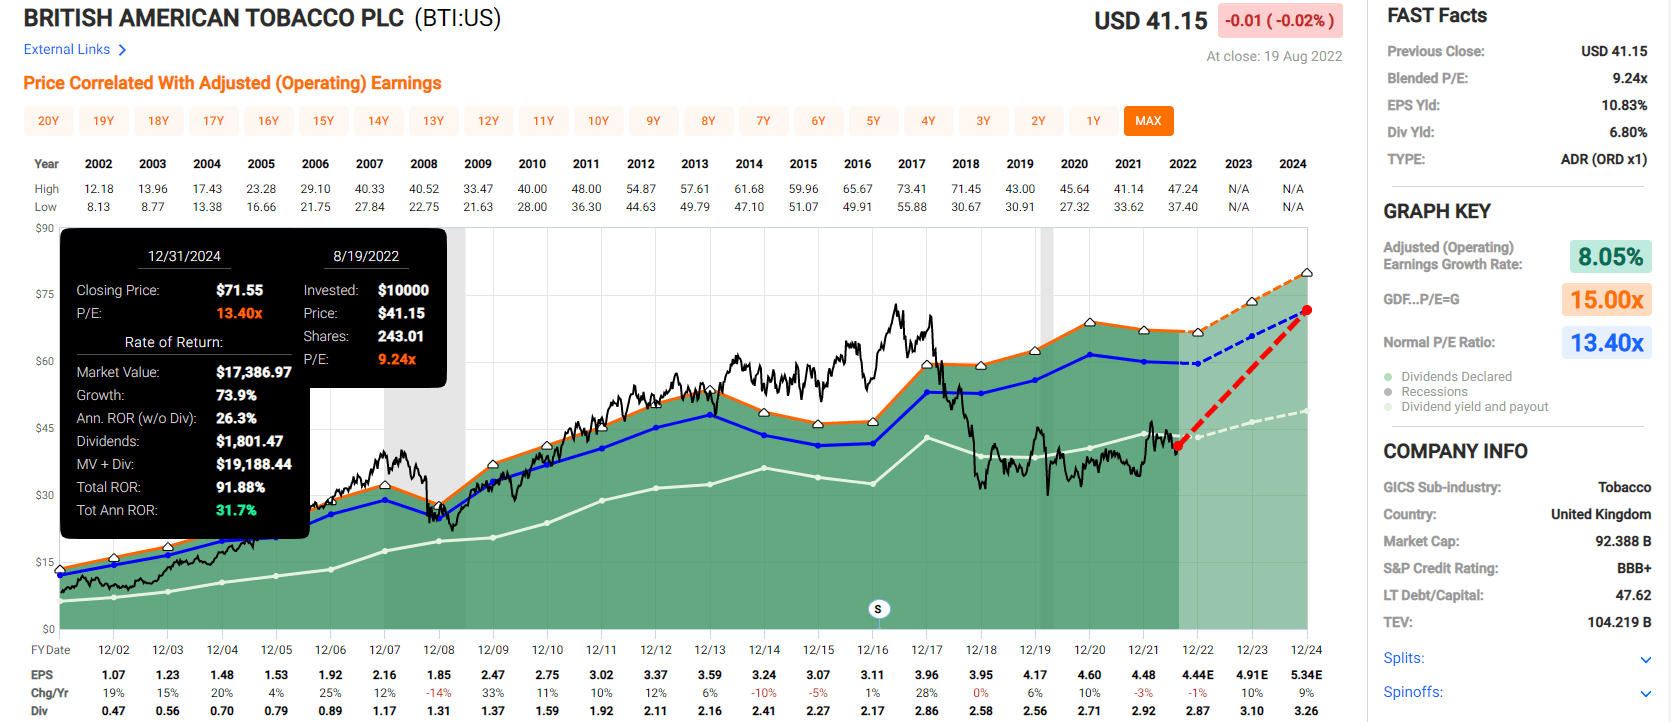
Enbridge 2024 Consensus Return Potential
(Source: FAST Graphs, FactSet Research)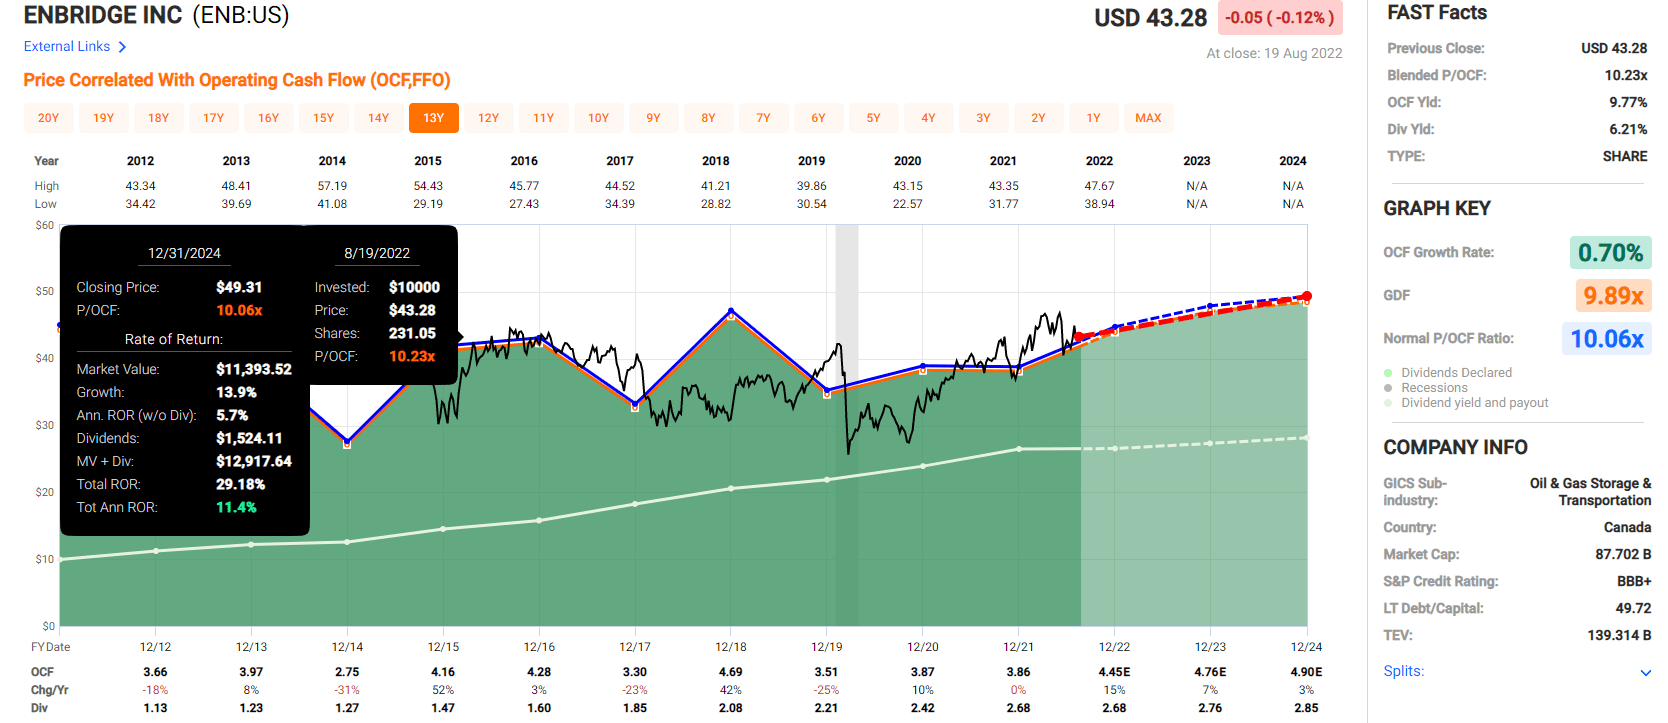
Now compare these return potentials to the S&P 500’s.
S&P 2024 Consensus Total Return Potential
(Source: FAST Graphs, FactSet)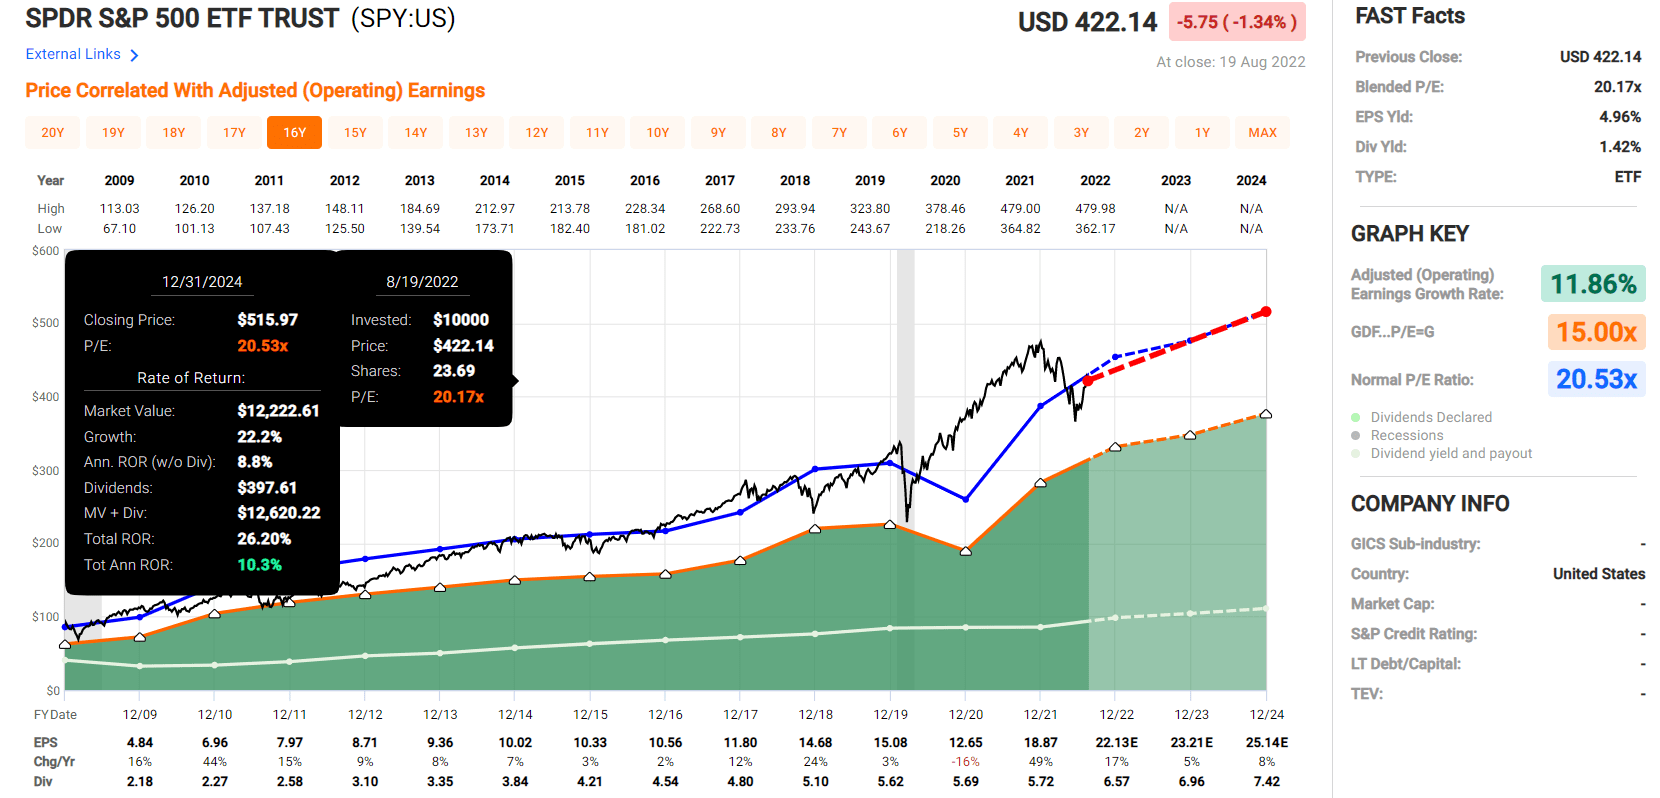
Analysts expect the market to deliver about 10% annual returns over the next 2.5 years, its historical average.
These high-yield low volatility blue-chips?
- 23% CAGR
- Buffett-like return potential from blue-chip bargains hiding in plain sight
- and 2.3X more than the S&P 500
But while the potential for 70% total returns in 2.5 years is great, that’s not why I’m recommending these blue-chips. This is.
7 Of The Highest Quality High-Yield Defensive Blue-Chips On Earth
(Source: Dividend Kings Zen Research Terminal)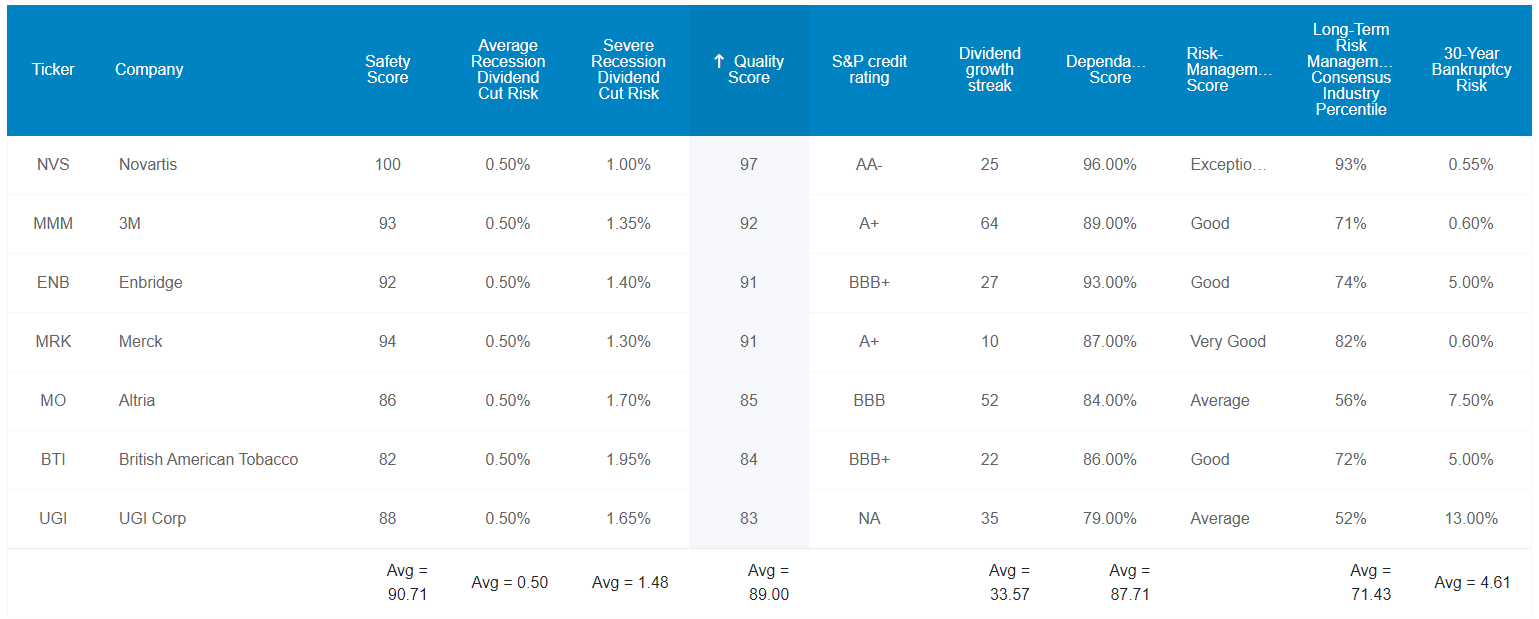
These aren’t just blue-chips; they average 12.8/13 Ultra SWAN (sleep well at night) quality, as close to perfect quality dividend growth stocks as can exist on Wall Street.
How can I know this? By comparing their fundamentals to the bluest of blue-chips, the dividend aristocrats.
Higher Quality And Better Investment Opportunities Than The Dividend Aristocrats
| Metric | Dividend Aristocrats | 7 High-Yield Low Volatility Ultra SWANs | Winner Dividend Aristocrats |
Winner 7 High-Yield Low Volatility Ultra SWANs |
| Quality | 87% | 89% | 1 | |
| Safety | 90% | 91% | 1 | |
| Average Recession Dividend Cut Risk | 0.5% | 0.5% | 1 | 1 |
| Severe Recession Dividend Cut Risk | 1.5% | 1.5% | 1 | 1 |
| Dependability | 84% | 88% | 1 | |
| Dividend Growth Streak (Years) | 44.8 | 33.6 | 1 | |
| Long-Term Risk Management Industry Percentile | 67% Above-Average, Low-Risk |
71% Good, Low-Risk |
1 | |
| Average Credit Rating | A- Stable | BBB+ Stable | 1 | |
| Average Bankruptcy Risk | 3.04% | 4.61% | 1 | |
| Average Return On Capital | 105% | 273% | 1 | |
| Average ROC Industry Percentile | 83% | 90% | 1 | |
| 13-Year Median ROC | 89% | 154% | 1 | |
| Forward PE | 20.8 | 11.7 | 1 | |
| Discount To Fair Value | -2% | 24% | 1 | |
| DK Rating | Hold | Strong Buy | 1 | |
| Yield | 2.4% | 5.1% | 1 | |
| LT Growth Consensus | 8.7% | 7.9% | 1 | |
| Total Return Potential | 11.1% | 13.0% | 1 | |
| Risk-Adjusted Expected Return | 7.5% | 8.7% | 1 | |
| Inflation & Risk-Adjusted Expected Return | 5.3% | 6.5% | 1 | |
| Conservative Years To Double | 13.6 | 11.1 | 1 | |
| Total | 6 | 17 |
(Source: Dividend Kings Zen Research Terminal)
In terms of overall quality and safety, these two groups of blue-chips run neck and neck.
- both have an average 0.5% average recession cut risk
- both have an average 1.5% severe recession cut risk
The aristocrats average a 45-year dividend growth streak, more than 2X Ben Graham’s standard of excellence.
But these high-yield, low volatility blue-chips average a 34-year dividend growth streak, making it an effective aristocrat portfolio.
Now let’s consider profitability, Wall Street’s favorite quality proxy.
Quality That’s Off The Charts
Joel Greenblatt considers return on capital to be his gold standard proxy for quality and moatiness.
- return on capital = annual pretax profit/the cost of running the business for a year
- using ROC and valuation, Greenblatt achieved 40% CAGR returns for 21 years
- one of the greatest investors in history
For context, the S&P 500 had 14.6% ROC in 2021.
The dividend aristocrats in the last year? 105% or 7.2X higher ROC (and 7.2X higher quality, according to Greenblatt).
These high-yield low volatility Ultra SWANs? 273% ROC, almost 3X more than the aristocrats and 19X higher than the S&P 500.
The aristocrats average ROC in the 83rd industry percentile, a wide moat.
These high-yield Ultra SWANs average 90th industry percentile ROC, indicating a super wide moat.
The 13-year median ROC for aristocrats is an amazing 89%. For these Ultra SWANs? It’s 154%, almost 2X better.
According to one of the greatest investors in history, these high-yield Ultra SWANs are 7X higher quality and wider moat than the aristocrats and 19X higher quality than the S&P 500.
S&P estimates the average 30-year bankruptcy risk for aristocrats at 3.0%, an A- stable credit rating.
For these high-yield Ultra SWANs? It’s a bit higher at 4.6%, a BBB+ stable average credit rating.
Six rating agencies consider the aristocrat’s long-term risk management to be in the 67th industry percentile, above-average, and bordering on good.
- low risk and stable trend
These high-yield low, volatility Ultra SWANs have 71st industry percentile good risk management.
These Ultra SWANs Collectively Have The 161st Best Risk Management On The Master List (68th Percentile)
| Classification | Average Consensus LT Risk-Management Industry Percentile |
Risk-Management Rating |
| S&P Global (SPGI) #1 Risk Management In The Master List | 94 | Exceptional |
| Strong ESG Stocks | 78 |
Good – Bordering On Very Good |
| Foreign Dividend Stocks | 75 | Good |
| 7 High-Yield Low Volatility Ultra SWANs | 71 | Good |
| Ultra SWANs | 71 | Good |
| Low Volatility Stocks | 68 | Above-Average |
| Dividend Aristocrats | 67 | Above-Average |
| Dividend Kings | 63 | Above-Average |
| Master List average | 62 | Above-Average |
| Hyper-Growth stocks | 61 | Above-Average |
| Monthly Dividend Stocks | 60 | Above-Average |
| Dividend Champions | 57 | Average bordering on above-average |
(Source: DK Zen Research Terminal, Dividend Kings Safety And Quality Tool)
That means their long-term risk-management, ranging from climate change mitigation to supply chains, labor relations, and managing lawsuits, is in the top 33% of the world’s greatest companies on par with such legendary blue-chips as:
- Stanley Black & Decker (SWK): Super SWAN dividend king
- Kimberly-Clark (KMB): Ultra SWAN dividend king
- Johnson & Johnson (JNJ): Ultra SWAN dividend king
- Federal Realty Investment Trust (FRT): Ultra SWAN dividend king
- V. F. Corp (VFC): Ultra SWAN dividend king
- T. Rowe Price (TROW): Ultra SWAN dividend aristocrat
How do we know this?
How We Monitor These Ultra SWAN’s Risk Profile
- 139 analysts
- 4 credit rating agencies
- 9 total risk rating agencies
- 148 experts who collectively know this business better than anyone other than management
- and the bond market for real-time fundamental risk assessment when news breaks
When the facts change, I change my mind. What do you do, sir? – John Maynard Keynes
There are no sacred cows at iREIT or Dividend Kings. Wherever the fundamentals lead, we always follow. That’s the essence of disciplined financial science, the math behind retiring rich and staying rich in retirement.
OK, now that you know why I trust these seven high-yield low volatility Ultra SWANs, and so can you, here’s why you might want to buy them today.
Wonderful Companies At Fair Prices
(Source: Dividend Kings Zen Research Terminal)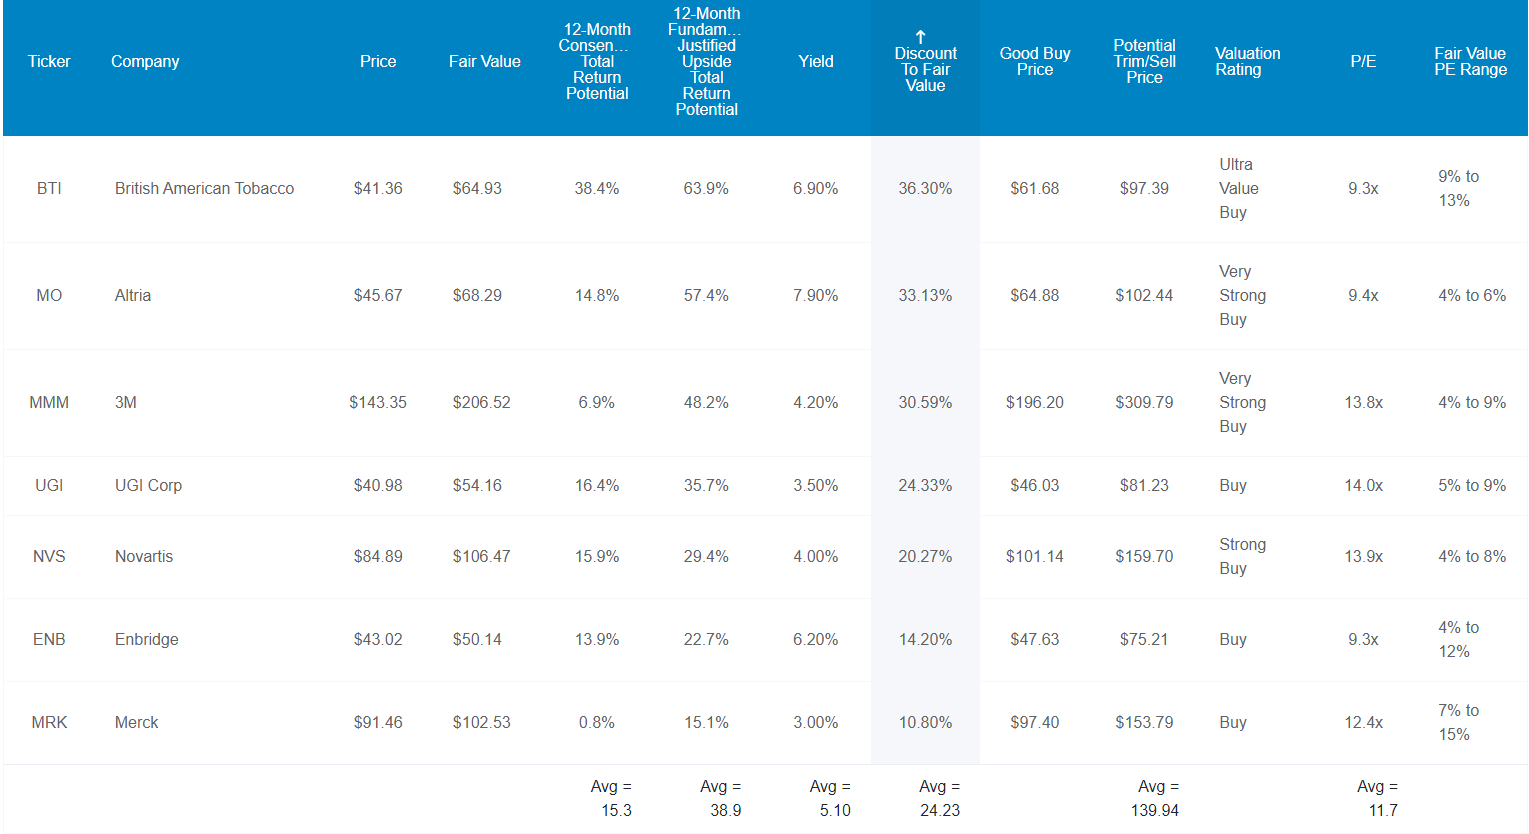
For context, the S&P 500 trades at 18.3X forward earnings, a 9% historical premium.
The aristocrats trade at 20.8X earnings, a 2% historical premium.
These high-yield low volatility aristocrats trade at 11.7X earnings, a 24% historical discount.
Do you know the last times the S&P traded at 11.7X earnings?
- the Pandemic crash
- the 2018 bear market
- October 2014
The last time, outside of a bear market, the S&P 500 was as undervalued as these Ultra SWANs was eight years ago!
That’s why analysts expect 15% total returns in the next year, but they have 39% fundamentally justified 12-month total return potential.
- if each grows as expected in the next 12 months and returns to historical mid-range market-determined fair value you will earn 39% total returns
But my goal isn’t to help you earn 15% returns in a year, 39% returns in 12 months, or 70% returns by the end of 2024; I want to help you retire in safety and splendor.
That means potentially helping you achieve 20X (or higher) returns in the coming 25+ years.
Sleep Well At Night While Retiring Rich And Staying Rich In Retirement
(Source: Dividend Kings Zen Research Terminal)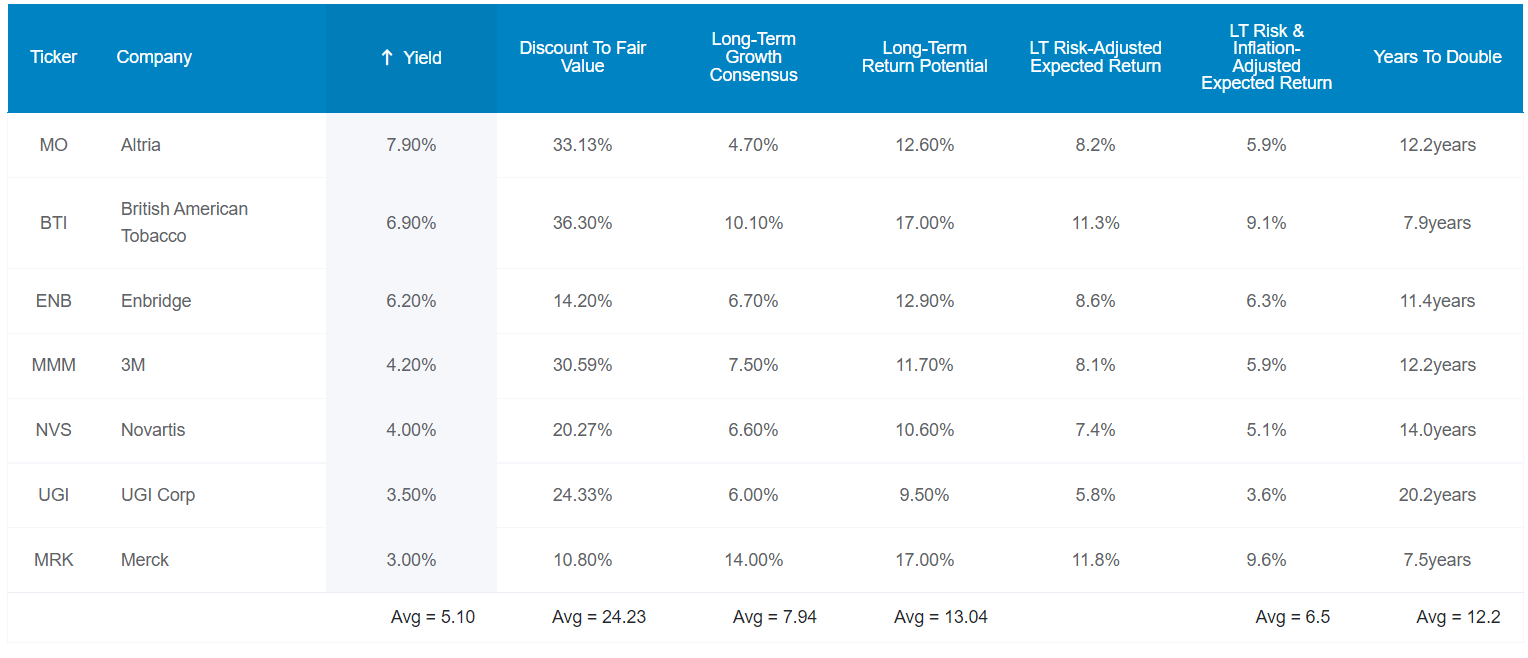
These low volatility high-yield Ultra SWAN aristocrats not only offer one of the safest 5.1% yields on earth, analysts think they will grow at almost 8% over time.
That means a consensus 13% long-term return potential.
| Investment Strategy | Yield | LT Consensus Growth | LT Consensus Total Return Potential | Long-Term Risk-Adjusted Expected Return | Long-Term Inflation And Risk-Adjusted Expected Returns | Years To Double Your Inflation & Risk-Adjusted Wealth |
10-Year Inflation And Risk-Adjusted Expected Return |
|
| 7 High-Yield Low Volatility Ultra SWAN Aristocrats | 5.1% | 7.9% | 13.0% | 9.1% | 6.9% | 10.4 | 1.95 | 2.22% |
| Schwab US Dividend Equity ETF | 3.6% | 8.20% | 11.8% | 8.3% | 6.0% | 11.9 | 1.80 | 2.22% |
| Dividend Aristocrats | 2.4% | 8.6% | 11.0% | 7.7% | 5.5% | 13.2 | 1.70 | 2.22% |
| S&P 500 | 1.6% | 8.5% | 10.1% | 7.1% | 4.9% | 14.8 | 1.61 | 2.22% |
| Nasdaq | 0.9% | 12.6% | 13.4% | 9.4% | 7.2% | 10.0 | 2.00 | 2.22% |
(Source: Morningstar, FactSet, Ycharts)
13% long-term returns is almost as good as what analysts expect from the Nasdaq and far more than SCHD (the best high-yield dividend aristocrat I’ve ever found), the dividend aristocrats, and S&P 500.
Don’t think that 13% returns can change your life?
Inflation-Adjusted Consensus Return Potential: $1,000 Initial Investment
| Time Frame (Years) | 7.9% CAGR Inflation And Risk-Adjusted S&P Consensus | 8.9% Inflation-Adjusted Aristocrat Consensus | 10.8% CAGR Inflation-Adjusted 7 High-Yield Low Volatility Ultra SWAN Dividend Aristocrats Consensus | Difference Between Inflation-Adjusted 7 High-Yield Low Volatility Ultra SWAN Dividend Aristocrats And S&P Consensus |
| 5 | $1,461.18 | $1,530.17 | $1,668.43 | $207.24 |
| 10 | $2,135.06 | $2,341.43 | $2,783.64 | $648.59 |
| 15 | $3,119.71 | $3,582.79 | $4,644.30 | $1,524.59 |
| 20 | $4,558.47 | $5,482.29 | $7,748.67 | $3,190.20 |
| 25 | $6,660.75 | $8,388.86 | $12,928.08 | $6,267.32 |
| 30 (Retirement Time Frame) | $9,732.58 | $12,836.40 | $21,569.54 | $11,836.95 |
| 35 | $14,221.09 | $19,641.92 | $35,987.16 | $21,766.08 |
| 40 | $20,779.62 | $30,055.54 | $60,041.90 | $39,262.29 |
| 45 | $30,362.83 | $45,990.17 | $100,175.43 | $69,812.61 |
| 50 | $44,365.65 | $70,372.93 | $167,135.24 | $122,769.59 |
| 55 | $64,826.35 | $107,682.76 | $278,852.69 | $214,026.34 |
| 60 (Investing Lifetime) | $94,723.18 | $164,773.26 | $465,244.93 | $370,521.75 |
(Source: DK Research Terminal, FactSet)
Analysts think these high-yield low volatility Ultra SWAN aristocrats could deliver 22X inflation-adjusted returns over the next 30 years and over an investing lifetime, potentially 465X.
- you don’t need crypto to earn 100X or higher returns
- you just need the world’s best blue-chips and a few decades
| Time Frame (Years) | Ratio Aristocrats/S&P Consensus | Ratio Inflation-Adjusted 7 High-Yield Low Volatility Ultra SWAN Dividend Aristocrats vs. S&P consensus |
| 5 | 1.05 | 1.14 |
| 10 | 1.10 | 1.30 |
| 15 | 1.15 | 1.49 |
| 20 | 1.20 | 1.70 |
| 25 | 1.26 | 1.94 |
| 30 | 1.32 | 2.22 |
| 35 | 1.38 | 2.53 |
| 40 | 1.45 | 2.89 |
| 45 | 1.51 | 3.30 |
| 50 | 1.59 | 3.77 |
| 55 | 1.66 | 4.30 |
| 60 | 1.74 | 4.91 |
(Source: DK Research Terminal, FactSet)
Want to beat the market? Well, these seven high-yield Ultra SWANs could help you beat the market by 5X over an investing lifetime.
- and triple the returns of the dividend aristocrats
Higher yield, lower volatility, superior quality and safety, and the potential for life-changing returns and rivers of safe income. Does that sound appealing?
It sounds amazing, BUT what evidence is there that these seven high-yield low volatility Ultra SWAN aristocrats can deliver anything close to 13% long-term returns?
Because they’ve been doing it for 26 years.
Historical Returns Since December 1996 (Equal Weighting, Annual Rebalancing)
The future doesn’t repeat, but it often rhymes. – Mark Twain
Past performance is no guarantee of future results. Still, studies show that blue-chips with relatively stable fundamentals over time offer predictable returns based on yield, growth, and valuation mean reversion.
Bank of America
So let’s look at how these high-yield Ultra SWANs have done over the last 26 years when approximately 94% of returns were the result of fundamentals, not luck.
(Source: Portfolio Visualizer Premium)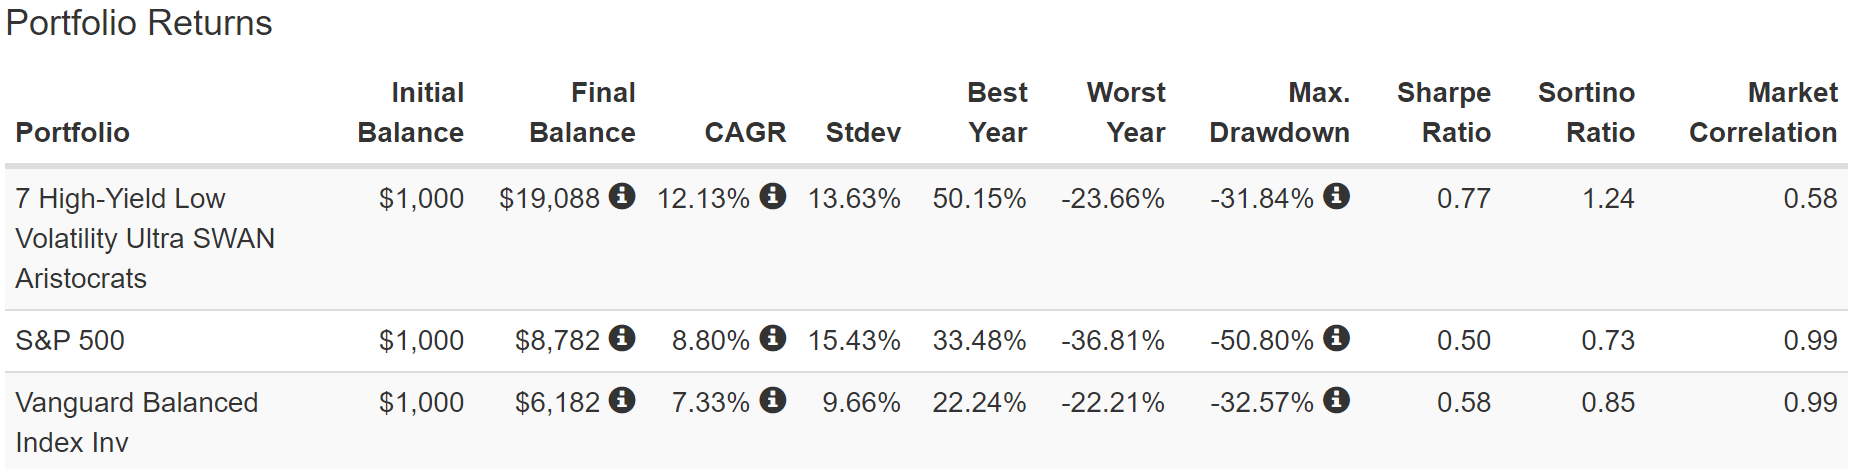
For 26 years, these high-yield low volatility aristocrats delivered 12% annual returns with lower volatility than the market and a peak decline in the Great Recession of 32%, less than a 60/40 retirement portfolio.
- 70% better negative volatility-adjusted returns (Sortino Ratio) than the S&P 500
- 46% better negative volatility-adjusted returns than a 60/40
No bonds, no hedging assets of any kind, and yet in the 2nd biggest market crash in US history, they were as defensive as a balanced stock/bond fund!
(Source: Portfolio Visualizer Premium)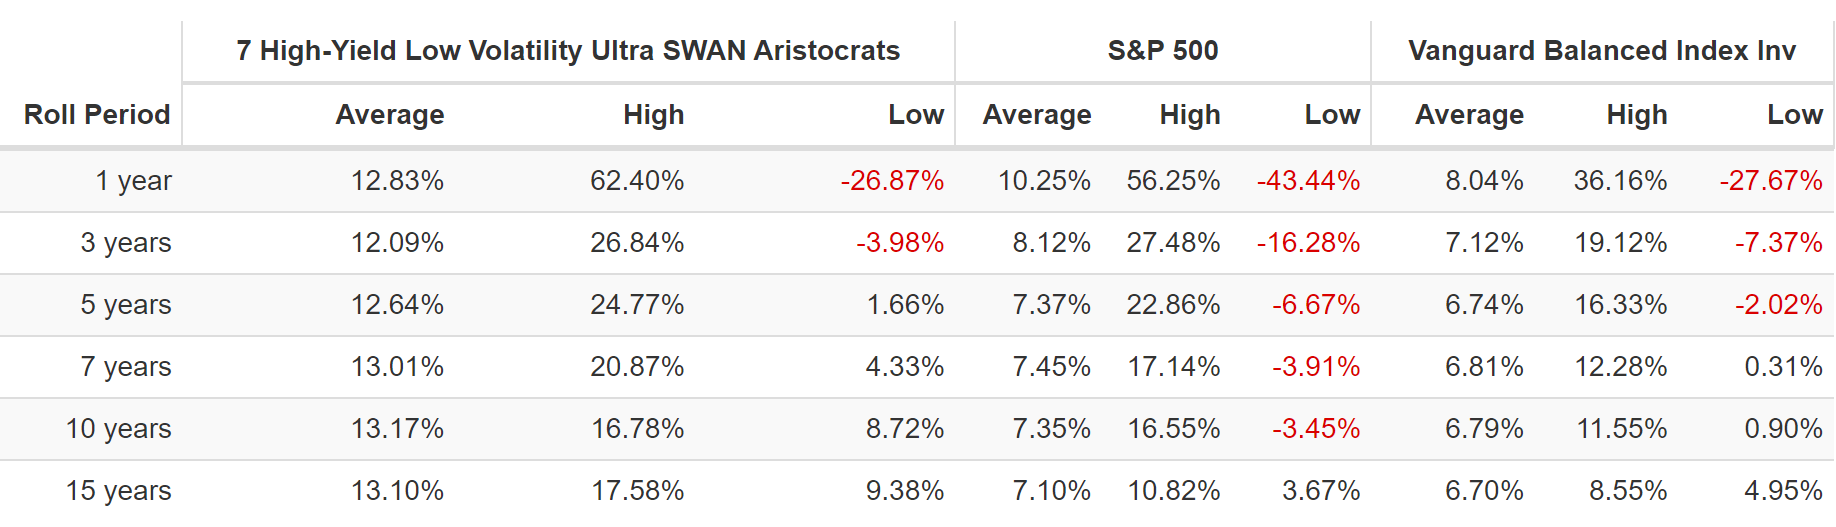
Their average rolling 12-month return was 12.8% Vs. 13% analysts expect in the future.
Their average long-term rolling return was also 13% CAGR, almost 2X that of the S&P 500.
These aren’t speculative ARKK stocks where future growth rates are all but unknowable; they are some of the world’s most dependable and stable blue-chips.
(Source: Portfolio Visualizer Premium)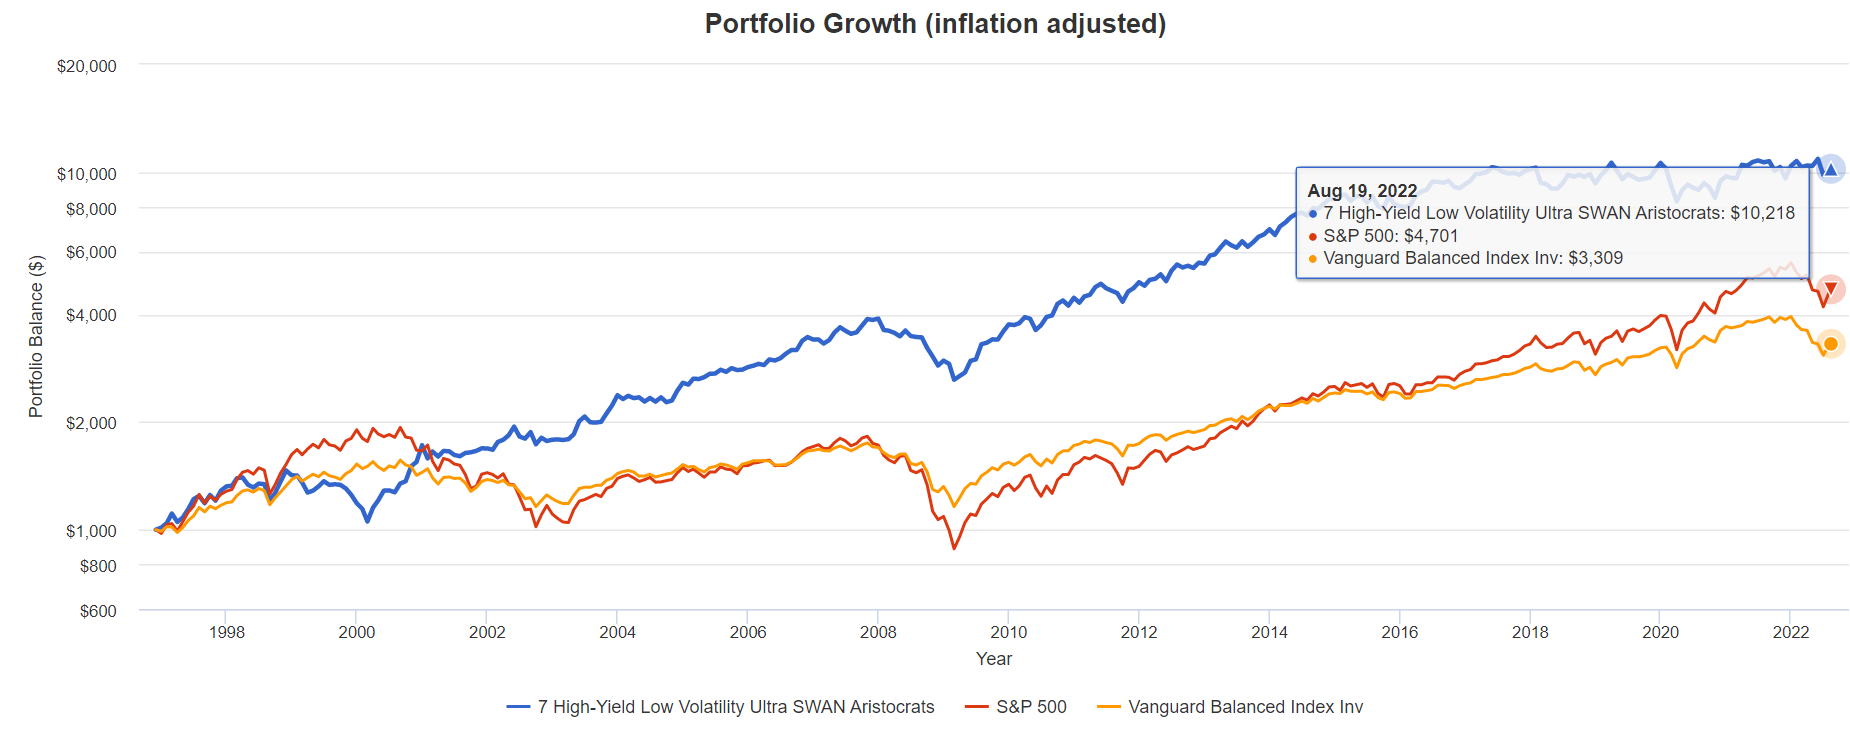
Inflation-Adjusted Returns Since 1996
| Stock | Ticker | Inflation-Adjusted Return Since December 1996 |
Annual Real Return Since December 1996 |
| 7 High-Yield Low Volatility Ultra SWAN Aristocrats | NVS, UGI, MMM, MO, MRK, BTI, ENB | 922% | 9.4% |
| 60/40 Retirement Portfolio | VBINX | 231% | 4.7% |
| S&P 500 | VOO | 370% | 6.1% |
| X Better Returns Than 60/40 | 4.0 | X Better Returns Than S&P 500 | 2.5 |
(Source: Portfolio Visualizer Premium)
Think beating the market is impossible? Not over the long-term as long as you have superior yield + growth.
(Source: Portfolio Visualizer Premium)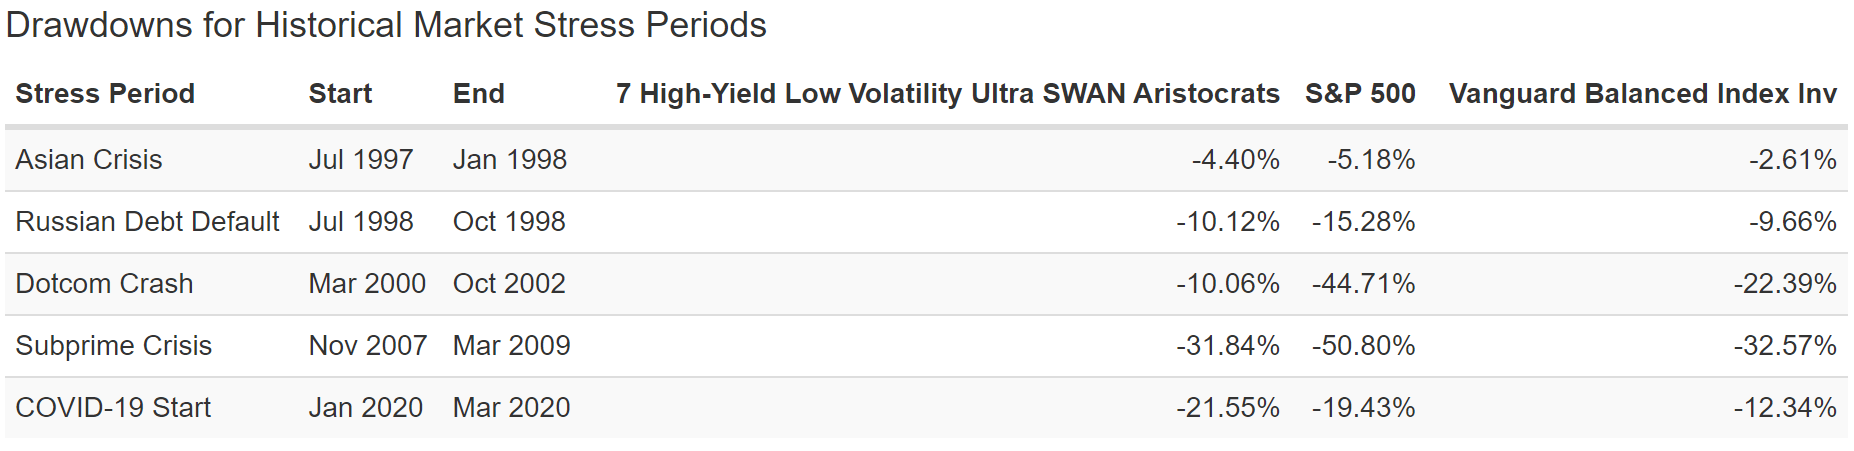
While no portfolio will be less volatile than the market all the time, these low volatility Ultra SWAN aristocrats were less volatile in four of the five major market panics of the last quarter century.
They fell just 10% in the tech crash, not even suffering a bear market.
(Source: Portfolio Visualizer Premium)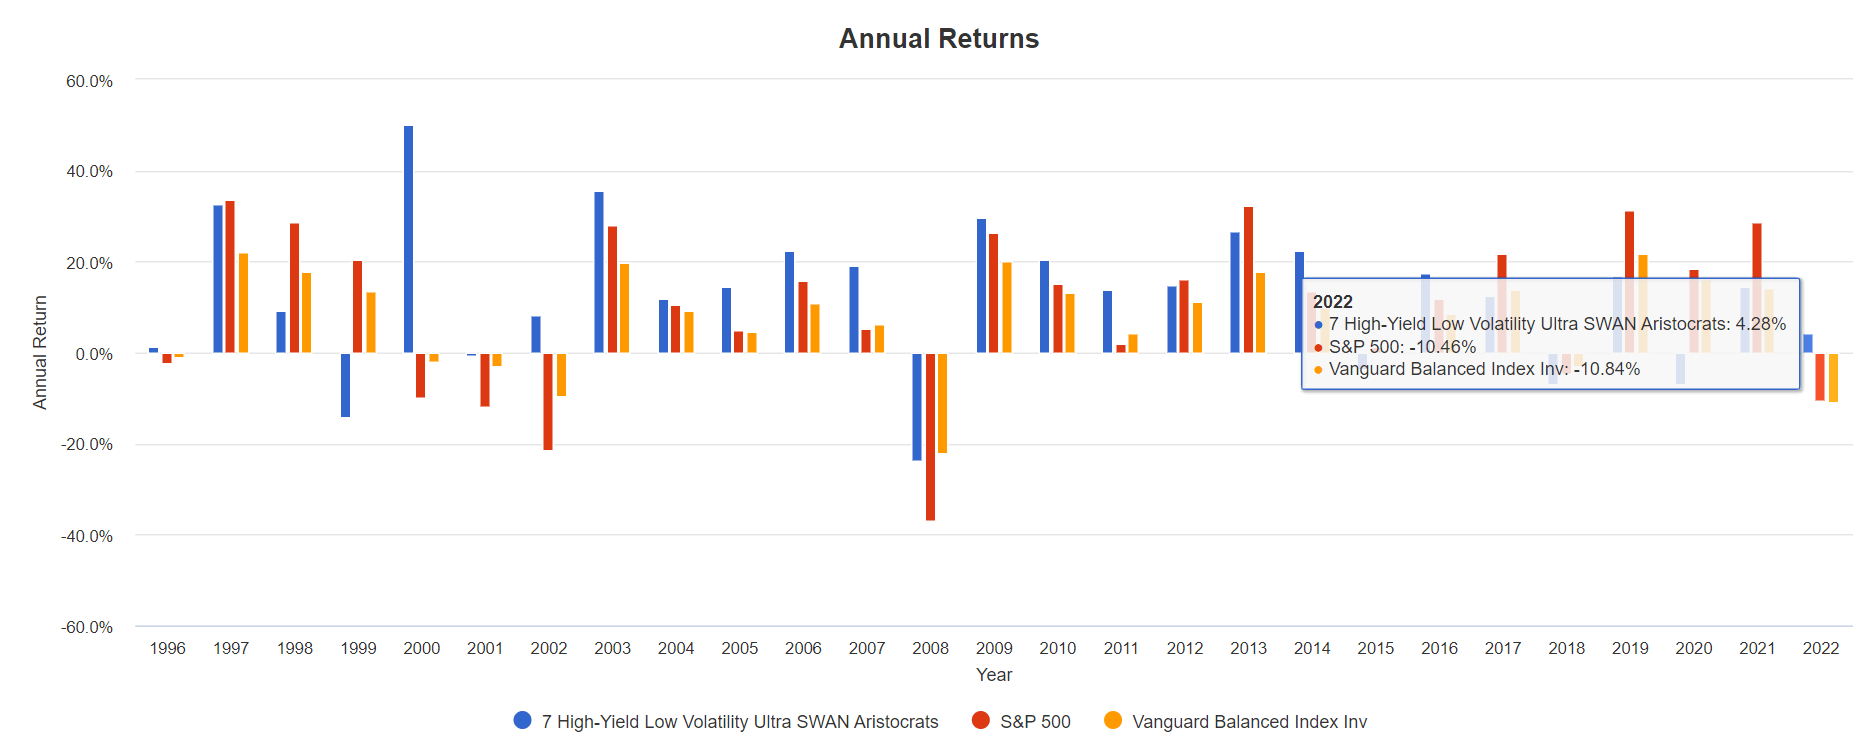
In 2022’s bear market, they are UP 4%! No bonds, no hedging assets of any kind, just low volatility, supreme quality, and defensive, recession-resistant business models.
This is the power of defensive Ultra SWAN investing in a bear market.
And finally, let’s not forget the entire purpose of high-yield blue-chip investing, income!
Dividend Growth Blue-Chips You Can Trust
(Source: Portfolio Visualizer Premium) – includes reinvested dividends in USD, 2007 and 2008 were the year of MO’s spin-offs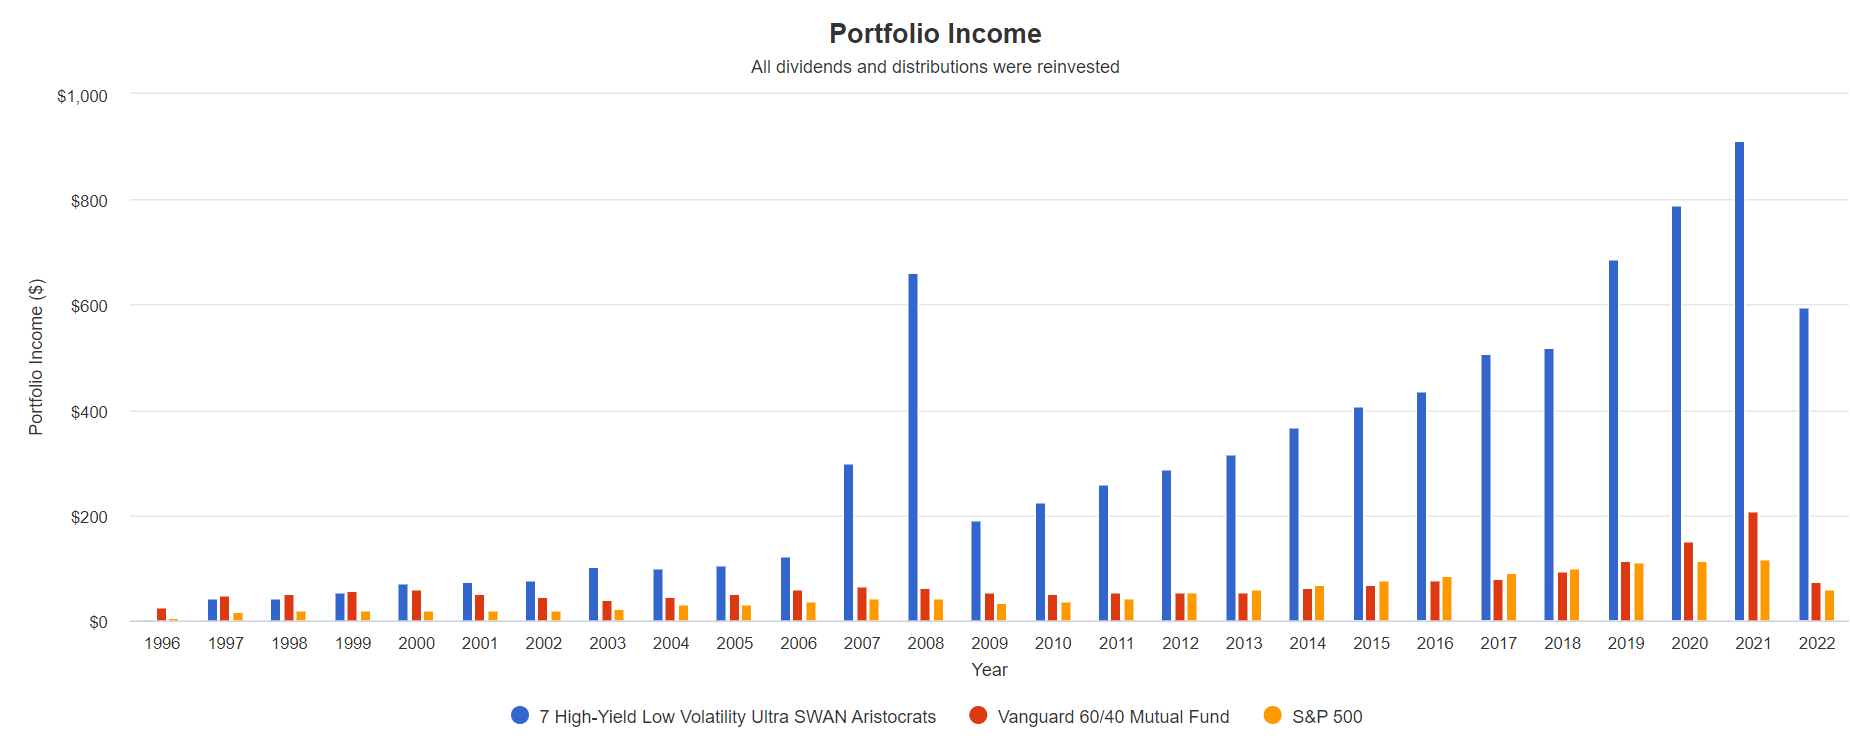
Just how amazing is this income growth?
Cumulative Dividend Since 1997: $1,000 Initial Investment
| Metric | S&P 500 | Vanguard 60/40 Mutual Fund |
7 High-Yield Low Volatility Ultra SWAN Aristocrats |
| Total Dividends | $1,441 | $1,911 | $8,847 |
| Annualized Income Growth Rate | 8.0% | 4.6% | 14.2% |
| Total Income/Initial Investment | 1.44 | 1.91 | 8.85 |
| Inflation-Adjusted Income/Initial Investment | 0.77 | 1.03 | 4.76 |
| More Inflation-Adjusted Income Than S&P 500 | NA | 1.33 | 4.63 |
| Starting Yield | 1.8% | 4.9% | 4.3% |
| Yield On Cost | 12.2% | 15.0% | 119.0% |
(Source: Portfolio Visualizer Premium)
How does 14% annual income growth sound? How about the idea of getting 5X your initial investment back in inflation-adjusted dividends sound?
- The risk of losing all your money is now effectively zero, requiring a nearly 80% permanent collapse of these aristocrats.
- which are BBB+ rated and have an average 30-year bankruptcy risk of 4.6%
What about future income growth?
Consensus Future Income Growth Potential
| Analyst Consensus Income Growth Forecast | Risk-Adjusted Expected Income Growth | Risk And Tax-Adjusted Expected Income Growth |
Risk, Inflation, And Tax-Adjusted Income Growth Consensus |
| 14.4% | 10.1% | 8.6% | 6.3% |
(Source: DK Research Terminal, FactSet)
Analysts think these high-yield low volatility Ultra SWAN aristocrats could deliver similar 17% annual income growth in the future, which, adjusted for the risk of the company not growing as expected, inflation, and taxes, is 6.3% real expected income growth.
Sounds pretty unimpressive, right? But now compare that to what they expect from the S&P 500.
| Time Frame | S&P Inflation-Adjusted Dividend Growth | S&P Inflation-Adjusted Earnings Growth |
| 1871-2021 | 1.6% | 2.1% |
| 1945-2021 | 2.4% | 3.5% |
| 1981-2021 (Modern Falling Rate Era) | 2.8% | 3.8% |
| 2008-2021 (Modern Low Rate Era) | 3.5% | 6.2% |
| FactSet Future Consensus | 2.0% | 5.2% |
(Sources: S&P, FactSet, Multipl.com)
- 1.7% post-tax inflation-adjusted income growth from the S&P 500
- S&P 500’s historical post-tax inflation-adjusted income growth rate (current tax code) is 5.8% CAGR
The S&P 500 is now dominated by buyback-friendly companies prioritizing repurchases over fast dividend growth.
What about a 60/40 retirement portfolio?
- 0.5% consensus inflation, risk, and tax-adjusted income growth.
In other words, these high-yield low volatility aristocrats could generate about 3.7X faster real income growth than the S&P 500 and 13X faster income growth than a 60/40.
- with a 3.2X higher and much safer yield on day one
This is what I’m talking about when I say these Ultra SWANs can help you retire in safety and splendor, no matter what the economy does in the coming years and decades.
Bottom Line: These 7 High-Yield Ultra SWAN Aristocrats Can Help You Ride Out The Pain And Retire In Safety And Splendor
I understand that the idea of stocks falling 16% to 27% more might seem terrifying to many investors. Bear markets, especially ones brought on by a recession, mean a lot of suffering for millions of people.
However, the solution to times like these isn’t market timing, it a focus on safety and quality first, and prudent valuation and sound risk management always.
Whether the next market crash is just starting and ends in a few months, or is years away, NVS, UGI, MMM, MO, MRK, BTI, and ENB are seven high-yield low volatility Ultra SWAN quality aristocrats you can trust.
- 5.1% very safe yield (as safe as the dividend aristocrats)
- average BBB+ stable credit rating = 4.6% fundamental risk
- 71st industry percentile long-term risk management = low risk, good risk management
- 34-year average dividend growth streak (every year since 1988)
- 7.9% long-term growth consensus
- 13% CAGR long-term consensus return potential (same as the returns they’ve delivered for 26 years)
- when they’ve beaten the S&P 500, aristocrats, and even the Nasdaq
- 14% annual income growth, similar to what analysts expect in the future
- sub 14% average annual volatility
- 31% peak decline in the Great Recession (less than a 60/40 retirement portfolio)
- UP 4% in 2022 (mostly only hedge funds are up this year)
If you want to sleep well at night while bathing in generous, safe, and steadily growing dividends, you can’t sit out bear markets. You have to trust your hard-earned savings to the world’s best companies, with strong balance sheets, and management teams that have proven they know how to adapt to all economic conditions.
That describes these high-yield, low volatility Ultra SWAN aristocrats to a “T” and is why they are the perfect blue-chips to consider for when the market crashes next.
When you own the world’s greatest companies, you never pray for luck on Wall Street; you make your own luck and retire in safety and splendor.
Be the first to comment