

dardespot/E+ via Getty Images
The one nice thing about bear markets is that most things go on sale.
YCharts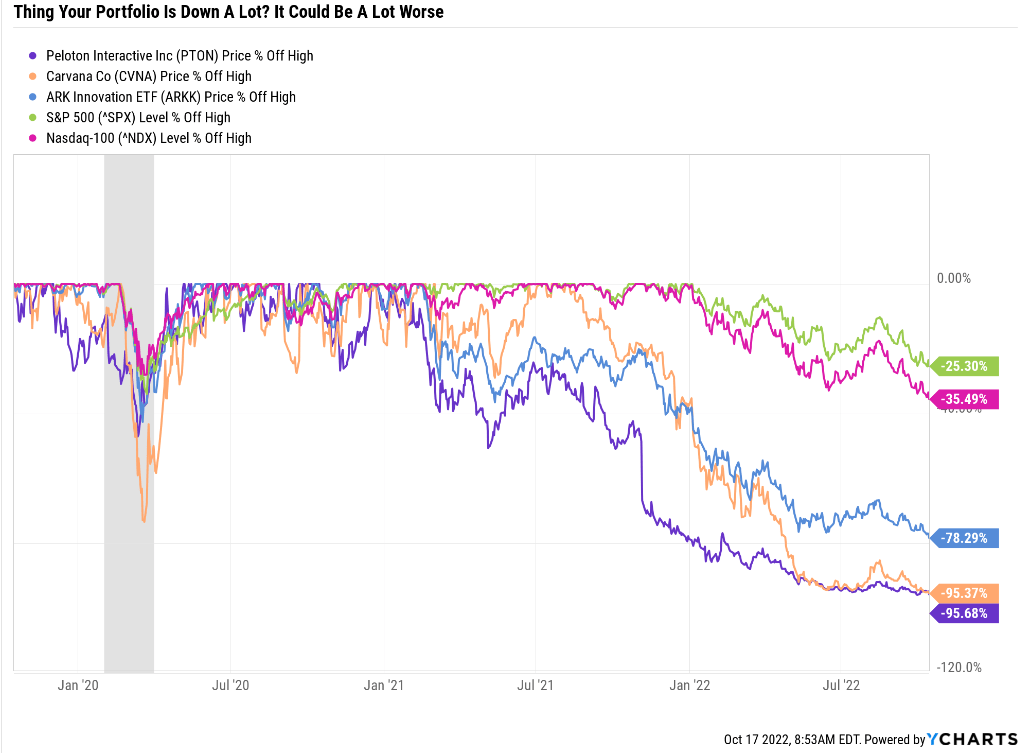
Mind you there is an important difference between deep value and value traps. Some investors mistakenly think that speculative growth is now “deep value” just because its down 80% to 95% off the Pandemic bubble highs.
Do you know what you call a stock down 95%? A stock that was down 80% and then got cut in half… and then fell another 50% after that.
JPMorgan Asset Management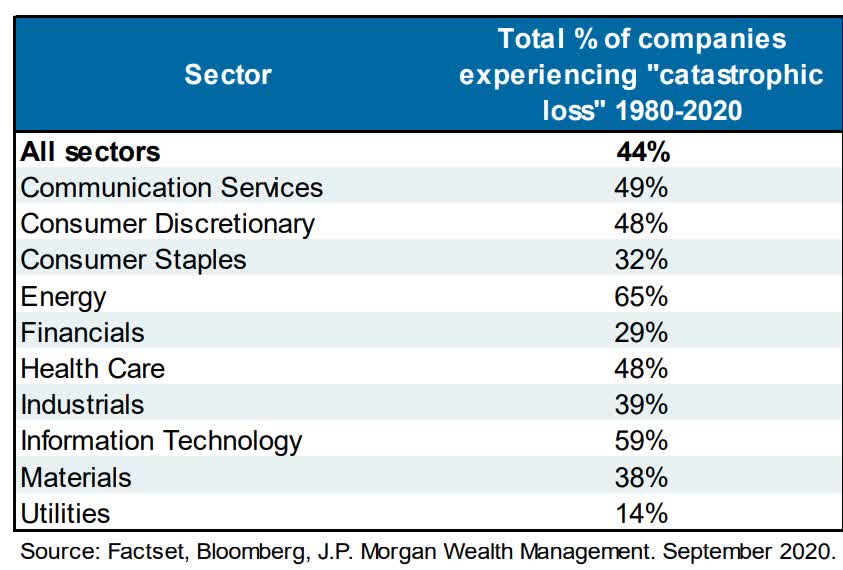
44% of all US stocks suffer permanent catastrophic declines of 70+% and never recover. These are value traps that you want to minimize in your portfolio if you want to achieve your financial goals.
There is one important difference between deep value blue-chip bargains you should buy in this bear market and potentially life-changing great buys that you should be buying with both hands.
That difference is fundamentals.
- is the balance sheet a fortress? Or on the verge of collapse?
- is the company generating strong free cash flow? Or losing money?
- is the business thriving or potentially dying?
- is management battle-tested and adaptable? Or an empire builder that’s great at lighting shareholder cash on fire?
- is the dividend sustainable and growing? Or likely to be cut?
In a bear market a lot of crappy companies will die, and world-beater blue-chips will survive, thrive, and rise like a Phoenix from the ashes to soar to new heights.
Today I wanted to highlight six A-rated blue-chip bargains that you can safely buy for the long-term, and that could change your life.
These aren’t just bargains; they are 50% or more undervalued blue-chips that are quintessential Buffett-style “greedy when others are fearful” fat pitches.
How To Find The Best A-Rated Blue-Chip Bargains In This Bear Market… In 1 Minute
Let me show you how to screen the Dividend Kings Zen Research Terminal, which runs of the DK 500 Master List, to easily find the best 50% off A-rated world-beater blue-chip bargains.
The Dividend Kings 500 Master List includes some of the world’s best companies, including:
- every dividend champion (25+ year dividend growth streaks, including foreign aristocrats)
- every dividend aristocrat
- every dividend king (50+ year dividend growth streaks)
- every Ultra SWAN (as close to perfect quality companies as exist)
- the 20% highest quality REITs according to iREIT
- 40 of the world’s best growth blue-chips
| Step | Screening Criteria | Companies Remaining | % Of Master List |
| 1 | A-credit rating or higher (2.5% or less 30-year bankruptcy risk) | 178 | 35.32% |
| 2 | Discount To Fair Value 49.5% (50% rounded) | 8 | 1.59% |
| 3 | Use “Build Your Watchlist” To Select The 6 Non-Speculative (No China) blue-chips | 6 | 1.19% |
| Total Time | 1 Minute |
So let’s take a look at what kind of world-beater blue-chip bargains you can get in this bear market.
6 A-Rated 50% Off Blue-Chip Bargains To Buy Now
I’ve linked to articles about each company, for those who want to read about their growth prospects, risk profiles, and overall investment thesis.
(Source: Dividend Kings Zen Research Terminal)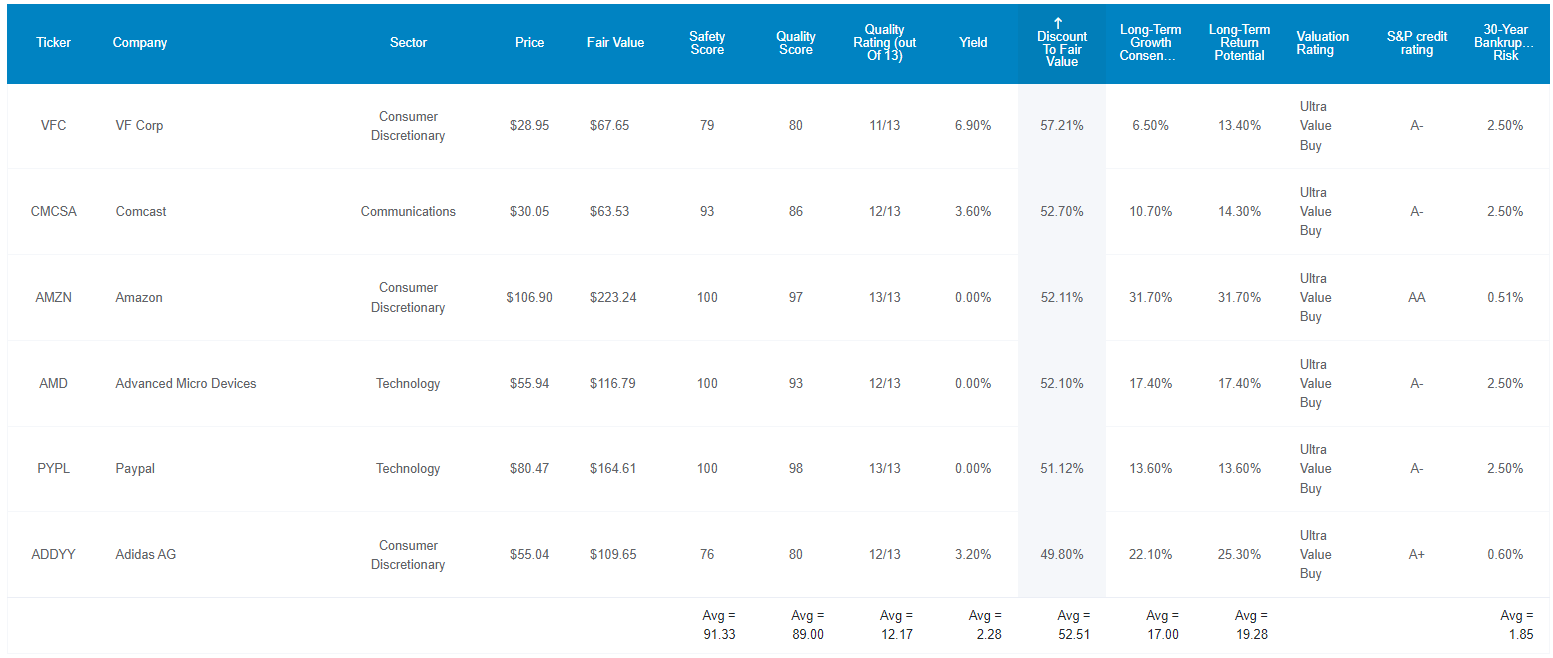
Here they are in order of most to least undervalued.
Tax Implications
- Adidas is a German company
- 26.375% dividend withholding
- own in a taxable account to qualify for the tax credit and recoup the withholding
- in retirement accounts the withholding can’t be recouped
FAST Graphs Up Front
Again, in order of most to least undervalued.
V.F. Corp 2025 Consensus Total Return Potential
FAST Graphs, FactSet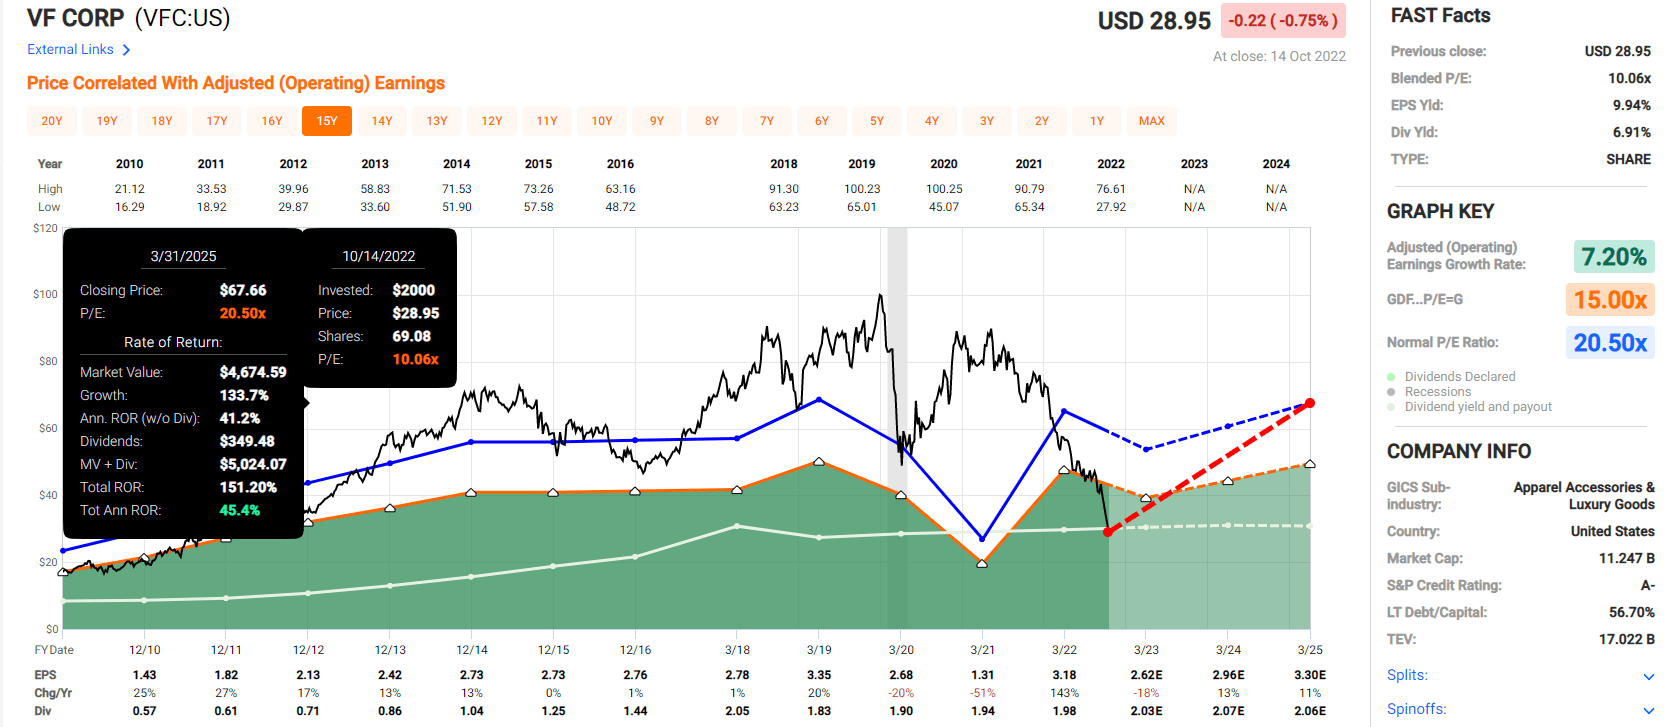
Comcast 2024 Consensus Total Return Potential
FAST Graphs, FactSet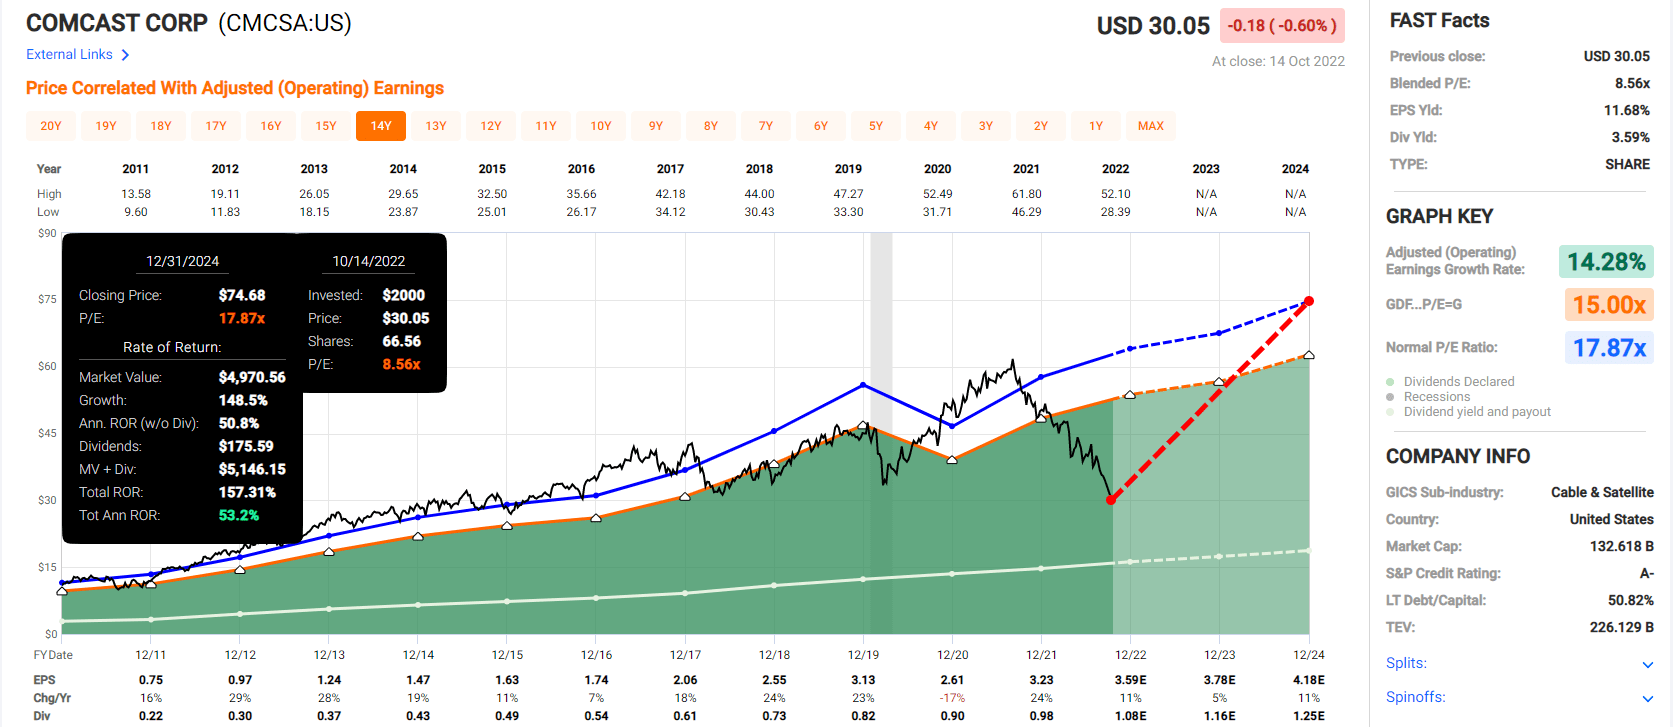
Amazon 2024 Consensus Total Return Potential
FAST Graphs, FactSet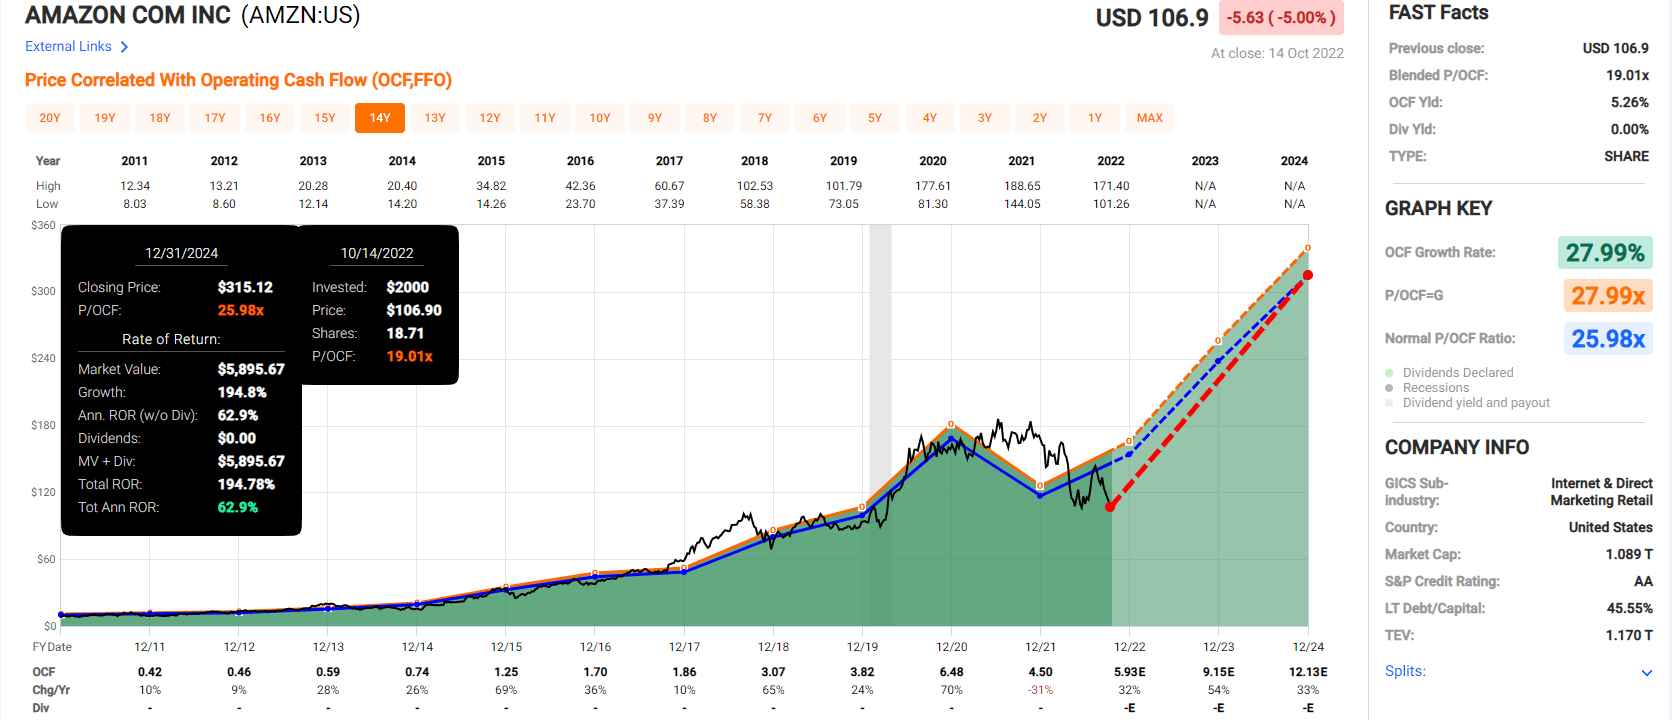
AMD 2024 Consensus Total Return Potential
FAST Graphs, FactSet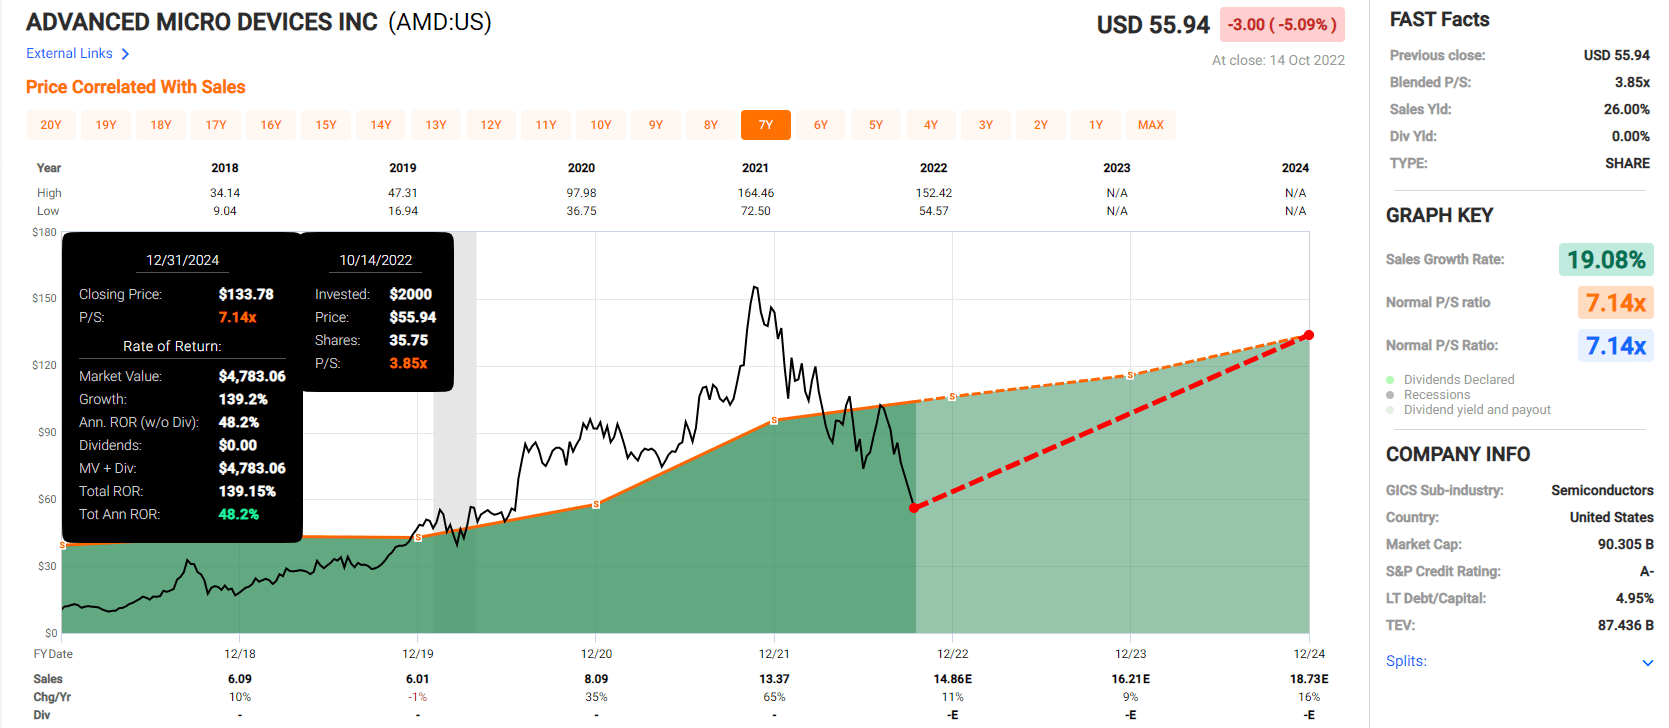
PayPal 2024 Consensus Total Return Potential
FAST Graphs, FactSet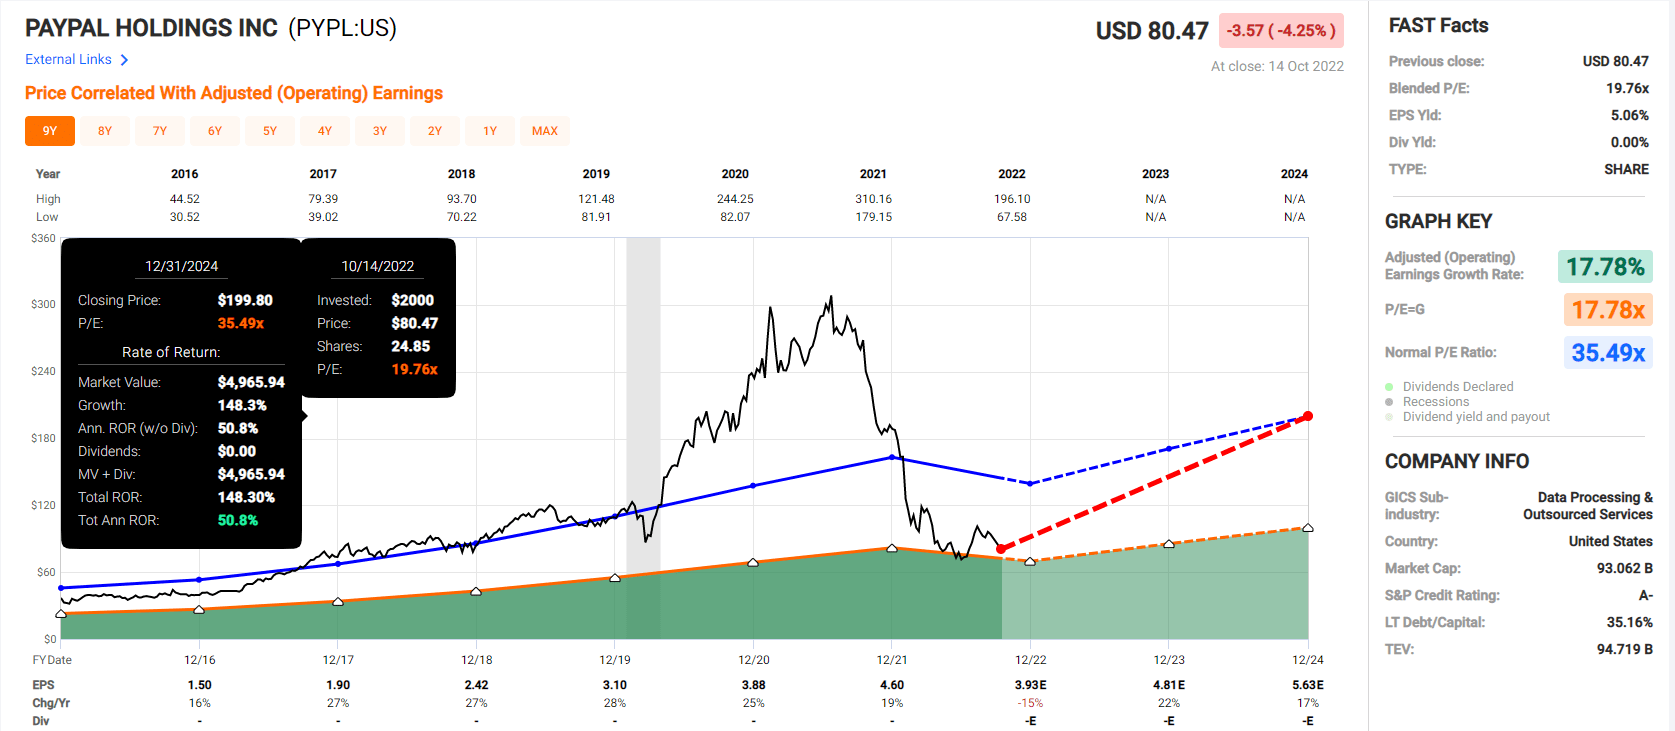
Adidas 2024 Consensus Total Return Potential
FAST Graphs, FactSet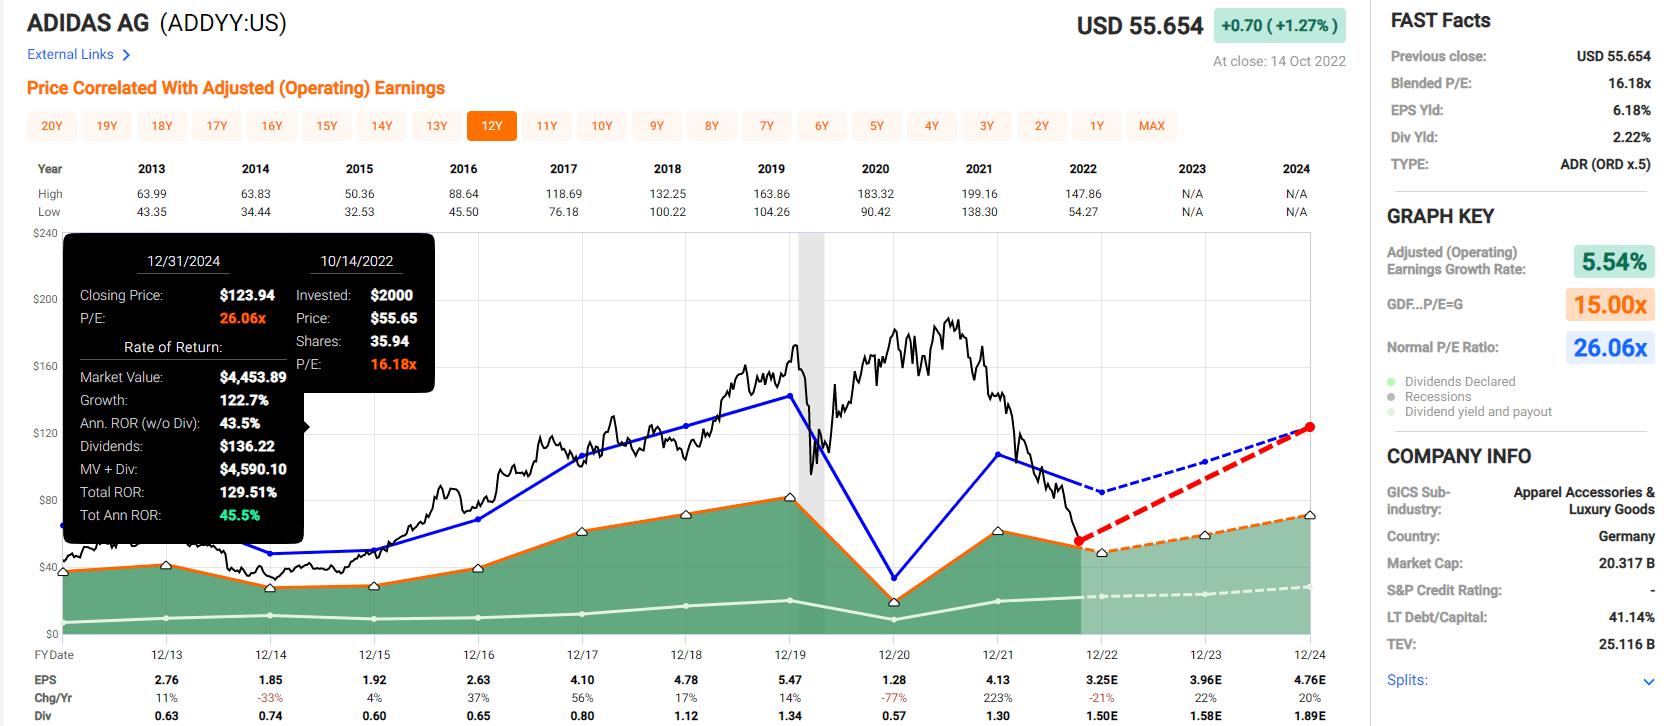
Now compare that to the S&P 500.
S&P 2024 Consensus Total Return Potential
(Source: FAST Graphs, FactSet Research)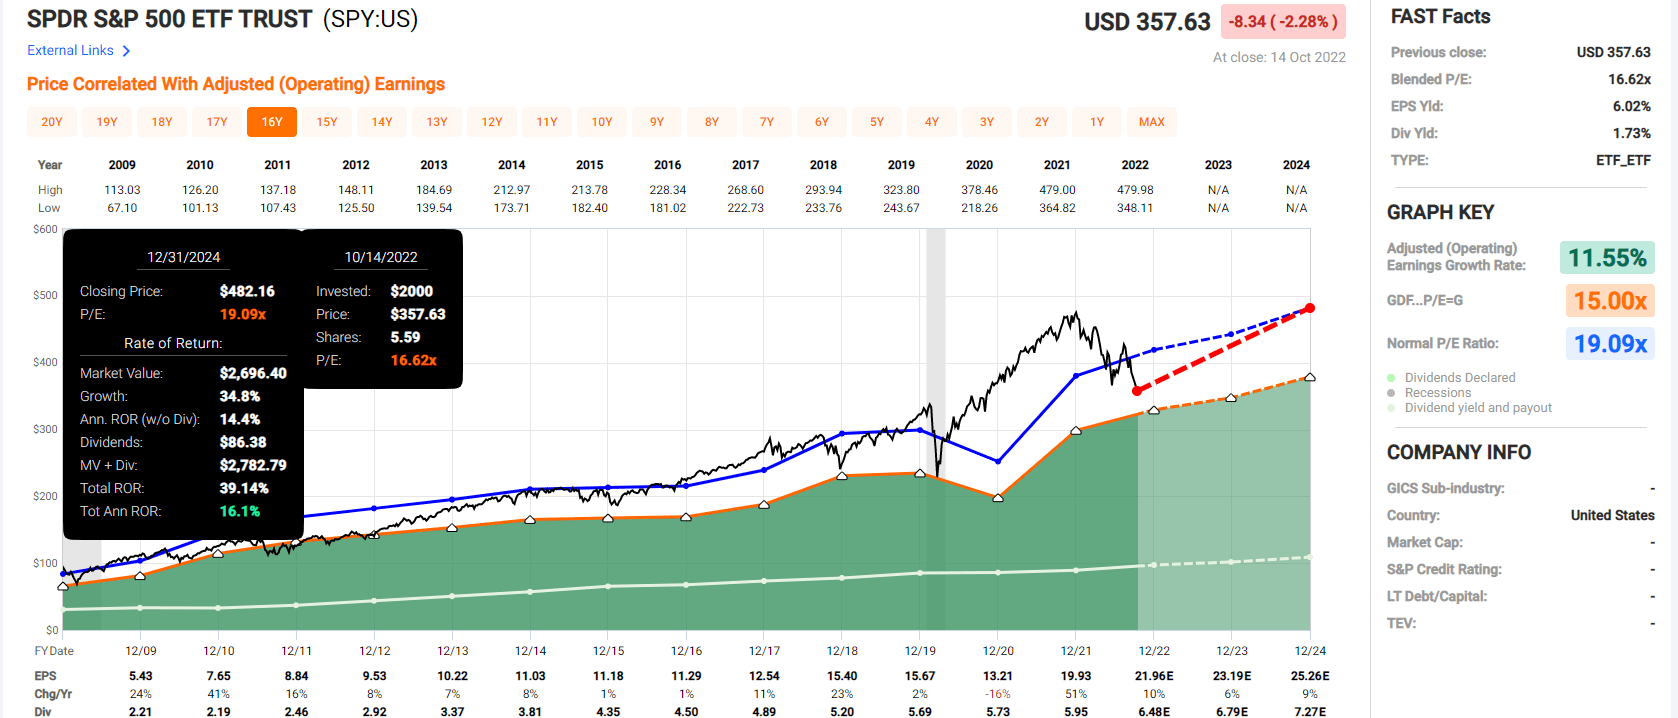
Over the next two years, analysts think the S&P could deliver 40% returns or 16% annually.
- these six A-rated 50% blue-chip bargains 153% total return potential through 2024
- 51% annual return potential through 2024
- 4X better consensus return potential than the S&P 500
But my goal isn’t to help you earn potential 150% returns in just over two years. My goal is to help you achieve life-changing income and wealth over the long-term.
So here’s why it’s worth considering these 6 A-rated 50% undervalued blue-chip bargains.
These Aren’t Value Traps
(Source: Dividend Kings Zen Research Terminal)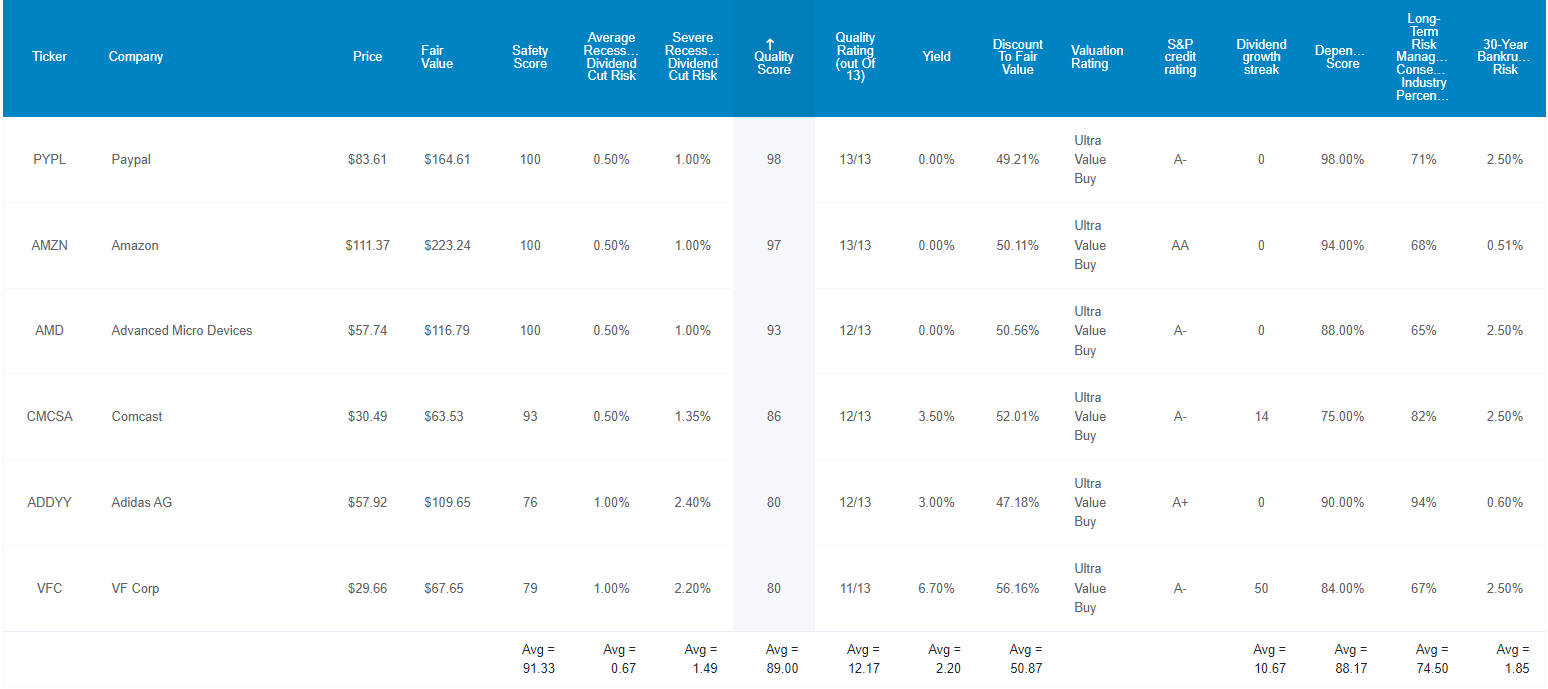
These aren’t just blue-chips, they are Super SWAN quality blue-chips, some of the world’s highest quality and most dependable companies. How can we tell? By comparing them to the dividend aristocrats, the bluest of blue-chips.
Safety And Quality Compared To Dividend Aristocrats
| Metric | Dividend Aristocrats | 6 A-Rated 50% Blue-Chip Discounts |
Compared To Aristocrats |
| Quality | 87% | 89% | 102% |
| Safety | 90% | 91% | 101% |
| Average Recession Dividend Cut Risk | 0.5% | 0.5% | 100% |
| Severe Recession Dividend Cut Risk | 1.50% | 1.45% | 97% |
| Dependability | 84% | 88% | 105% |
| Dividend Growth Streak (Years) | 44.8 | 32.0 | 71% |
| Long-Term Risk Management Industry Percentile | 67% | 75% | 112% |
| Average Credit Rating | A- Stable | A- Stable | NA |
| Average Bankruptcy Risk | 3.04% | 1.85% | 61% |
| Average Return On Capital | 105% | 67% | 64% |
| Average ROC Industry Percentile | 83% | 82% | 99% |
| 13-Year Median ROC | 89% | 56% | 63% |
| Forward PE | 17.9 | 13.2 | 74% |
| Discount To Fair Value | 12% | 51% | 425% |
| DK Rating | Good Buy | Ultra Value Buy | NA |
| Yield | 2.8% | 2.2% | 79% |
| LT Growth Consensus | 8.6% | 17.0% | 198% |
| Total Return Potential | 11.4% | 19.2% | 168% |
| Risk-Adjusted Expected Return | 7.7% | 12.8% | 166% |
| Inflation & Risk-Adjusted Expected Return | 5.5% | 10.6% | 192% |
| Conservative Years To Double | 13.0 | 6.8 | 52% |
| Average | 123% |
(Source: Dividend Kings Zen Research Terminal)
Ben Graham considered a 20+ year dividend growth streak an important sign of excellent quality. The blue-chips that pay dividends here average a streak of 32 years.
Their average dividend cut risk in an average recession is about 0.5%.
Their average dividend cut risk in a severe Great Recession/Pandemic level downturn is approximately 1.45%.
Joel Greenblatt considers return on capital or ROC his gold standard proxy for quality and moatiness.
- ROC = annual pre-tax profits/the cost of running the business
- S&P 500 ROC is 14.6%
These A-rated Ultra value blue-chips average an ROC of 67%, or nearly 5X better than the S&P 500.
They have ROC in the 82nd percentile of their industry peers, a wide moat.
Their 13-year median ROC is 56%, indicating a wide and stable or improving moat.
S&P estimates their average 30-year bankruptcy risk at 1.85%, an A- stable credit rating.
S&P also rates their long-term risk management as 75th percentile out of 8,000 companies it rates.
- based on 1,000 metrics
- in 30 major categories
- and 130 subcategories
- including supply chain management, R&D innovation efficiency, labor relations, climate change adaptation, and crisis management
Long-Term Risk Management Is The 110th Best In The Master List (78th Percentile)
| Classification | Average Consensus LT Risk-Management Industry Percentile |
Risk-Management Rating |
| S&P Global (SPGI) #1 Risk Management In The Master List | 94 | Exceptional |
| Foreign Dividend Stocks | 76 |
Good |
| 6 A-Rated 50% Discounted Blue-Chips | 75 |
Good |
| Strong ESG Stocks | 73 |
Good |
| Ultra SWANs | 70 | Good |
| Low Volatility Stocks | 68 | Above-Average |
| Dividend Aristocrats | 67 | Above-Average |
| Dividend Kings | 63 | Above-Average |
| Master List average | 62 | Above-Average |
| Hyper-Growth stocks | 61 | Above-Average |
| Monthly Dividend Stocks | 60 | Above-Average |
| Dividend Champions | 57 | Average bordering on above-average |
(Source: DK Research Terminal)
These Ultra-Value blue-chips have risk-management consensus is in the top 22% of the world’s highest quality companies and similar to that of such other blue-chips as
- Federal Realty Investment Trust (FRT) Ultra SWAN dividend king
- Canadian National Railway (CNI) Ultra SWAN global aristocrat
- Novo Nordisk (NVO) Ultra SWAN global aristocrat
- Texas Instruments (TXN) Ultra SWAN
- Royal Bank of Canada (RY) Ultra SWAN
The bottom line is that all companies have risks, and these Ultra Value blue-chips are good at managing theirs.
How We Monitor These Ultra Value Blue-Chips’ Risk Profile
- 238 analysts
- 4 credit rating agencies
- 174 experts who collectively know this business better than anyone other than management
- and the bond market for real-time fundamental risk assessment
When the facts change, I change my mind. What do you do, sir?” – John Maynard Keynes
There are no sacred cows at iREIT or Dividend Kings. Wherever the fundamentals lead, we always follow. That’s the essence of disciplined financial science, the math behind retiring rich and staying rich in retirement.
Now that you know why these are six of the safest A-rated Ultra Value blue-chips on earth, let’s take a look at why you might want to buy some today.
Wonderful Companies At Wonderful Prices
(Source: Dividend Kings Zen Research Terminal)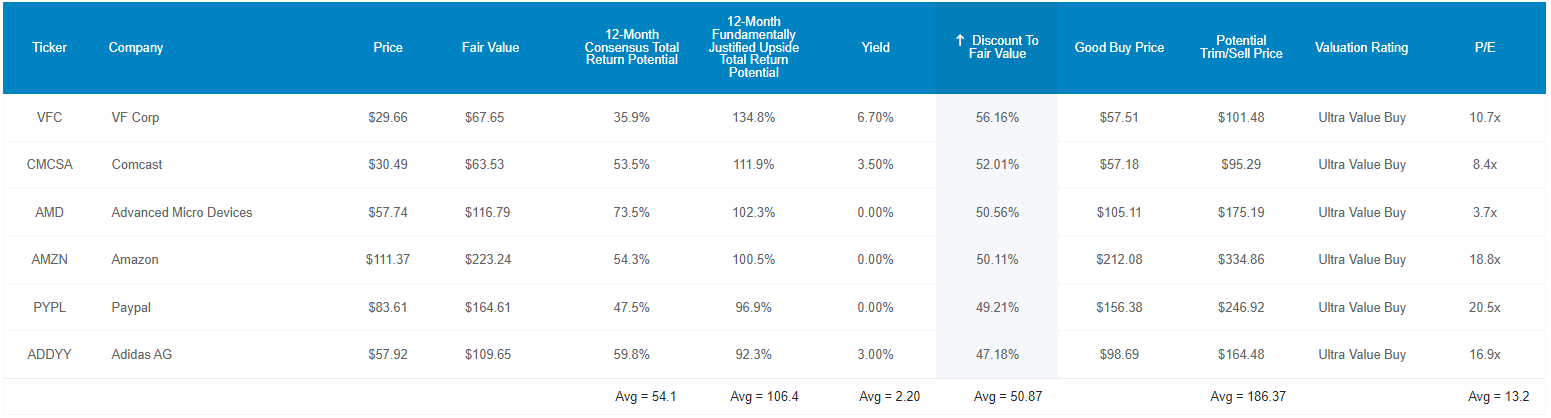
For context, the S&P is trading at 15.6X forward earnings, an 8% historical discount.
The dividend aristocrats are trading at 17.9X earnings, an 11% historical discount.
These Ultra-Value blue-chips are trading at 13.2X earnings a 50% historical discount.
That’s why analysts expect a 54% total return within 12 months. But they are so undervalued and growing so quickly that the 12-month fundamentally justified total return potential is 106%.
- if they all grow as expected and return to historical mid-range market-determined fair value you’ll make 106% in the next year.
But my goal isn’t to help you earn 54% returns in a year, or even double-your money. I want to help you potentially change your life by making potentially 100X or more in the coming decades.
How These 6 A-Rated 50% Buffett-Style Fat Pitches Could Help You Retire In Safety And Splendor
(Source: Dividend Kings Zen Research Terminal)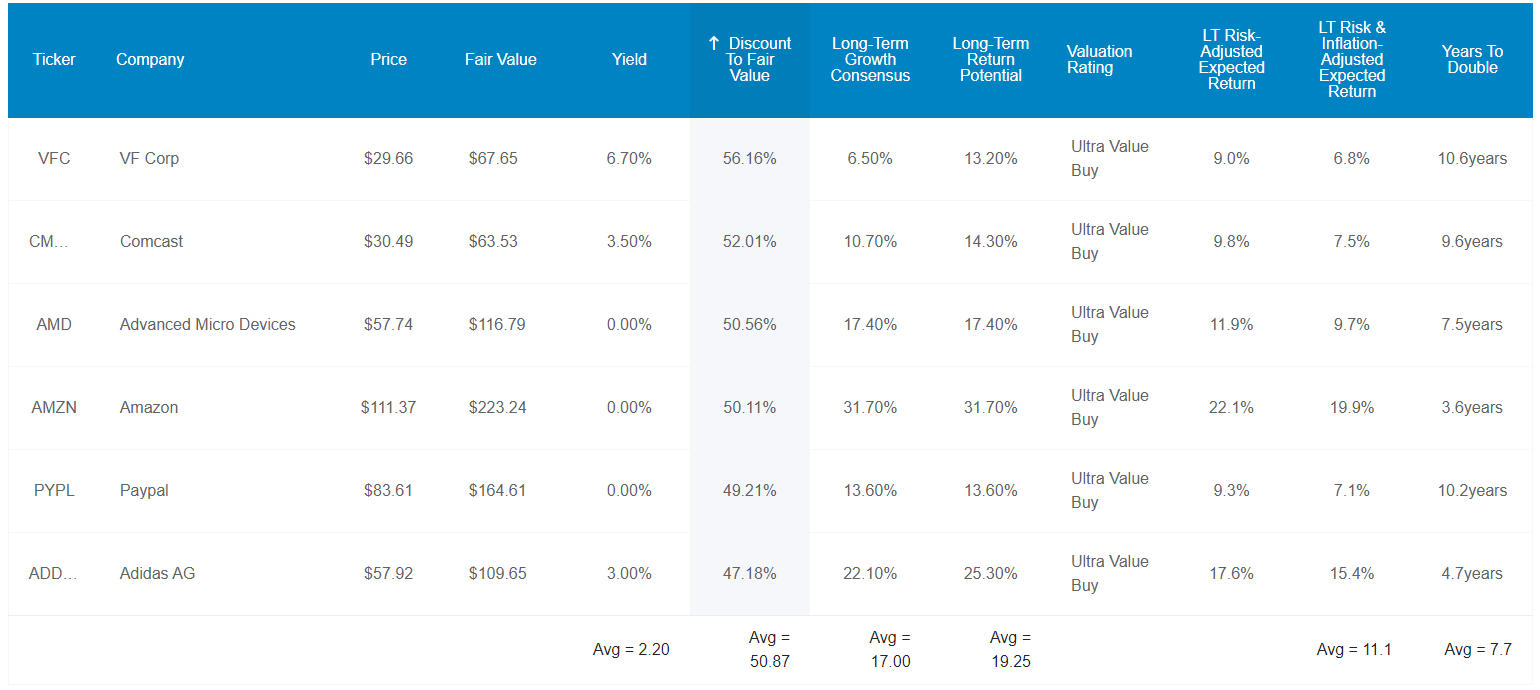
A 2.2% yield might not sound exciting, but remember that we’re talking about some very fast-growing companies here. In fact, analysts expect 17% long-term growth generating about 19.3% long-term annual total returns.
How impressive is that?
| Investment Strategy | Yield | LT Consensus Growth | LT Consensus Total Return Potential | Long-Term Risk-Adjusted Expected Return | Long-Term Inflation And Risk-Adjusted Expected Returns | Years To Double Your Inflation & Risk-Adjusted Wealth |
10-Year Inflation And Risk-Adjusted Expected Return |
| 6 A-Rated Ultra Value Blue-Chips | 2.2% | 17.1% | 19.3% | 13.5% | 11.2% | 6.4 | 2.90 |
| Schwab US Dividend Equity ETF | 3.8% | 8.50% | 12.3% | 8.6% | 6.3% | 11.4 | 1.85 |
| Nasdaq | 0.8% | 11.5% | 12.3% | 8.6% | 6.3% | 11.4 | 1.85 |
| Dividend Aristocrats | 2.8% | 8.7% | 11.5% | 8.1% | 5.8% | 12.5 | 1.75 |
| S&P 500 | 1.8% | 8.5% | 10.3% | 7.2% | 4.9% | 14.6 | 1.62 |
(Sources: DK Research Terminal, FactSet, Morningstar, YCharts)
The Nasdaq yields less than 1% and analysts expect just over 12% long-term returns.
The S&P yields under 2% and is expected to deliver just over 10% long-term returns.
These 6 A-rated Ultra Value blue-chips yield 2.2% and are expected to run circles around almost any investment strategy and even deliver Buffett-like returns for years or even decades.
Inflation-Adjusted Consensus Total Return Potential: $1,000 Initial Investment
| Time Frame (Years) | 8.0% CAGR Inflation-Adjusted S&P 500 Consensus | 9.2% Inflation-Adjusted Aristocrat Consensus | 17.1% CAGR Inflation-Adjusted 6 A-Rated Ultra Value Blue-Chip Consensus | Difference Between Inflation-Adjusted 6 A-Rated Ultra Value Blue-Chip Consensus And S&P Consensus |
| 5 | $1,468.65 | $1,553.50 | $2,199.95 | $731.31 |
| 10 | $2,156.93 | $2,413.37 | $4,839.80 | $2,682.87 |
| 15 | $3,167.77 | $3,749.18 | $10,647.33 | $7,479.56 |
| 20 | $4,652.33 | $5,824.36 | $23,423.63 | $18,771.30 |
| 25 | $6,832.64 | $9,048.16 | $51,530.91 | $44,698.27 |
| 30 | $10,034.74 | $14,056.34 | $113,365.63 | $103,330.89 |
(Source: DK Research Terminal, FactSet)
With such rapid growth even a modest investment today could turn into a life-changing fortune in the coming years and decades.
| Time Frame (Years) | Ratio Inflation-Adjusted 6 A-Rated Ultra Value Blue-Chip Consensus/Aristocrat Consensus | Ratio Inflation-Adjusted 6 A-Rated Ultra Value Blue-Chip Consensus vs. S&P consensus |
| 5 | 1.42 | 1.50 |
| 10 | 2.01 | 2.24 |
| 15 | 2.84 | 3.36 |
| 20 | 4.02 | 5.03 |
| 25 | 5.70 | 7.54 |
| 30 | 8.07 | 11.30 |
(Source: DK Research Terminal, FactSet)
And it means potentially much more money than investing in the aristocrats and S&P 500.
- a lot more income too as we’ll soon see
This sounds amazing, but what evidence is there that these Ultra Value blue-chips can really deliver Buffett-like returns over the long-term?
Historical Returns Since April 1999 (Equal Weighting, Annual Rebalancing)
The future doesn’t repeat, but it often rhymes. – Mark Twain
In our case, “past performance is no guarantee of future results.”
Still, studies show that blue chips with relatively stable fundamentals offer predictable returns based on yield, growth, and valuation mean reversion over time.
Bank of America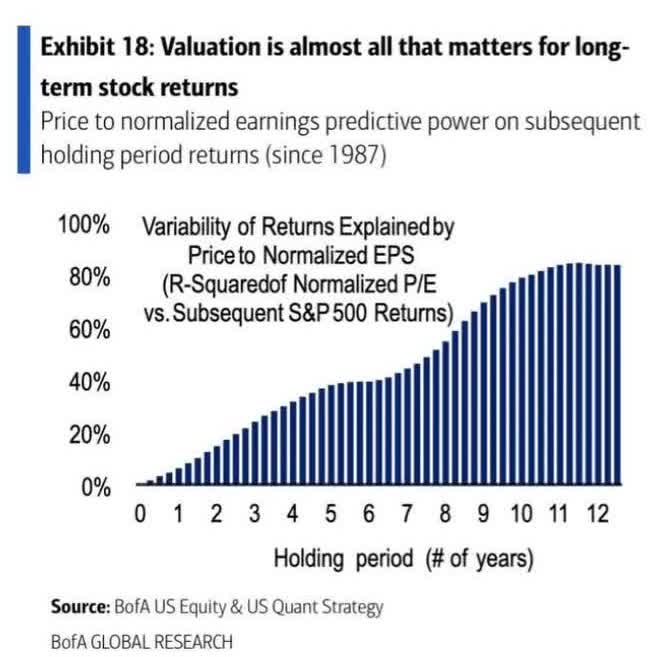
22 years is a time frame in which 91% of total returns are due to fundamentals, not luck.
(Source: Portfolio Visualizer Premium)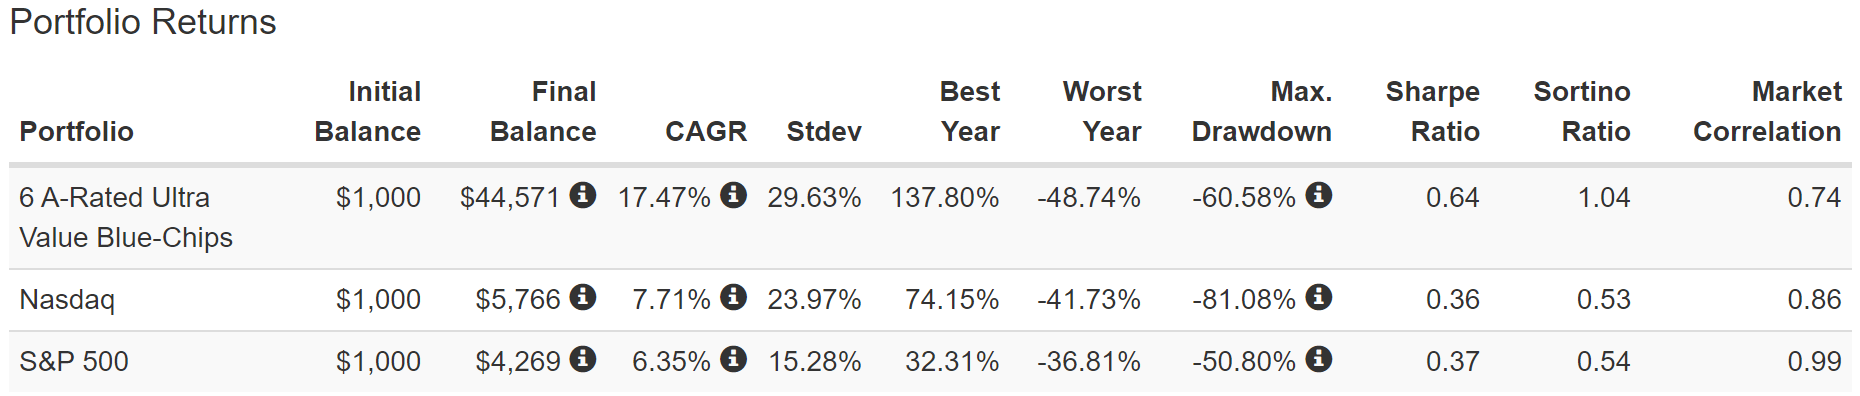
Can these A-rated ultra value blue-chips run circles around the S&P and Nasdaq? That’s what they’ve been doing for decades.
(Source: Portfolio Visualizer Premium)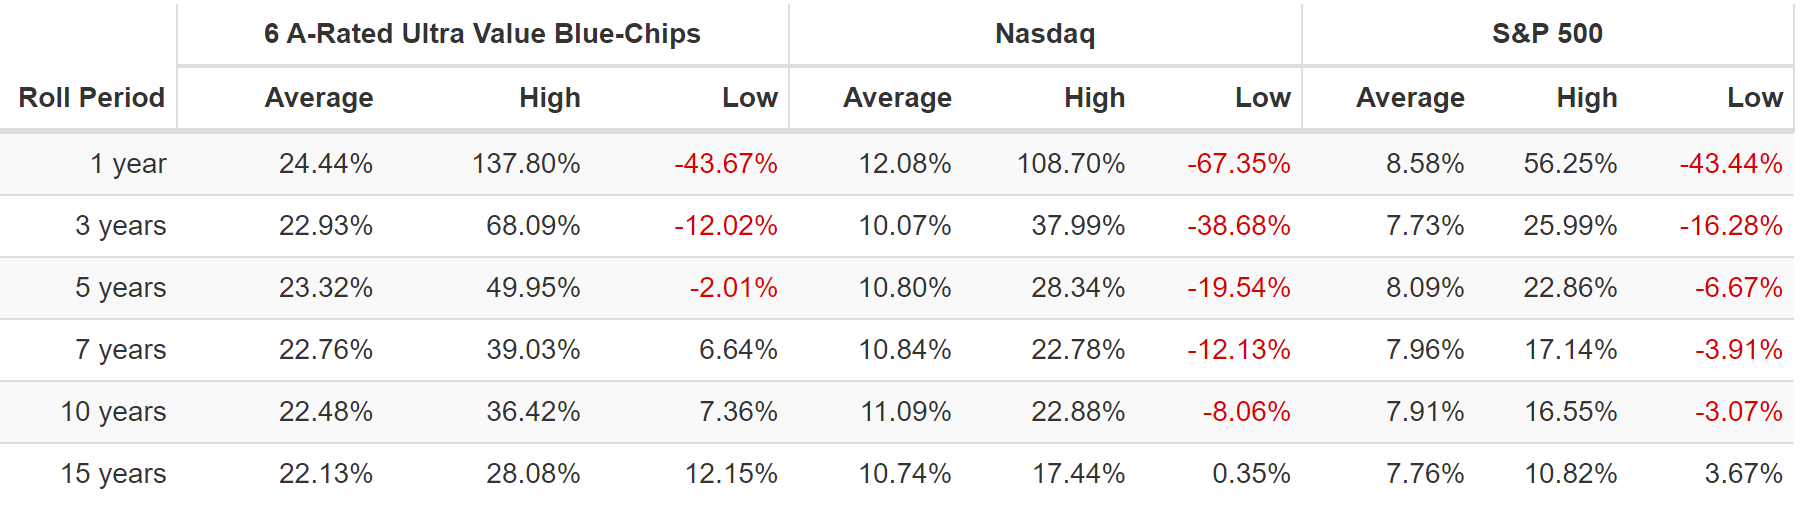
In fact, they’ve been delivering very consistent 22% annual returns, for 22 years, more than 2X more than the Nasdaq or S&P.
(Source: Portfolio Visualizer Premium)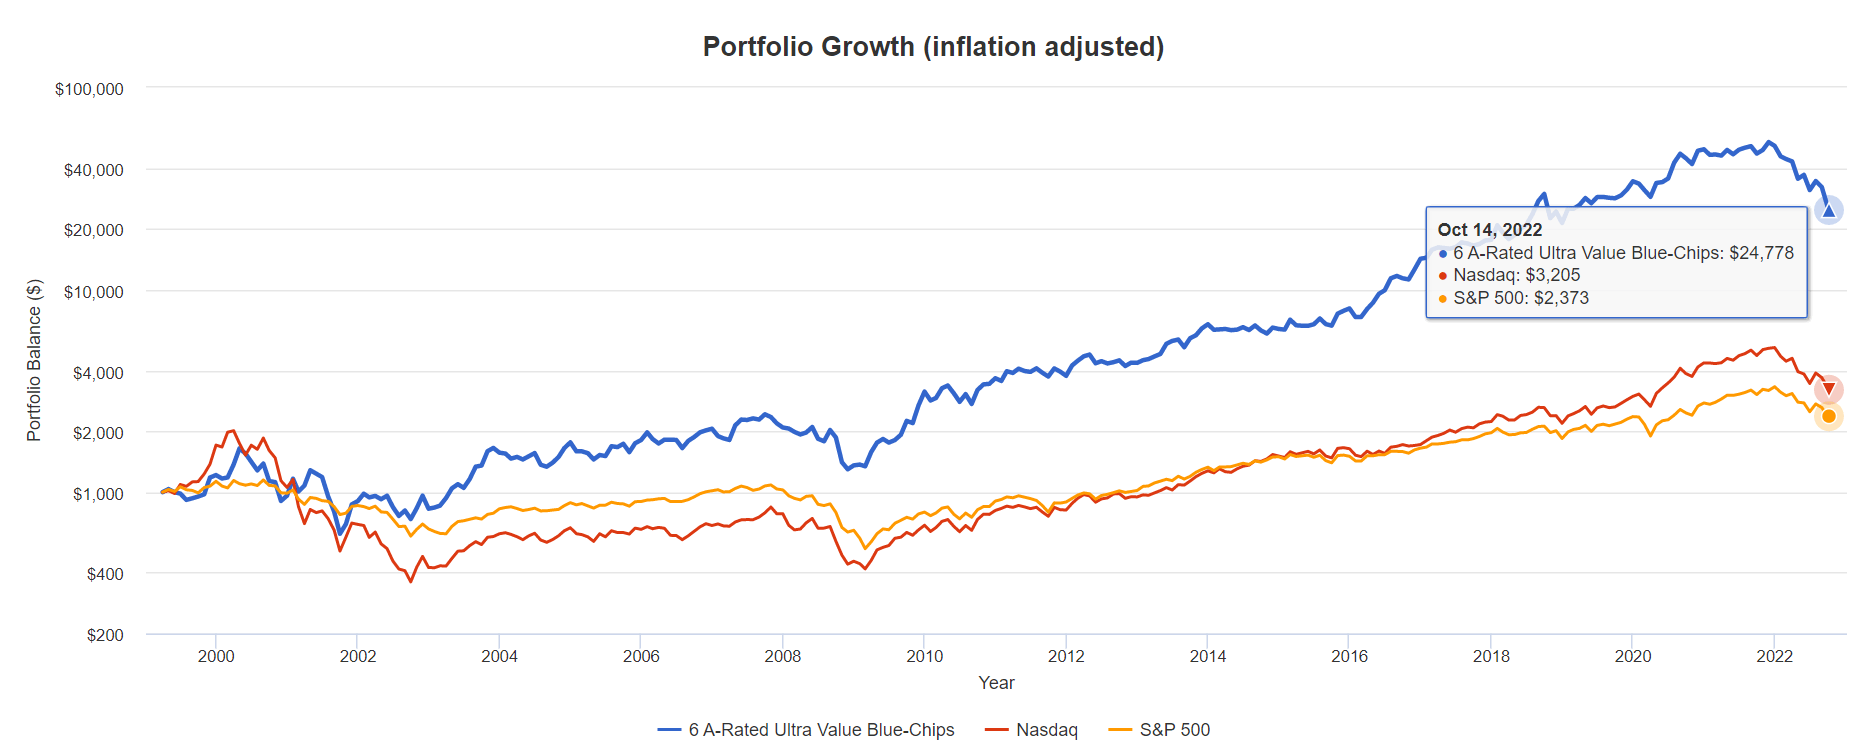
25X inflation-adjusted returns that have beaten the Nasdaq by 8X and the S&P by 10X, and that’s including the current bear market.
Didn’t I promise you superior income over time? Even though half of these stocks pay no dividends (yet)? Yes I did.
Income Growth That Can Help You Retire In Safety And Splendor
(Source: Portfolio Visualizer Premium)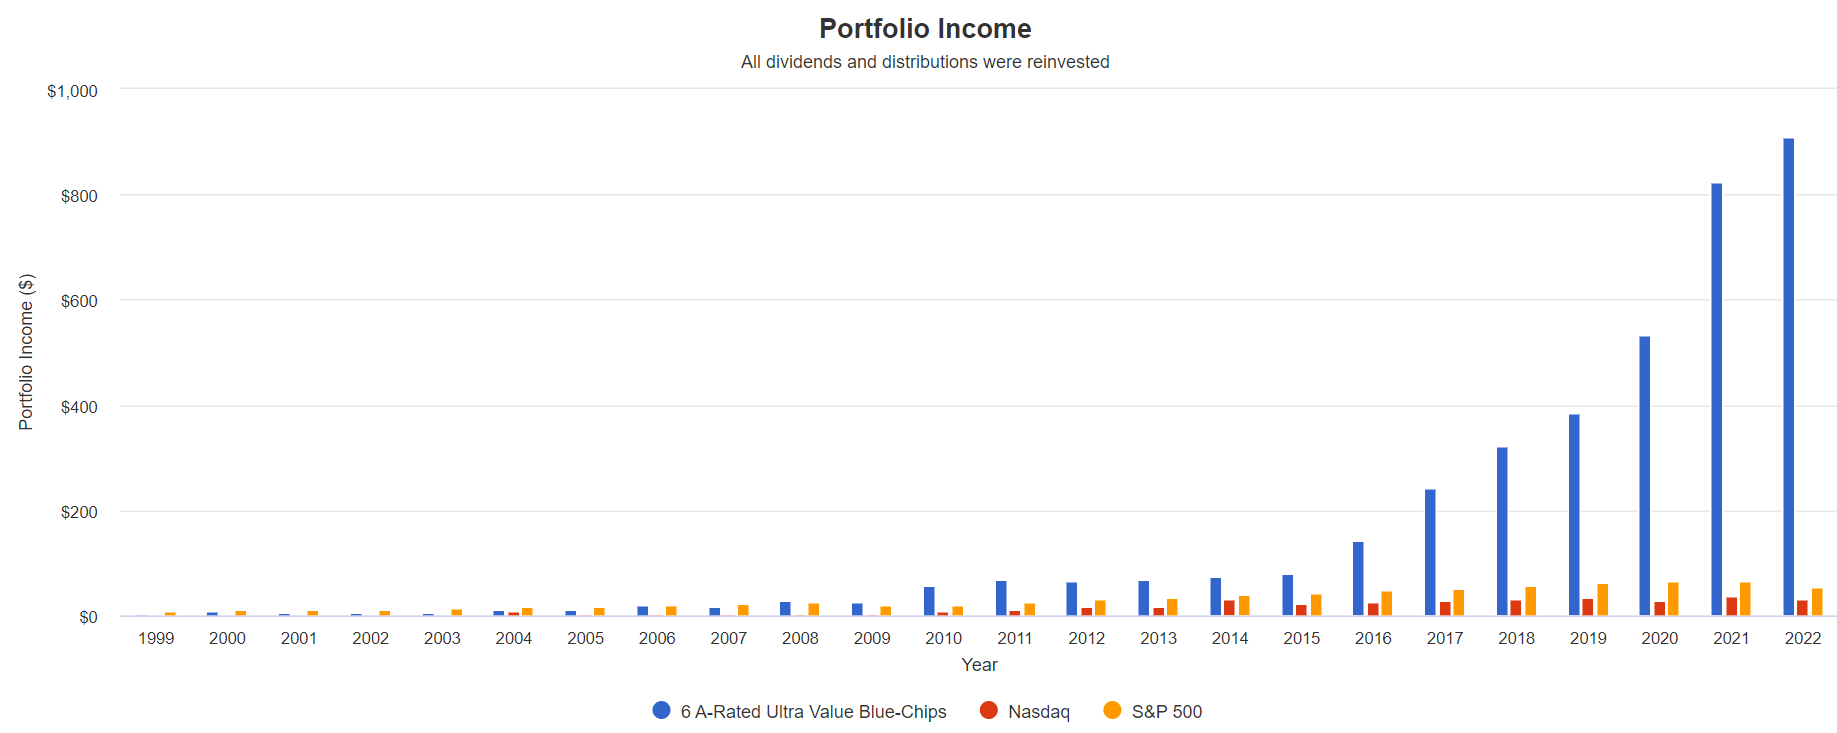
Cumulative Dividends Since 1999: $1,000 Initial Investment
| Metric | S&P 500 | 6 A-Rated Ultra Value Blue-Chips |
| Total Dividends | $803 | $4,218 |
| Total Inflation-Adjusted Dividends | $446.11 | $2,343.33 |
| Annualized Income Growth Rate | 8.1% | 28.2% |
| Total Income/Initial Investment % | 0.80 | 4.22 |
| Inflation-Adjusted Income/Initial Investment % | 0.45 | 2.34 |
| More Inflation-Adjusted Income Than S&P | NA | 5.25 |
| Starting Yield | 1.2% | 0.4% |
| Today’s Annual Dividend Return On Your Starting Investment (Yield On Cost) | 7.2% | 121.1% |
| 2022 Inflation-Adjusted Annual Dividend Return On Your Starting Investment (Inflation-Adjusted Yield On Cost) | 4.0% | 67.3% |
(Source: Portfolio Visualizer Premium)
The yield might not seem like much today, and it didn’t back in 1999 either. But today the inflation-adjusted yield on cost is 67% and investors have received 2.3X of their inflation-adjusted initial investment back in dividends that have grown at 28% annually.
- 5.3X more dividend than the S&P 500
Half of these stocks don’t pay dividends and yet they collectively deliver superior long-term income than almost any high-yield portfolio.
- thanks to annual rebalancing between high-yield and hyper-growth stocks
How To Turn These A-Rated Ultra Value Blue-Chips Into A ZEUS Ultra-Value Retirement Portfolio
- ZEUS = Zen Extraordinary Ultra Sleep Well At Night
- a recession-optimized long-term portfolio strategy
- designed to deliver high income, market-like returns, and 33% lower volatility than the S&P, alone with 33% to 66% smaller peak declines in even the most severe market crashes
Investing all of your money into six companies is not something that most investors are comfortable with, especially not 50% tech exposure.
(Source: Portfolio Visualizer Premium)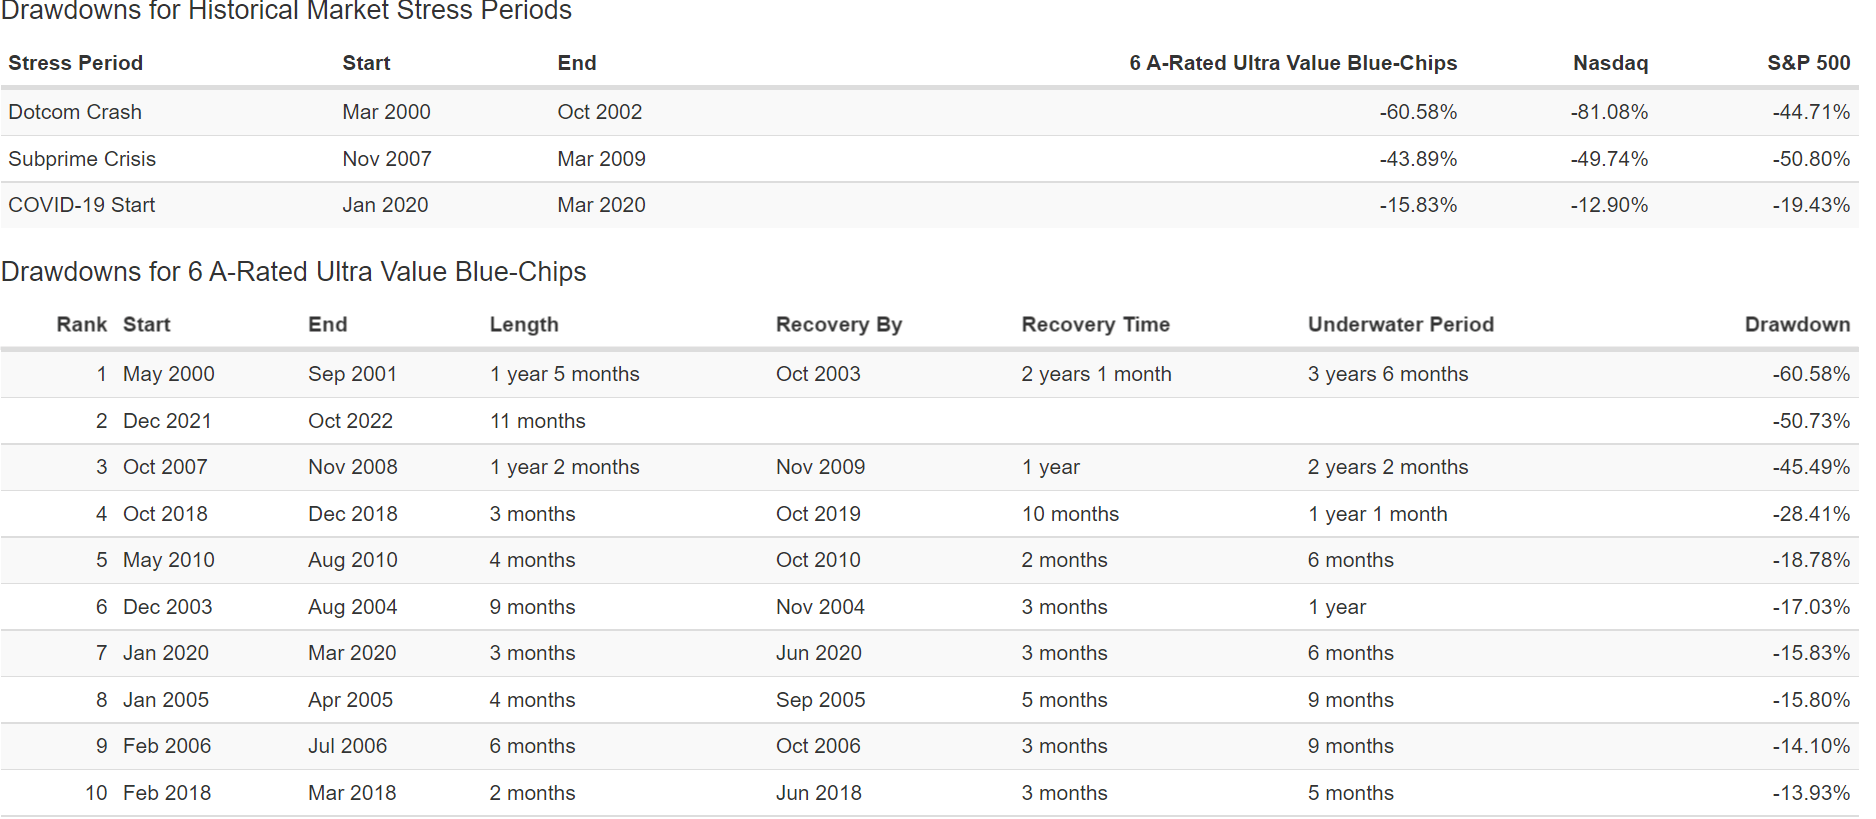
The volatility can be extreme, including three crashes over the last two decades, including two 50+% declines.
So here’s how to turn these six A-rated Ultra Value blue-chips into a diversified and prudently diversified high-yield deep value income growth portfolio.
- 16.67% SCHD or VYM (gold standard high-yield ETFs)
- 16.67% QQQM (the best dividend growth stock in history)
- 16.67% EDV or TLT (historically the best recession hedge)
- 16.67% DBMF, PQTAX, or AMFAX (managed futures)
- 33.33% these 6 A-rated Ultra Value blue-chips (5.56% each)
DBMF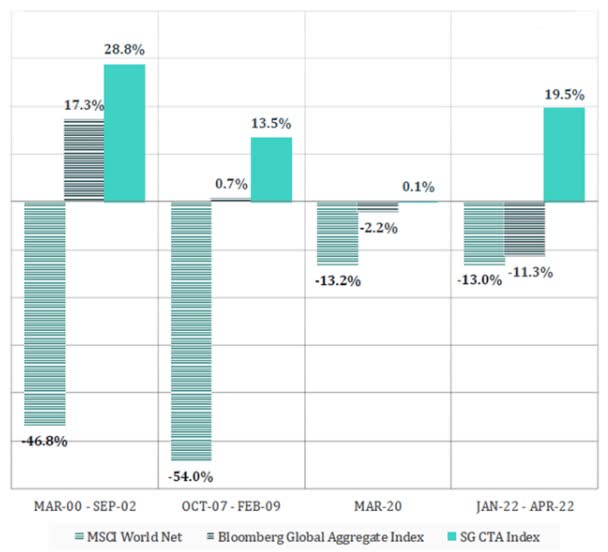
Managed futures, like bonds, tend to do well during bear markets. That includes stagflationary bear markets.
- Barclay’s index goes back to 1980
- and confirms this asset class worked well in 1980-1982’s bear market
- the 1987 mega crash
- the 1991 recessionary bear market
- the various mini-crises of the 1990s (Asian currency crash and Russian default)
| Metric | 60/40 | ZEUS Ultra Value Income Growth | X Better Than 60/40 |
| Yield | 2.3% | 3.8% | 1.63 |
| Growth Consensus | 5.1% | 9.0% | 1.76 |
| LT Consensus Total Return Potential | 7.4% | 12.8% | 1.72 |
| Risk-Adjusted Expected Return | 5.2% | 9.0% | 1.72 |
| Safe Withdrawal Rate (Risk And Inflation-Adjusted Expected Returns) | 2.9% | 6.7% | 2.29 |
| Conservative Time To Double (Years) | 24.7 | 10.8 | 2.29 |
(Source: Portfolio Visualizer Premium)
Far better yield than a 60/40 with long-term consensus return potential that’s better than the S&P and even the Nasdaq.
A consensus safe withdrawal rate that’s almost 2X better than the 4% rule.
Inflation-Adjusted Consensus Return Potential: $510K Average Retired Couple’s Savings
| Time Frame (Years) | 5.1% CAGR Inflation-Adjusted 60/40 | 10.5% Inflation-Adjusted ZEUS Ultra Value Income Growth Consensus | Difference Between ZEUS Ultra Value Income Growth Consensus and 60/40 Consensus |
| 5 | $654,320.24 | $841,339.01 | $187,018.77 |
| 10 | $839,480.35 | $1,387,943.78 | $548,463.43 |
| 15 | $1,077,037.23 | $2,289,669.12 | $1,212,631.88 |
| 20 | $1,381,818.17 | $3,777,231.27 | $2,395,413.11 |
| 25 | $1,772,846.27 | $6,231,239.25 | $4,458,392.98 |
| 30 | $2,274,527.85 | $10,279,577.78 | $8,005,049.93 |
(Source: DK Research Terminal, FactSet)
For the average retired couple this ZEUS portfolio could potentially deliver $8 million more inflation-adjusted wealth over 30 years.
| Time Frame (Years) |
Ratio ZEUS Ultra Value Income Growth Consensus Vs 60/40 Consensus |
| 5 | 1.29 |
| 10 | 1.65 |
| 15 | 2.13 |
| 20 | 2.73 |
| 25 | 3.51 |
| 30 | 4.52 |
(Source: DK Research Terminal, FactSet)
That’s almost 5X greater real wealth over a standard retirement time frame.
Historical Returns Since June 2019 (QQQ, SCHD, DBMF, EDV 6 A-Rated Ultra Value Blue-Chips)
(Source: Portfolio Visualizer Premium)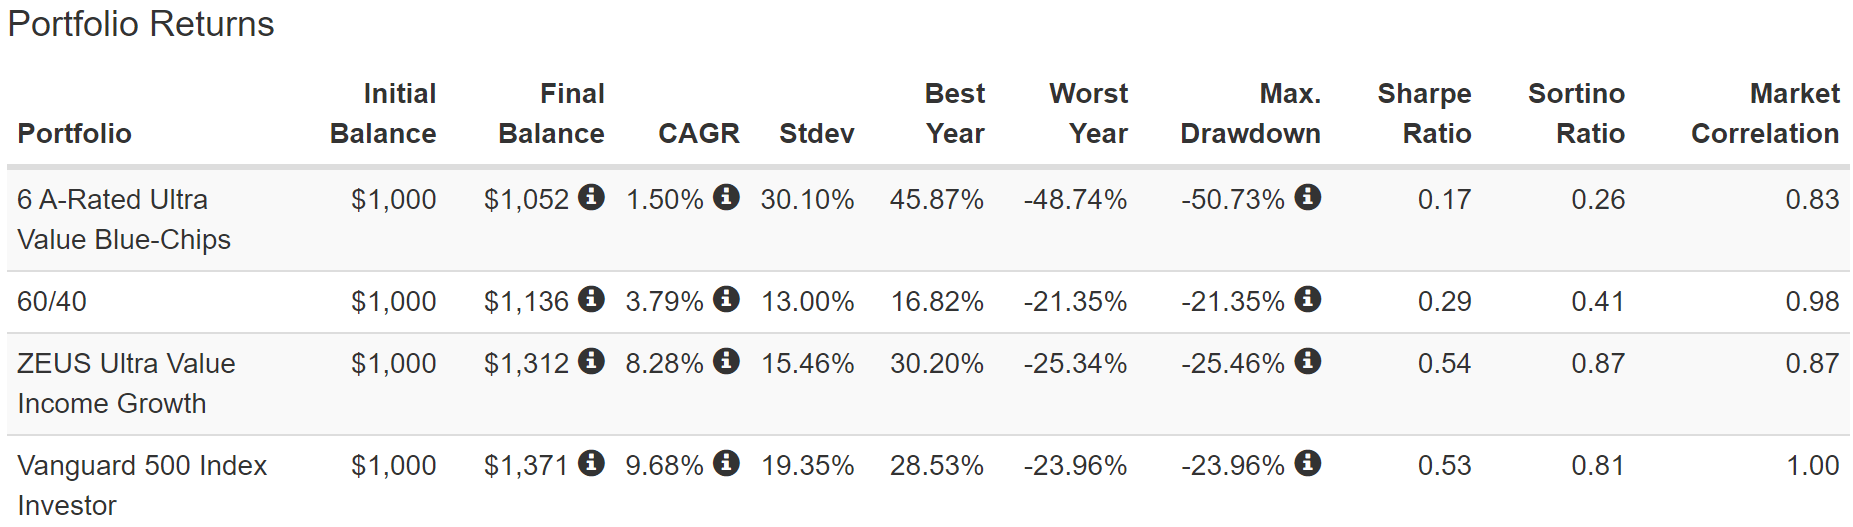
Thanks to a 50% bear market these blue-chips on their own have sucked over the last three years. A 60/40 hasn’t done much better. But ZEUS Ultra Value has delivered nearly market like returns, and with less annual volatility and higher negative-adjusted total returns (Sortino ratio).
The peak decline is half as bad as the blue-chips on their own, even with 50% of the portfolio getting hammered by this stagflationary bear market.
Historical Returns Since January 2014 (QQQ, SCHD, PQTAX, EDV, 6 A-Rated Ultra Value Blue-Chips)
(Source: Portfolio Visualizer Premium)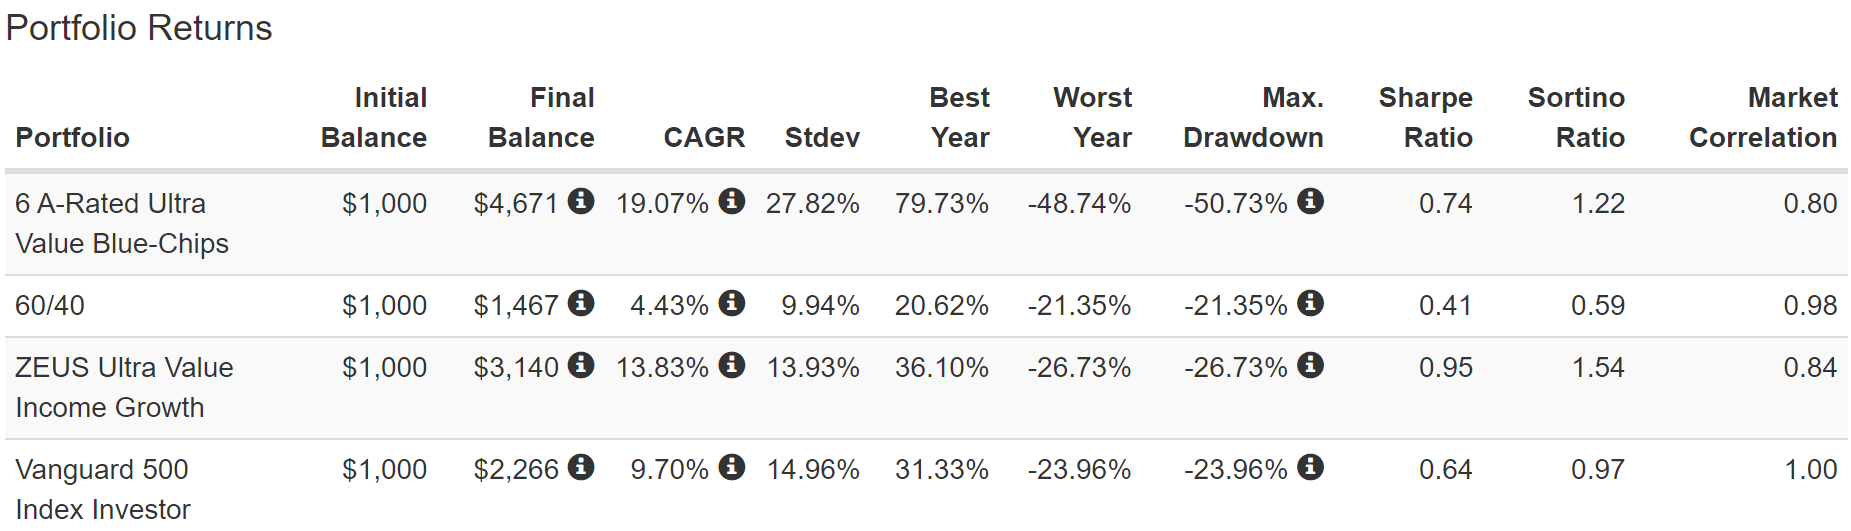
Looking back eight years we can see strong 14% annual returns than surpassed even the red hot S&P 500 but with slightly less annual volatility.
- 3X better returns than a 60/40 and nearly 3X better negative volatility-adjusted returns
Historical Returns Since August 2010 (QQQ, VYM, AMFAX, EDV, 6 A-Rated Ultra Value Blue-Chips)
(Source: Portfolio Visualizer Premium)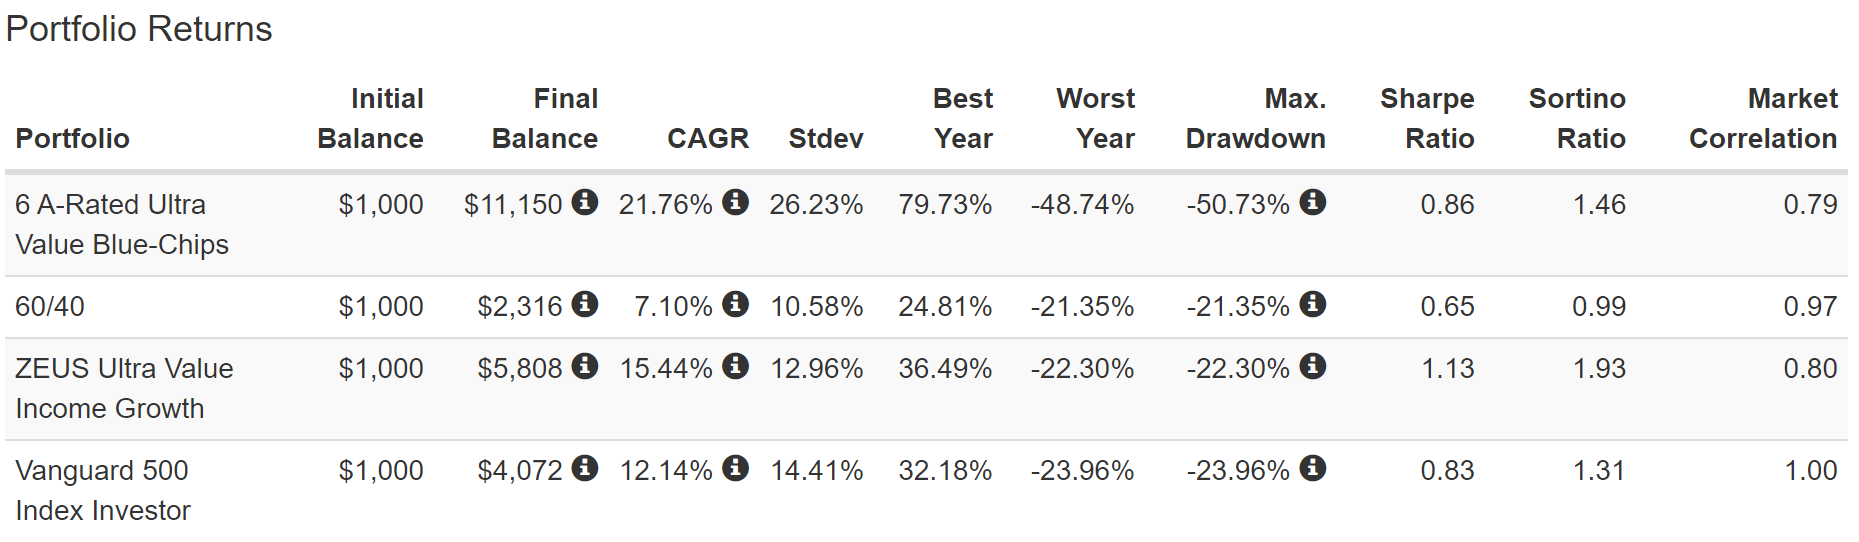
Looking back 12 years we can see market smashing returns and 2X the returns of a 60/40 but with lower volatility and 2X better negative volatility-adjusted returns.
Historical Returns Since March 2007 (QQQ, VYM, RYMTX, TLT, 6 A-Rated Ultra Value Blue-Chips)
(Source: Portfolio Visualizer Premium)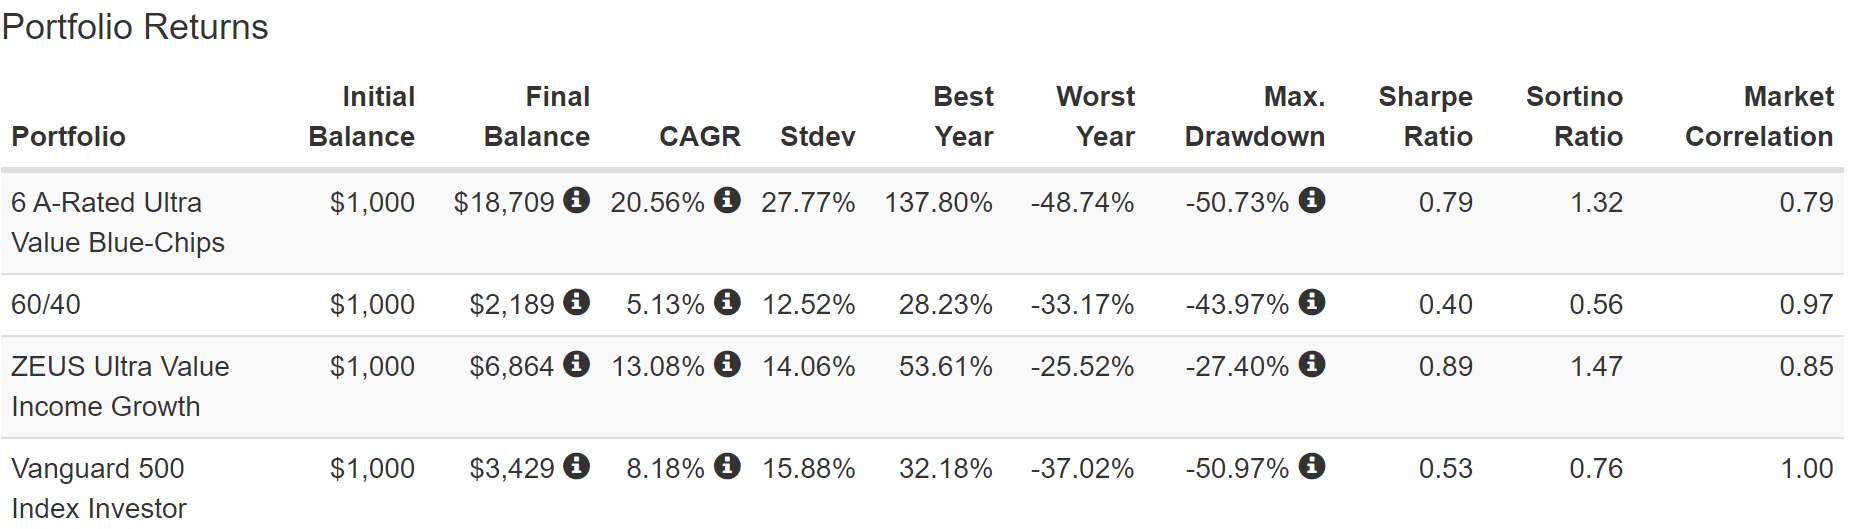
RYMTX is a 2-star rated managed futures fund that I think NO ONE SHOULD EVER BUY. RYMTX is the oldest managed futures fund, and I am using it here to show the returns of the overall ZEUS strategy during the Great Recession.
- the 2nd biggest market crash in US history
- the ultimate trial-by-fire for any sleep-well-at-night portfolio
Far better returns than the S&P 500 and 2.5X more than a 60/40 with a peak decline of 27%, far below that of a 60/40 or S&P 500.
In fact, on a negative-volatility-adjusted basis, this ZEUS portfolio beat even the 6 A-rated Ultra Value blue-chips themselves.
(Source: Portfolio Visualizer Premium)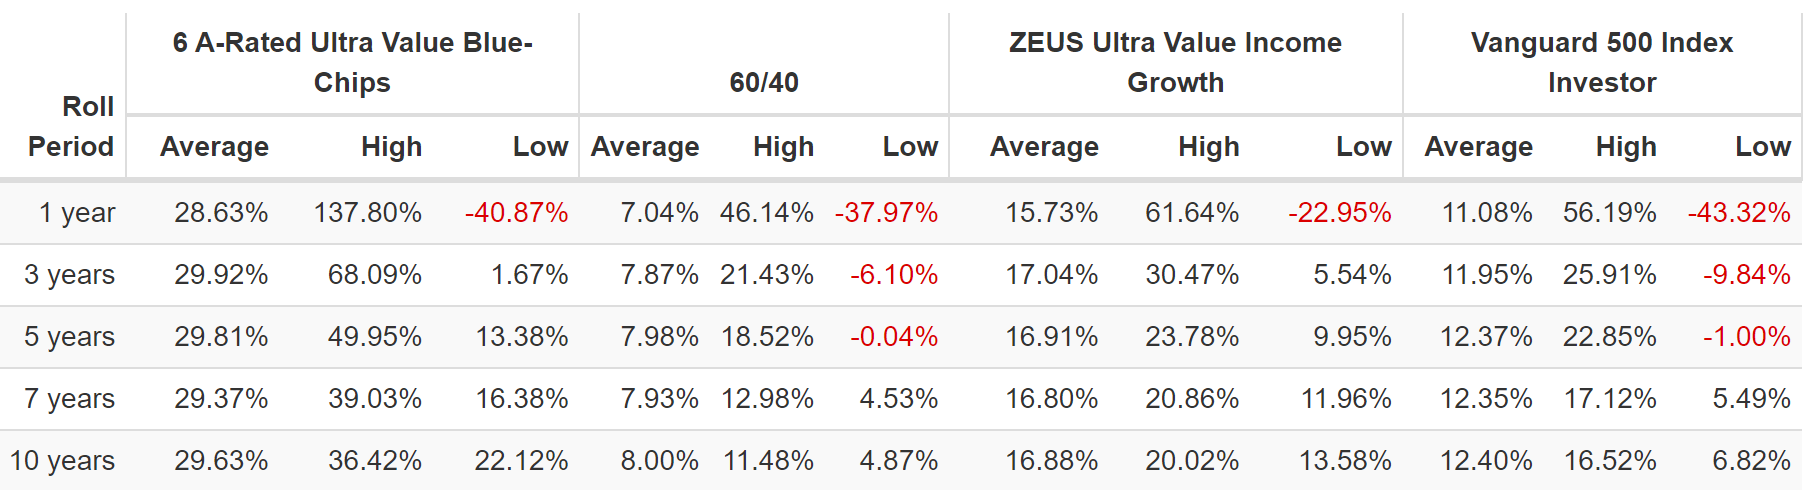
How many balanced portfolios can beat the S&P 500 over time? This one did, and is expected to keep doing so in the future.
(Source: Portfolio Visualizer Premium)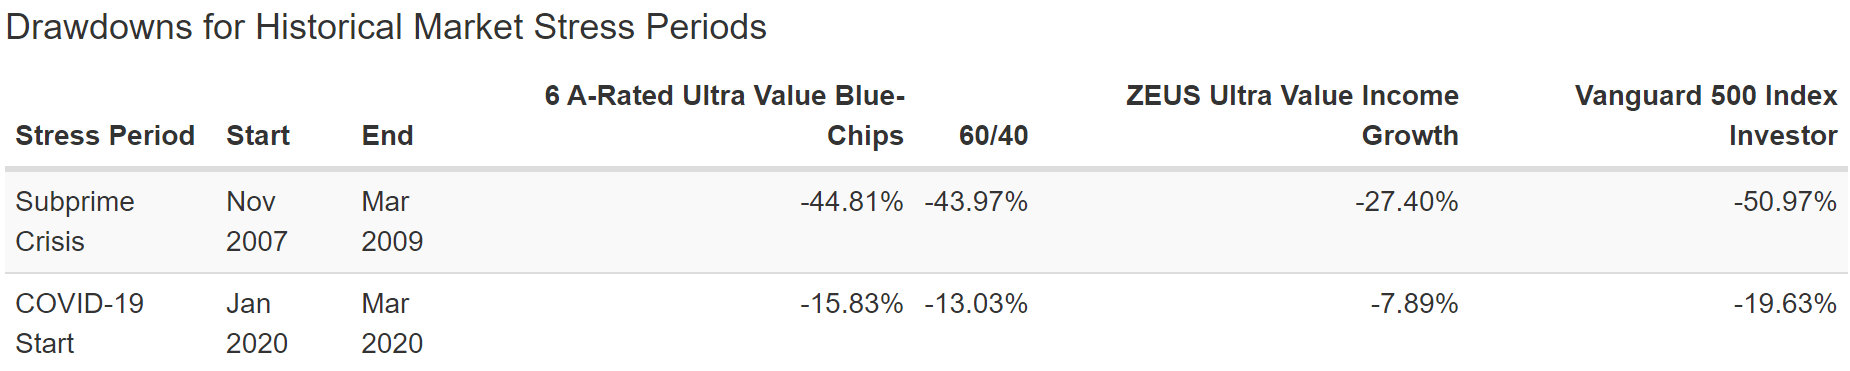
Half the declines of the market during even the 2nd biggest market crash in US history, and 1/3rd the peak decline during the Pandemic.
ZEUS During 2022’s Bear Market (QQQ, SCHD, DBMF, EDV, 6 A-Rated Ultra Value Blue-Chips)
(Source: Portfolio Visualizer Premium)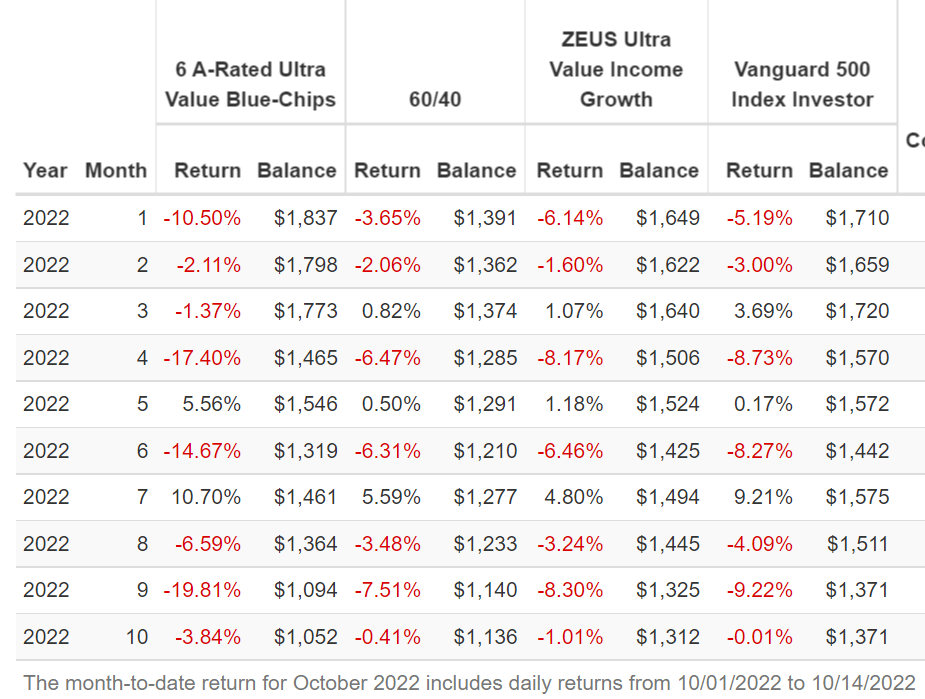
50% of this portfolio has been crushed by the stagflationary bear market. Without hedges or diversification it fell as much as 20% in September.
But with prudent asset allocation and risk-management? That decline was 8% in September 2022, basically the same as a 60/40.
ZEUS During The Pandemic Crash (QQQ, SCHD, DBMF, EDV, 6 A-Rated Ultra Value Blue-Chips)
(Source: Portfolio Visualizer Premium)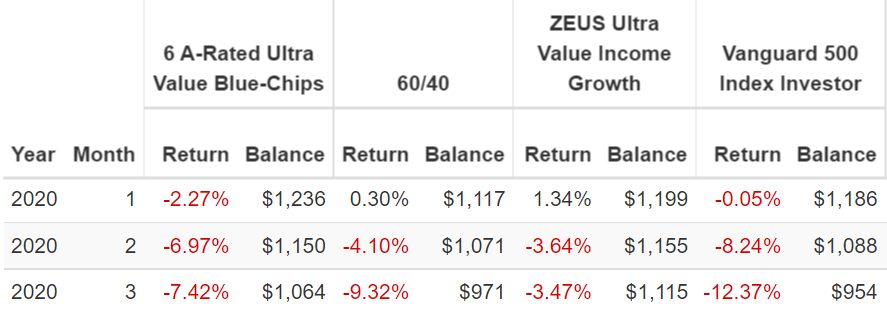
During the Pandemic ZEUS fell just 7%, 1/3rd as much as the Pandemic.
- rolling over a big market pothole in a Rolls Royce
ZEUS During The 2018 Bear Market (QQQ, SCHD, PQTAX, EDV, 6 A-Rated Ultra Value Blue-Chips)
(Source: Portfolio Visualizer Premium)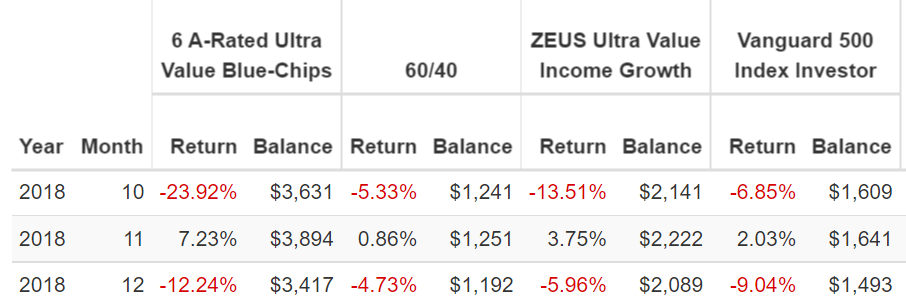
The 2018 bear market was a brutal time for these Ultra-Value blue-chips, which fell 24% in October 2018 alone. But thanks to the hedging power of prudent asset allocation, the pain was a lot less with ZEUS.
ZEUS During The 2011 Bear Market (QQQ, VYM, AMFAX, EDV, 6 A-Rated Ultra Value Blue-Chips)
(Source: Portfolio Visualizer Premium)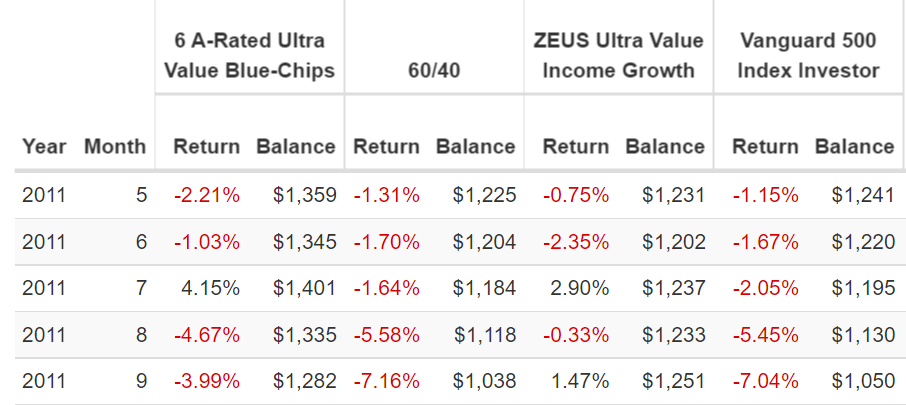
ZEUS was dead flat during the 21% 2011 bear market created by the debt-ceiling showdown and US credit downgrade.
ZEUS During The Great Recession (QQQ, VYM, RYMTX, TLT, 6 A-Rated Ultra Value Blue-Chips)
(Source: Portfolio Visualizer Premium)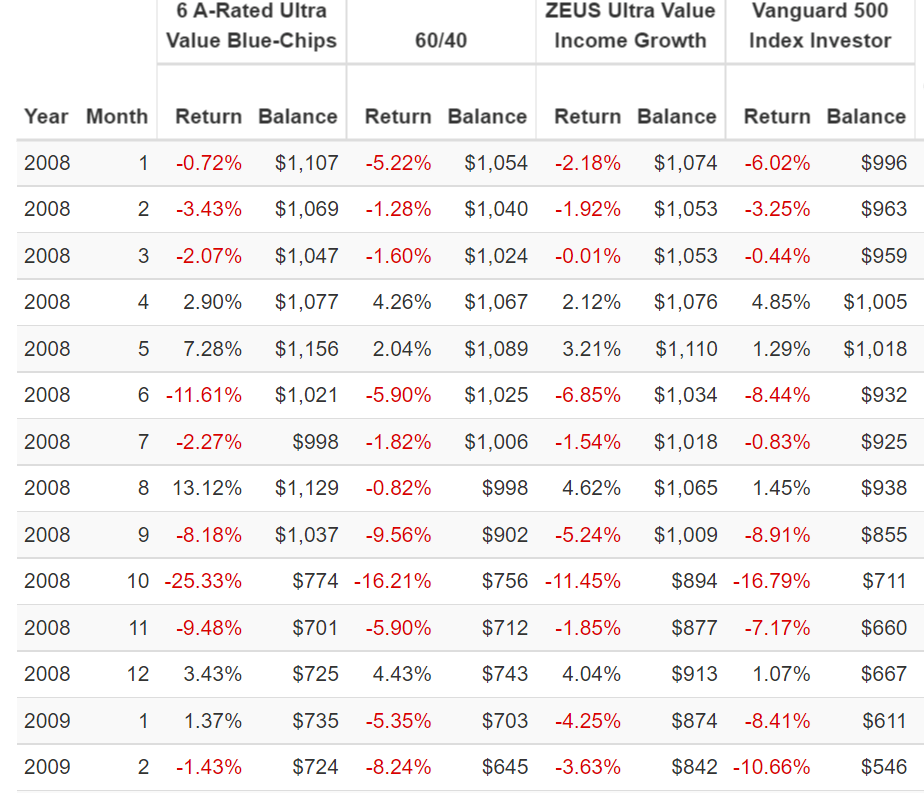
The Great Recession saw stocks fall as much as 17% in a single month, and high volatility blue-chips like these, fell as much as 25%. Yet even in October 2008, one of the most terrifying times in US market history, ZEUS did its job falling about 30% less than a 60/40 and 33% less than the S&P 500.
- 50% smaller decline than the blue-chips alone
This is the power of diversification and prudent risk-management. This is the power of ZEUS.
- higher yield
- better returns
- lower volatility
- 33% to 66% smaller peak declines in even the most extreme market crashes
This is how you can sleep well at night no matter what the economy or stock market do in the coming years and decades.
Bottom Line: Here Are 6 A-Rated 50% Off Blue-Chip Bargains To Buy Now
Volatility isn’t risk, it’s the source of future returns. – Joshua Brown, CEO Ritholtz Wealth Management
Market crashes, especially for high volatility blue-chips, can be terrifying.
But it’s precisely because these blue-chips are capable of falling 50% or even 60% that they deliver such remarkable Buffett-like returns over time.
The higher the volatility, the more extreme the crashes, and the better the blue-chip bargains. And as surely as day follows night, the higher the future returns.
Is this bear market over? Probably not. Stocks haven’t priced in a 2023 recession which now looks very likely.
- Bloomberg’s recession model says 100% chance of recession within 12 months
- Ned Davis Research’s model says 98%
- the Conference Board’s model says 96%
- 80% of CEOs according to Bloomberg’s survey expect a recession next year
- the bond market puts the 13-month recession probability at 76%
But guess what? Just because the bear market likely isn’t over yet doesn’t mean stocks are going to crash -60%, -70%, or -90% like some permabear doomsday prophets claim (and have claimed for the past 22 years in some cases).
- 13% to 20% further decline from here per the blue-chip consensus
So shouldn’t you just sit in cash and wait for the market to bottom at -35% to -40%? No.
Not when you can buy A-rated Ultra Value blue-chips at a 50% to 57% historical discount that could bottom a lot sooner than the market.
- MO bottomed at a 15% very safe yield in December 2008 and was up 9% by the time stocks stopped falling on March 9th, 2009
- Amazon bottomed in January 2002 and was up 60% by the time the S&P bottomed in October 2002
VFC, AMZN, AMD, PYPL, CMCSA, and ADDYY are six world-class companies that offer incredible and potentially life-changing opportunities RIGHT NOW.
- 2.2% very safe yield
- A- stable credit ratings
- 51% discount to fair value
- a forward PE of 13.2X
- 17% growth consensus
- 19.3% CAGR long-term return potential (similar to the last 23 years)
What if the economists are right and stocks fall another 20% from here?
What if these blue-chips also fall 20%, despite already being screaming bargains?
- then by waiting until bottom you MIGHT earn another 25% total returns IF and only if the economists are 100% correct and each blue-chip bottoms at the exact same time as the market
That’s not a 25% higher annual return, it’s 25% higher returns over decades.
- 0.8% CAGR higher returns over 30 years
When you can buy world-class quality and long-term income growth potential of 20+% right now, at a sky-high margin of safety of 50%? Do you really want to sit in cash hoping for MAYBE another 0.8% higher annual returns?
- risk 19% returns to try to earn an extra 1%
- risk not making $19 to try to earn an extra $1
That’s a terrible reward/risk trade-off when some of the world’s best A-rated Buffett-style Ultra Value blue-chips are offering slap you in the face “fat pitch” table-pounding opportunities.
I can’t promise you quick returns with any blue-chip, not even these 50% undervalued ones. But what I can say with very high confidence is that if you buy these A-rated blue-chips today you’re likely to be very glad you did in 5+ years.
And you’re likely to feel like a stock market genius in 10+ years, when they could deliver life-changing income growth and rich retirement wealth.
Be the first to comment