


anyaberkut/iStock via Getty Images
For now, the stock market is partying like the good times are back and will never end.
But we all know that at some point a recession is coming and with it a bear market.
Recession Watch
| Bonds | Yield |
| 3-Month Treasury Yield | 0.53% |
| 2-Year Treasury Yield | 2.45% |
| 10-Year Treasury Yield | 2.40% |
| 10-3M Curve (Most Accurate Recession Forecasting Tool) | 1.87% |
| 10-2 Curve (Most Popular Yield Curve Followed By Wall Street) | -0.04% |
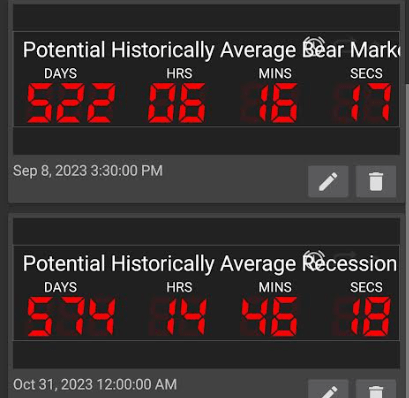
| Potential Historically Average Recession Start If Curve Inverts Now (Curve Inverted March 31st) | October 31st, 2023 |
| Potential Historically Average Bear Market Start If Curve Inverts Now (Curve Inverted March 31st) | September 8th, 2023 |
| Potential Historically Average Bear Market Bottom (Curve Inverted March 31st) | September 8th, 2024 |
| Potential Historically Average New Record High (Curve Inverted March 31st) | December 8th, 2025 |
(Source: DK S&P 500 Valuation & Total Return Tool) NOT For Market Timing Purposes, updated from a previous article
The 10-2 curve is the most closely watched by Wall Street but a study from the NY Fed finds that the 10-3 curve is the most accurate at forecasting recessions.
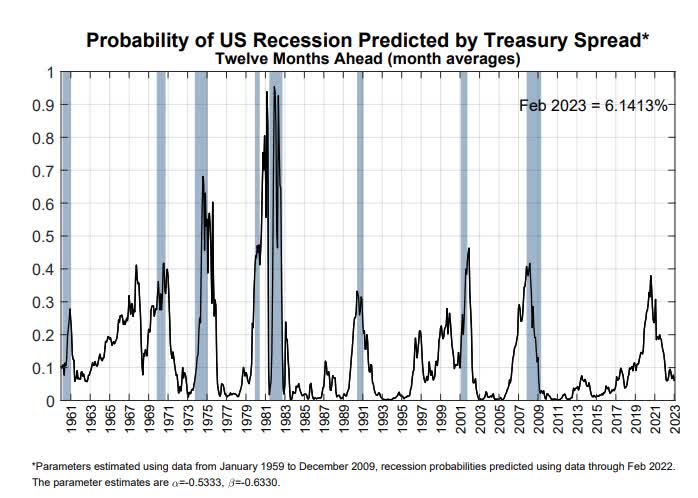
NY Fed
The good news is that the 3m-10yr curve is quite steep at the moment, and so the NY Fed estimates a 6% chance of a recession in the next year.
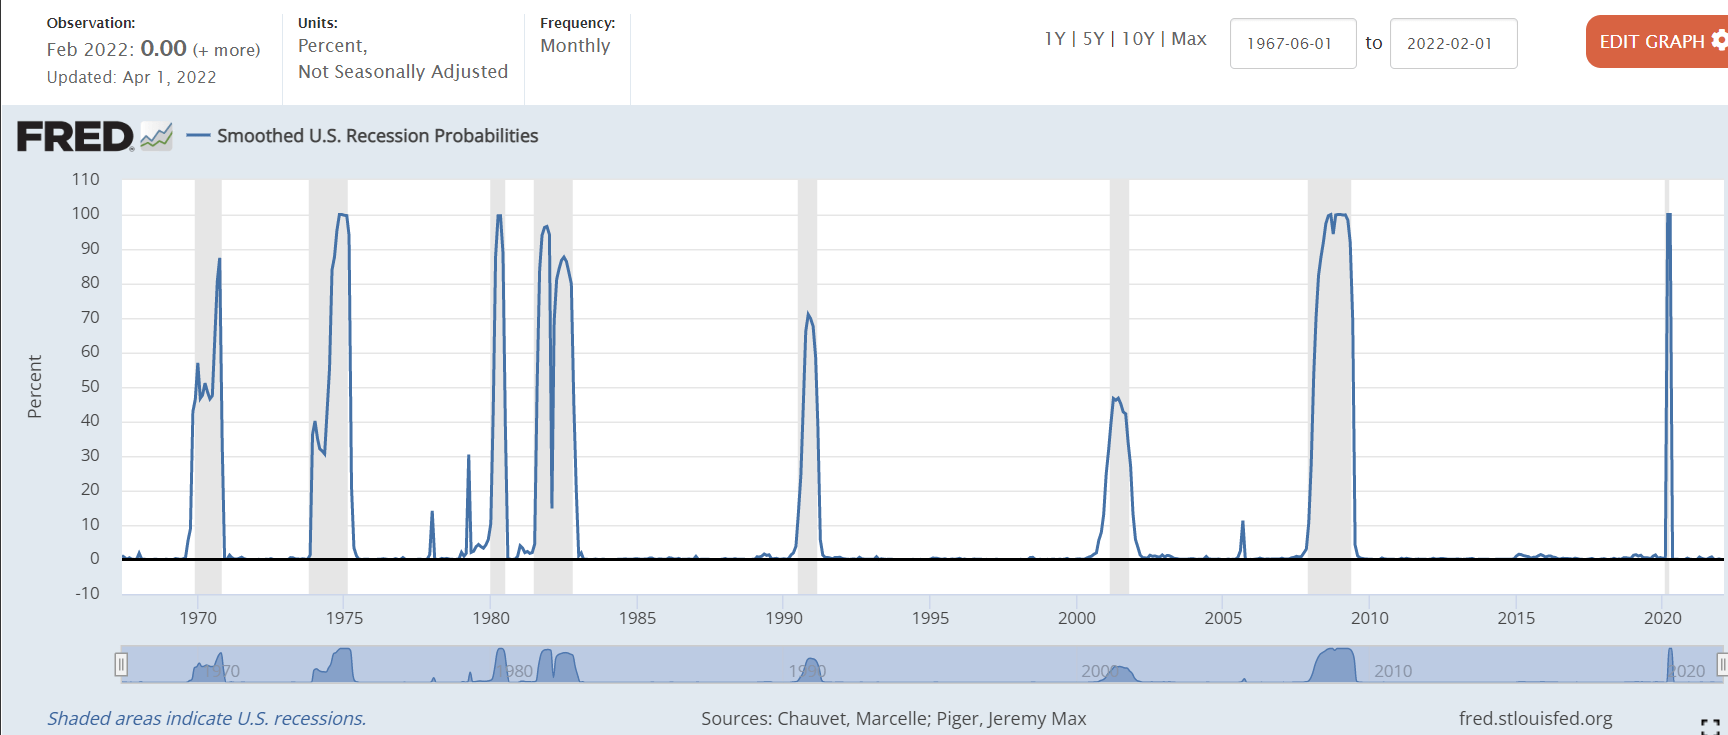
(Source: St. Louis Federal Reserve)
The St. Louis Fed’s model, based on four economic metrics, estimates a 0.0% chance we’re in a recession right now.
Currently, the bond market is mildly concerned about recession risk and we are monitoring the situation closely each day and week.
The important thing to remember is that yield curves don’t directly cause recessions, they are an indicator of tightening financial conditions that usually result in deteriorating economic fundamentals.

David Rice
At the moment the economic fundamentals are strong, with the average of 18 leading indicators 20% above their historical baseline.
As you can see, this means the economic data agree with the NY Fed’s model, there is little risk of a recession over the next year.
David Rice
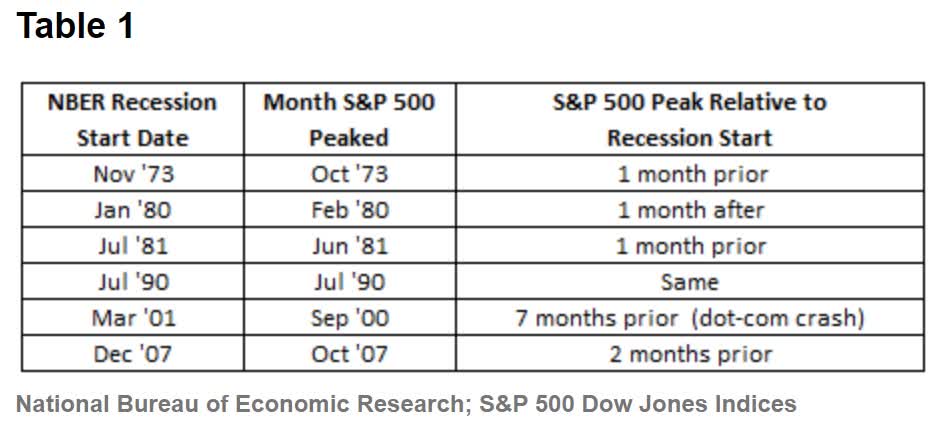
Further good news is that even if we get a recession in 2023 or 2024, the stock market is likely to keep rising for some time.
Jeff Miller
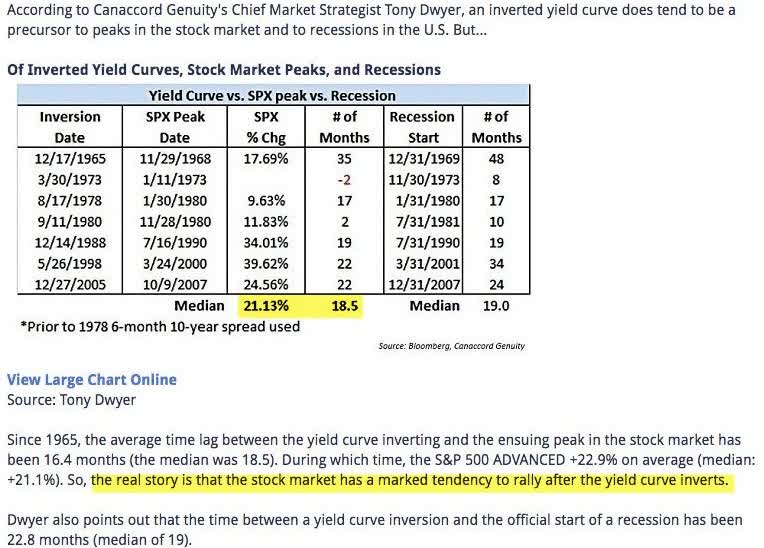
Historically, stocks keep rising a median of 21% for 18.5 months following a 2-10 yield curve inversion, peaking right before the recession begins.
So what does this potentially mean for investors?
Assuming the historically average recession and bear market start times:
David Rice, Jeff Miller, Lipper Financial
As you can see we likely have a very long time before a bear market is historically likely to begin, assuming we even get a recession at all.
- the Fed’s track record on soft landings is 3/12 so not great
- the 2-10 yield curve’s track record of forecasting recessions within 2 years is 5/6
Why You Should NEVER Try To Time The Market
Given the yield-curve inversion and rising 2023 and 2024 recession risk, why not just stick with high volatility stocks until September 2023 and then sell everything and wait for a bear market bottom?
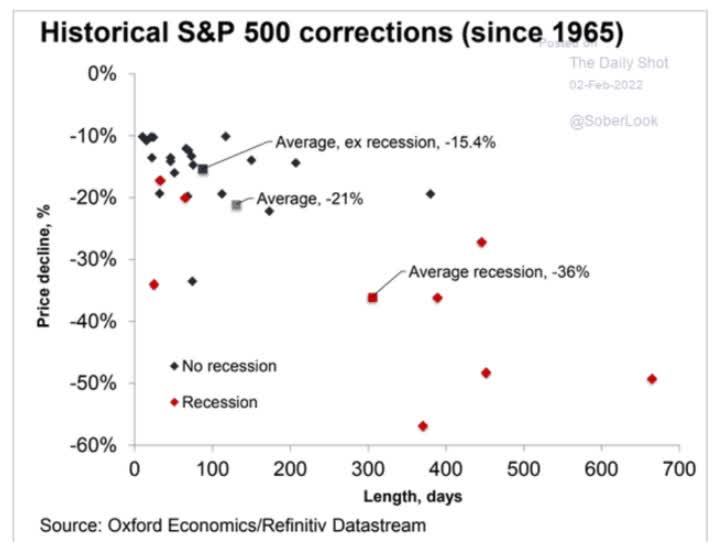
Daily Shot
After all, with the average recessionary bear market a 36% decline, this sounds like a pretty reasonable way to minimize market pain and maximize gain right?
If past history was all that is needed to play the game of money, the richest people would be librarians.” – Warren Buffett
Actually, it’s not at all reasonable, it’s the 2nd most dangerous thing investors can do.
According to Buffett, Munger, JPMorgan, Dalbar, Bank of America, RIA, and many others, here are the only two ways a smart person can ever go broke.
- leverage
- market timing
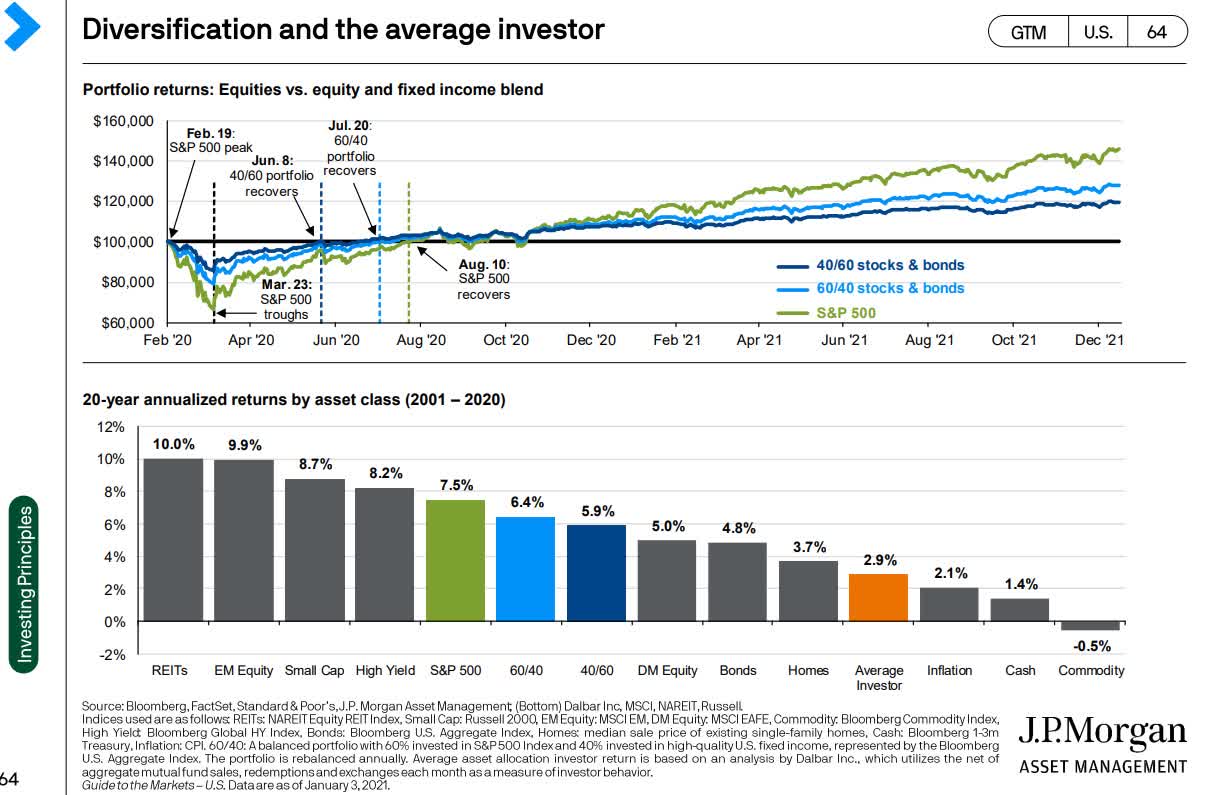
JPMorgan Asset Management
Here is what the average investor’s attempts at marketing timing go them over the last 20 years.
- 0.8% annual real returns vs 5.4% for the S&P 500 and 3.8% for a 40% stock 60% bond portfolio
- 17% inflation-adjusted returns over 20 years
- compared to 187% inflation-adjusted S&P 500 returns
- That’s 96% lower real returns over half an investing lifetime…the true cost of market timing
And over the truly long-term market timing isn’t just a bad idea, it’s potentially a disastrous one.
According to Bank of America’s head of quantitative research:
- since 1926 the S&P 500’s inflation-adjusted returns are 1,150X
- missing just 10 of the market’s best single-day gains in each decade resulted in a 94% inflation-adjusted loss
- 98% of short-term traders lose money
- 97% of long-term buy and hold investors make money
If you think you can time the market, think again. The odds are so outrageously against you that it makes betting your life savings on a single hand of blackjack seem low-risk by comparison.
So why do I point out the increased risks of a recessionary bear market in 2023?
So we can prepare, emotionally, and financially, for a perfectly normal, healthy, and expected economic and market downturn.
5% Yielding/Low Volatility Aristocrats You’ll Want To Own In The Coming Bear Market
Let me show you an example of reasonable and prudent pre-recession risk management.
Let’s consider five high-yield, low-volatility dividend aristocrats.
| Company | Ticker | Sector | Country | Dividend Withholding Tax | Annual Volatility |
| 3M | (MMM) | Industrial | US | 0% | 20.5% |
| Novartis | (NVS) | Healthcare | Switzerland | 15% | 18.5% |
| UGI Corp | (UGI) | Utilities | US | 0% | 19.5% |
| Altria | (MO) | Consumer Staples | US | 0% | 20.1% |
| Enbridge | (ENB) | Energy | Canada | 15% | 23.0% |
| Average | 6.00% | 20.30% |
(Source: DK Research Terminal)
You’ll recognize four of these names from a recent article I did highlighting the power of low-volatility high-yield blue-chips to help you sleep well at night during recessions.
I’m still recommending these high-yield, low volatility aristocrats, because of their absolutely incredible fundamentals.
Specifically, we have five historically low volatility aristocrats, in five sectors, from three countries.
So we have good diversification and 80% of these aristocrats are defensive.
And their average annual volatility is 20.3%. For context:
- the average standalone company has a 28% annual volatility
- the average aristocrat has 24% annual volatility
Fundamental Safety And Quality You Can Trust In A Recession
| Company | Quality Rating (out Of 13) | Quality Score (Out Of 100) | Dividend/Balance Sheet Safety Rating (out of 5) | Safety Score (Out Of 100) | Dependability Rating (Out Of 5) | Dependability Score (out Of 100) |
| 3M | 13 | 92% | 5 | 94% | 5 | 88% |
| Novartis | 13 | 97% | 5 | 100% | 5 | 96% |
| UGI Corp | 13 | 87% | 5 | 93% | 5 | 83% |
| Altria | 13 | 88% | 5 | 91% | 5 | 83% |
| Enbridge | 13 | 84% | 5 | 87% | 5 | 85% |
| Average | 13.0 Ultra SWAN | 89.6% | 5.0 Very Safe | 93.0% | 5.0 Exceptional | 87.0% |
(Source: DK Research Terminal)
For context:
- average dividend aristocrat has 85% quality
- and 11.8/12 Super SWAN quality
Here we have pure Ultra SWAN aristocrat safety and quality, with some of the safest and most dependable dividends on earth. How safe?
| Rating | Dividend Kings Safety Score (151 Point Safety Model) | Approximate Dividend Cut Risk (Average Recession) |
Approximate Dividend Cut Risk In Pandemic Level Recession |
| 1 – unsafe | 0% to 20% | over 4% | 16+% |
| 2- below average | 21% to 40% | over 2% | 8% to 16% |
| 3 – average | 41% to 60% | 2% | 4% to 8% |
| 4 – safe | 61% to 80% | 1% | 2% to 4% |
| 5- very safe | 81% to 100% | 0.5% | 1% to 2% |
| 5% Yielding Aristocrats | 93% | 0.5% | 1.4% |
| Risk Rating | Low Risk (81st industry percentile risk-management consensus) | BBB+ stable outlook credit rating 4.2% 30-year bankruptcy risk |
20% OR LESS Max Risk Cap Recommendation (Each) |
(Source: DK Research Terminal)
For context:
- average aristocrat has 88% dividend safety
- 84% average dependability
During a historically average recession since WWII, the risk of these aristocrats cutting their dividends was about 1 in 200.
Even in a Pandemic or Great Recession level downturn, the risk was about 1.4%.
The risk of all five cutting their dividends is effectively zero.
| Company | Payout Ratio | Industry Safe Payout Ratio Guideline | Debt/Capital | Industry Safe Debt/Capital Guideline |
| 3M | 60% | 60% | 50% | 40% |
| Novartis | 53% | 60% | 27% | 40% |
| UGI Corp | 48% | 75% | 57% | 60% |
| Altria | 80% | 85% | 101% | 60% |
| Enbridge | 68% | 83% | 48% | 60% |
| Average | 61.8% | 72.6% | 56.6% | 52.0% |
(Source: DK Research Terminal)
These aristocrats have very well-covered dividends, 11% below rating agency safety guidelines.
Elevated debt/capital is primarily a result of stock buybacks for Altria.
When a company buys back stock above book value, it reduces shareholder equity and pushes up debt/capital.
Shares that are repurchased sit on the balance sheet as treasury stock which is primarily used for stock option compensation for employees. It’s treated as a liability. In fact, it’s an asset that can be sold to raise cash.
- this is why S&P rates companies like Philip Morris (PM) with over 100% debt/capital A stable
| Company | Long-Term Risk Management Consensus Industry Percentile | Risk-Rating | S&P Credit Rating | Credit Rating Outlook | 30-Year Bankruptcy Risk |
| 3M | 87% | Low | A+ | Negative | 0.60% |
| Novartis | 93% | Low | AA- | Stable | 0.55% |
| UGI Corp | 67% | Low | NA | NA | 7.50% |
| Altria | 69% | Low | BBB | Stable | 7.50% |
| Enbridge | 87% | Low | BBB+ | Stable | 5.00% |
| Average | 80.6% | Low | BBB+ | Stable | 4.2% |
(Source: DK Research Terminal)
S&P estimates a 4.2% average risk of default (bankruptcy) in the next 30 years.
- aristocrats average A- stable with 3.0% average long-term bankruptcy risk
Six rating agencies estimate these Ultra SWAN aristocrats have long-term risk management in the top 19% of their industry peers.
For context:
- Dividend Champions: 57th percentile – average
- Monthly Dividend Stocks: 60th percentile – above-average
- Hyper-Growth stocks: 61st percentile – above-average
- Master List average: 62nd percentile -above-average
- Dividend Kings: 63rd percentile -above-average
- Blue-Chip Quality Companies: 64th percentile – above-average
- Dividend Aristocrats: 67th percentile -above-average
- Low Volatility Stocks: 68th percentile – above-average
- Ultra SWANs: 71st percentile – good
- Foreign Dividend Stocks: 75th percentile – good
- Strong ESG Stocks: 78th percentile – good bordering on very good
- 5% Yielding Aristocrats: 81st percentile – very good
- S&P Global (SPGI) #1 risk-management company, 94th industry percentile – exceptional
| Company | Dividend Growth Streak (Years) | ROC (Greenblatt) | ROC Industry Percentile | 13-Year Median ROC | 30-Year Bankruptcy Risk |
| 3M | 64 | 50% | 86% | 57% | 0.60% |
| Novartis | 25 | 523% | 98% | 69% | 0.55% |
| UGI Corp | 34 | NA | NA | NA | 7.50% |
| Altria | 52 | 712% | 85% | 416% | 7.50% |
| Enbridge | 26 | NA | NA | NA | 5.00% |
| Average | 40.2 | 428% | 89.7% | 180.9% | 4.2% |
(Source: DK Research Terminal)
Ben Graham considered a 20+ year dividend growth streak to be a sign of excellent quality.
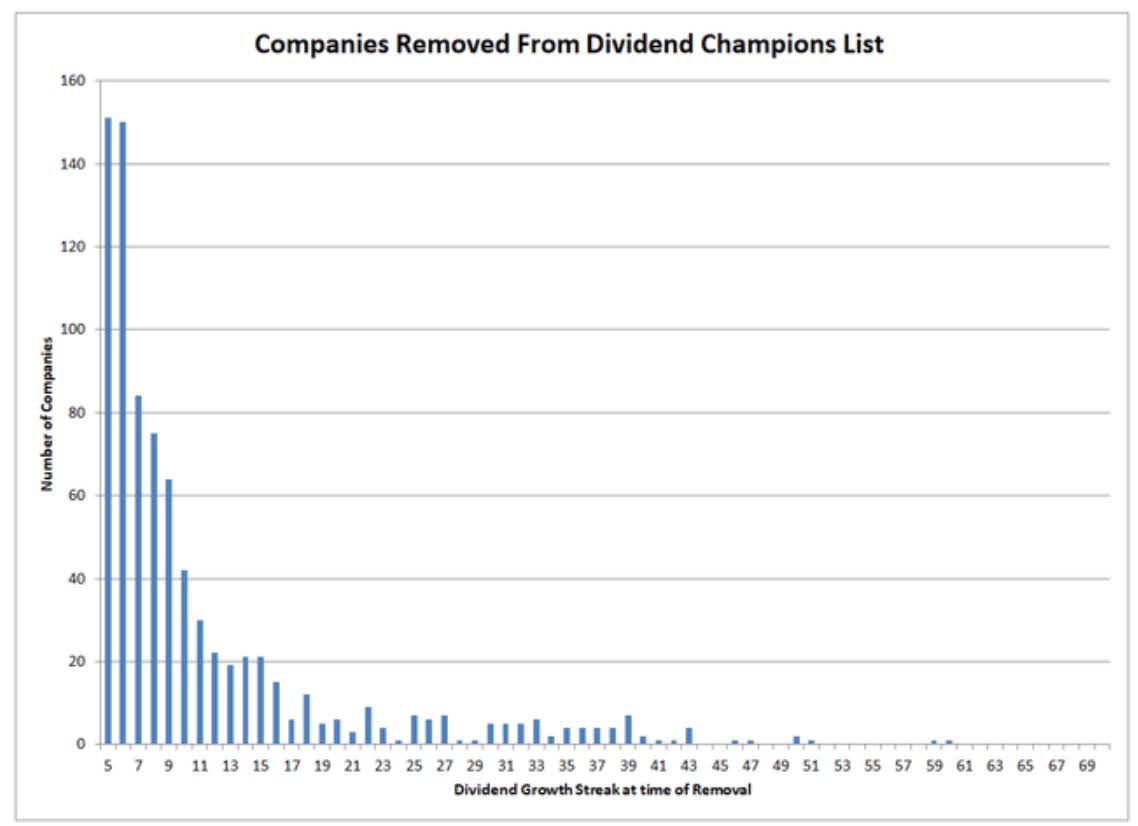
Justin Law
If a company has grown its dividends for 20+ years, there is very little risk that it will cut its dividend or even fail to keep raising it in all economic and industry conditions.
The average dividend growth streak for these aristocrats is 40 years, 2X the Graham standard of excellence.
Return on capital is pre-tax profit/operating capital (the money it takes to run the business).
- Joel Greenblatt’s gold standard proxy for quality and moatiness
The S&P 500’s 2021 ROC was 14.6%.
- on average, it takes the typical S&P company about 7 years to recoup investments they make
The average return on capital for these aristocrats is 428%.
- average investment recouped in 2.8 months
- 29X higher quality than the average S&P 500 company according to one of the greatest investors in history
These aristocrats’ ROC is in the top 10% of their industries, confirming a wide moat.
ROC is more than double their 13-year median, confirming a stable or improving moat.
Ok, so we can see that these are some of the world’s best companies.
And here’s why you might want to buy them today.
Wonderful Companies At Wonderful Prices
For context, here’s the valuation profile of the S&P 500.
S&P 500 Valuation Profile
| Year | EPS Consensus | YOY Growth | Forward PE | Blended PE | Overvaluation (Forward PE) |
Overvaluation (Blended PE) |
| 2021 | $206.25 | 50.34% | 20.7 | 21.9 | 20% | 25% |
| 2022 | $225.56 | 9.36% | 20.2 | 20.4 | 17% | 16% |
| 2023 | $248.01 | 9.95% | 18.3 | 19.2 | 7% | 9% |
| 2024 | $275.55 | 11.10% | 16.5 | 17.4 | -4% | -1% |
| 12-Month forward EPS | 12-Month Forward PE | Historical Overvaluation | PEG | 25-Year Average PEG | S&P 500 Dividend Yield |
25-Year Average Dividend Yield |
| $227.46 | 19.985 | 18.61% | 2.35 | 3.62 | 1.41% | 2.01% |
(Source: DK S&P 500 Valuation And Total Return Tool)
Stocks have already priced in 96% EPS growth from 2020 through 2024 and are trading at 20X forward earnings.
- 16.85 is the 25-year average
- 16.9 is the 10-year average (low rate era)
- 16.9 is the 45-year average
- 91% probability that stocks are intrinsicly worth about 17X forward earnings
- A 14.5% correction needed to get back to the historical market fair value
S&P 500 2027 Consensus Return Potential
| Year | Upside Potential By End of That Year | Consensus CAGR Return Potential By End of That Year | Probability-Weighted Return (Annualized) | Inflation And Risk-Adjusted Expected Returns |
Expected Market Return Vs Historical Inflation-Adjusted Return |
| 2027 | 33.15% | 5.89% | 4.42% | 1.01% | 15.78% |
(Source: DK S&P 500 Valuation And Total Return Tool)
Adjusted for inflation, the risk-expected returns of the S&P 500 are about 1% for the next five years.
- 1/6th of the S&P’s historical inflation-adjusted returns of 6.4% CAGR
| S&P Earnings Yield | 10-Year US Treasury Yield | Earning Yield Risk-Premium (3.7% 10 and 20-year average) |
| 5.00% | 2.40% | 2.60% |
| Theoretical Interest Rate Justified Market Fair Value Forward PE | Current PE |
Theoretically Interest Rate Justified Market Decline |
| 16.39 | 19.99 | 18.00% |
(Source: DK S&P 500 Valuation And Total Return Tool)
And if you factor in interest rates, stocks are slightly more, not less historically overvalued.
And here’s our 5% yielding aristocrats.
| Company | Discount To Fair Value | PE/EBITDA/FFO 2022 | Earnings Yield 2022 | 12-Month Consensus Total Return Potential | 12-Month Fundamentally Justified Upside Total Return Potential |
| 3M | 29.6% | 14.4 | 6.9% | 19.0% | 46.0% |
| Novartis | 17.3% | 14.1 | 7.1% | 12.1% | 24.8% |
| UGI Corp | 25.6% | 11.9 | 8.4% | 38.9% | 38.2% |
| Altria | 16.2% | 10.9 | 9.2% | 9.1% | 26.2% |
| Enbridge | 2.9% | 9.5 | 10.5% | 4.4% | 9.0% |
| Average | 18.3% | 12.2 | 8.4% | 16.7% | 28.8% |
(Source: DK Research Terminal)
These aristocrats are the mirror image of the 19% overvalued S&P 500, 18% undervalued.
They trade at 12.2X earnings/cash flow, compared to 20X for the S&P 500 and 22X for the aristocrats.
- the last time the S&P 500 was 12.2X earnings was November 2011, after a 20% correction
Analysts expect a 17% average total return from these aristocrats and 29% total returns is what they would deliver if they grew as expected and returned to fair value in the next 12-months.
Long-Term Fundamentals To Help You Retire Rich And Stay Rich In Retirement
| Company | Yield | FactSet Long-Term Consensus Growth Rate | LT Consensus Return Potential | LT Risk-Adjusted Expected Return |
| 3M | 4.0% | 8.0% | 12.0% | 8.4% |
| Novartis | 3.8% | 5.3% | 9.1% | 6.4% |
| UGI Corp | 3.8% | 7.5% | 11.3% | 7.9% |
| Altria | 6.9% | 5.3% | 12.2% | 8.5% |
| Enbridge | 5.9% | 6.0% | 11.9% | 8.3% |
| Average | 4.9% | 6.4% | 11.3% | 7.9% |
(Source: DK Research Terminal)
For context:
- S&P yields 1.4%
- aristocrats yield 2.3%
- Vanguard’s high-yield ETF: 2.7%
- junk bonds: 4.2%
Junk bonds have an average credit rating of “B” while these aristocrats are BBB+.
- 37% default risk vs 4.2%
- 17% higher yield than junk bonds with 86% less fundamental risk
Analysts expect 6.4% long-term dividend growth and 11.3% long-term total returns.
| Investment Strategy | Yield | LT Consensus Growth | LT Consensus Total Return Potential | Long-Term Risk-Adjusted Expected Return | Long-Term Inflation And Risk-Adjusted Expected Returns | Years To Double Your Inflation & Risk-Adjusted Wealth |
10 Year Inflation And Risk-Adjusted Return |
| Safe Midstream | 5.1% | 6.0% | 11.1% | 7.8% | 5.6% | 12.9 | 1.72 |
| 5% Yielding Aristocrats | 4.9% | 6.4% | 11.3% | 7.9% | 5.7% | 12.6 | 1.75 |
| Safe Midstream + Growth | 3.3% | 8.5% | 11.8% | 8.3% | 6.1% | 11.8 | 1.80 |
| REITs | 2.9% | 6.5% | 9.4% | 6.6% | 4.4% | 16.4 | 1.54 |
| High-Yield | 2.8% | 11.3% | 14.1% | 9.9% | 7.7% | 9.4 | 2.10 |
| Europe | 2.6% | 12.8% | 15.4% | 10.7% | 8.6% | 8.4 | 2.27 |
| 10-Year US Treasury | 2.4% | 0.0% | 2.4% | 1.7% | -0.5% | -142.0 | 0.95 |
| Dividend Aristocrats | 2.2% | 8.9% | 11.1% | 7.8% | 5.6% | 12.9 | 1.72 |
| 60/40 Retirement Portfolio | 2.1% | 5.1% | 7.2% | 5.1% | 2.9% | 24.9 | 1.33 |
| Value | 2.1% | 12.1% | 14.1% | 9.9% | 7.7% | 9.3 | 2.10 |
| REITs + Growth | 1.8% | 8.9% | 10.6% | 7.4% | 5.2% | 13.7 | 1.67 |
| High-Yield + Growth | 1.7% | 11.0% | 12.7% | 8.9% | 6.7% | 10.8 | 1.91 |
| Dividend Growth | 1.6% | 8.0% | 9.6% | 6.7% | 4.5% | 15.9 | 1.56 |
| S&P 500 | 1.4% | 8.5% | 9.9% | 7.0% | 4.8% | 15.1 | 1.59 |
| Top 50 Megacaps | 1.0% | 12.10% | 13.1% | 9.2% | 7.0% | 10.3 | 1.97 |
| Nasdaq (Growth) | 0.8% | 10.7% | 11.5% | 8.1% | 5.9% | 12.3 | 1.77 |
(Source: Morningstar, FactSet, Ycharts)
Among non-speculative investment strategies only blue-chip midstream yields more, and not by much.
These 5% aristocrats are expected to slightly beat the aristocrats over time, run circles around the S&P 500 and almost match the 0.8% yielding Nasdaq!
Inflation-Adjusted Consensus Return Potential: $1,000 Initial Investment
| Time Frame (Years) | 7.7% CAGR Inflation-Adjusted S&P Consensus | 9.0% Inflation-Adjusted Aristocrat Consensus | 9.1% CAGR Inflation-Adjusted 5% Yielding Aristocrat Consensus | Difference Between Inflation Adjusted 5% Yielding Aristocrat Consensus And S&P 500 |
| 5 | $1,449.03 | $1,540.04 | $1,547.11 | $98.08 |
| 10 | $2,099.70 | $2,371.71 | $2,393.56 | $293.86 |
| 15 | $3,042.53 | $3,652.52 | $3,703.10 | $660.56 |
| 20 | $4,408.74 | $5,625.01 | $5,729.11 | $1,320.37 |
| 25 | $6,388.41 | $8,662.72 | $8,863.58 | $2,475.17 |
| 30 | $9,257.02 | $13,340.91 | $13,712.94 | $4,455.93 |
(Source: DK Research Terminal)
Analysts expect about 14X inflation-adjusted returns over the next 30 years.
| Time Frame (Years) | Ratio Aristocrats/S&P | Ratio Inflation-Adjusted 5% Yielding Aristocrat Consensus Vs S&P 500 |
| 5 | 1.06 | 1.07 |
| 10 | 1.13 | 1.14 |
| 15 | 1.20 | 1.22 |
| 20 | 1.28 | 1.30 |
| 25 | 1.36 | 1.39 |
| 30 | 1.44 | 1.48 |
(Source: DK Research Terminal)
This means potentially 50% better returns than the S&P 500 and slightly more than the 2.3% yielding aristocrats.
What proof is there that these 5% yielding aristocrats can actually deliver around 11% long-term returns?
Historical Returns Since 1997 (Annual Rebalancing)
The future doesn’t repeat, but it often rhymes.” – Mark Twain
Past performance is no guarantee of future results, but studies show that blue-chips with relatively stable fundamentals over time offer predictable returns based on yield, growth, and valuation mean reversion.

Bank of America
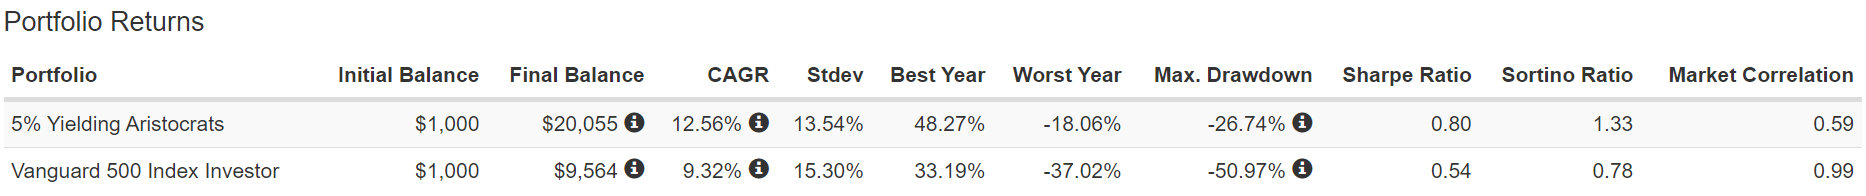
(Source: Portfolio Visualizer Premium)
The S&P is expected to return 9.9% in the future vs 9.3% over the last quarter-century.
These 5% yielding aristocrats are expected to deliver 11.3% vs 12.6% over the last 25-years.
- starting yield + long-term growth + valuation changes (cancel out over 30+ years) = total returns over decades
- this is the Gordon Dividend Growth Model
- the most accurate total return model ever discovered
- used by Brookfield Asset Managment, Jack Bogle of Vanguard, Howard Marks, and virtually every large asset manager
- 20% to 30% historical margin of error over decades
- accurately forecasting long-term returns isn’t magic, it’s just math
But remember that our goal is low volatility, and despite being just five companies, 100X less than the S&P 500, these 5% yielding aristocrats averaged 13.5% annual volatility.
- 11% less volatile than the S&P 500
- 17% better negative volatility-adjusted total returns than the S&P 500
- peak decline during the Great Recession was 27% vs 51% for the market
Don’t think that 5% yielding aristocrats can change your financial destiny?
- over 25 years this modest outperformance by these 5% yielding aristocrats generated 11.2X inflation-adjusted returns
- vs 5.4X S&P 500
- more than 2X the inflation-adjusted wealth of the broader market
The average rolling returns were 13% to 14% over every time frame with no worse than flat returns for five years.
- S&P 500 achieved -30% over 10 years…not adjusted for inflation
So to summarize:
- much higher and safer yield than almost any other investment strategy on Wall Street
- higher quality and safer than the aristocrats
- long-term consensus return potential that could deliver 50% more inflation-adjusted total return than the S&P 500 over 30 years
- historical inflation-adjusted returns that are more than 2X better than the S&P 500
- and with a lot less volatility
And what about income?
| Portfolio | 1997 Income Per $1,000 Investment | 2021 Income Per $1,000 Investment | Annual Income Growth | Starting Yield | 2021 Yield On Cost |
| 5% Yielding Aristocrats | $42 | $954 | 13.90% | 4.2% | 95.4% |
(Source: Portfolio Visualizer Premium)
Thanks to annual rebalancing and dividend reinvestment, these 5% yielding aristocrats delivered incredible 14% annual income growth over the last 25 years.
- today they yield more than they did in 1997
- the yield on cost is nearly 100%
- your entire investment is paid back every year in very safe and steadily growing income
What about future income growth potential?
| Analyst Consensus Income Growth Forecast | Risk-Adjusted Expected Income Growth | Risk And Tax-Adjusted Expected Income Growth |
Risk, Inflation, And Tax Adjusted Income Growth Consensus |
| 12.5% | 8.8% | 7.4% | 5.3% |
(Source: DK Research Terminal, FactSet)
Going forward analysts expect similar income growth.
Adjusting for the risk of these companies not growing as expected, inflation, and taxes, that means 5.3% long-term income growth is reasonable to expect.
- S&P 500’s historical inflation- and tax-adjusted income growth rate is 3%
- These 5% yielding aristocrats offer almost 2X the S&P’s historical income growth
- FactSet consensus for a 60/40’s inflation and tax-adjusted income growth rate is 0.5%
- These 5% yielding aristocrats offer 11X the 60/40’s consensus income growth potential
Bottom Line: 5% Yielding Aristocrats You’ll Want To Own In The Coming Bear Market
No one knows exactly when the next recession or bear market will start and anyone that tells you otherwise is
- a fool
- a charlatan
- trying to sell you something
- possibly all three
What I can tell you is that
- another recession and bear market are inevitable
- market timing is NEVER the answer to avoiding short-term pain during prolonged market downturns
- prudent risk-management and asset allocation is ALWAYS the answer to sleeping well at night during bear markets
- the world’s best high-yield/low volatility blue-chips can, when combined with the right allocation to bonds and cash, help you retire in safety and splendor
In fact, just 3 low-cost ETFs can turn these 5% yielding low-volatility aristocrats into the Ultimate Sleep Well At Night Retirement Portfolio that can potentially help the typical retired couple
- generate an extra $763,000 million in inflation-adjusted retirement income over 30 years compared to a 60/40 retirement portfolio
- deliver $1.1 million more inflation-adjusted wealth over 30 years
- turn $555,000 in median retirement savings into $3.5 million inflation-adjusted wealth after 30 years
- fell just 9% during the Pandemic crash vs 12% for a 60/40
- fell just 17% during the Great Recession vs 31% for a 60/40
- worst-year since January 2008 was -7% vs -22% 60/40 and -38% S&P 500
Today MMM, NVS, MO, UGI, and ENB represent Ultra SWAN quality aristocrats that have historically low volatility and
- offer one of the safest 4.9% yields on Wall Street
- have 6.4% long-term growth potential
- 11.3% CAGR long-term return potential (better than the S&P 500, aristocrats, and almost as good as the Nasdaq)
- 12.6% CAGR historical returns over the last 25-years
- over the last 25 years suffered a peak decline that was 4% less than a 60/40 retirement portfolio
This is how you prepare for a potential 2023 or 2024 recession, the smart way.
This is how you stop obsessing over the Fed, interest rates, inflation, the war, and stock market volatility, in general.
This is how you stop gambling, start investing, and make your own luck on Wall Street.
Luck is what happens when preperation meets opportunity.” – Roman philospher Seneca the younger
Be the first to comment