

proxyminder/E+ via Getty Images
Peak inflation. The latest inflation reading came in blisteringly hot. The Bureau of Labor Statistics (BLS) announced the latest Consumer Price Index (CPI) readings for June 2022 on Wednesday, revealing a headline index that set a new cycle high with prices having increased by 9.1% versus a year ago. This new high inflation reading quickly inspired calls for the Fed to raise interest rates by a full 100 basis points, emerging from their next policy meeting on July 27. While I’m all for Fed hawkishness in putting the full fight to an inflation problem that they let fester and grow for far too long, I contend that even 75 basis points might be a bit much at this point. For while inflation readings may remain steamy through the summer, a growing number of signals suggest that inflation pressures are increasingly fading.
The following are five signs that inflation pressures are already firmly on the wane.
1. Economic Recession
It has been widely debated in recent weeks whether the U.S. economy is already in recession. And we will start to know for sure come Thursday, July 28, which is the day after the next FOMC meeting draws to a close, whether we have met the technical definition of a recession with two consecutive quarters of negative GDP growth. But even if we are not officially in recession right now, the current yield curve that is as inverted as it has been in more than two decades is signaling that a recession looms not too far in the distant future.
Federal Reserve Bank of St. Louis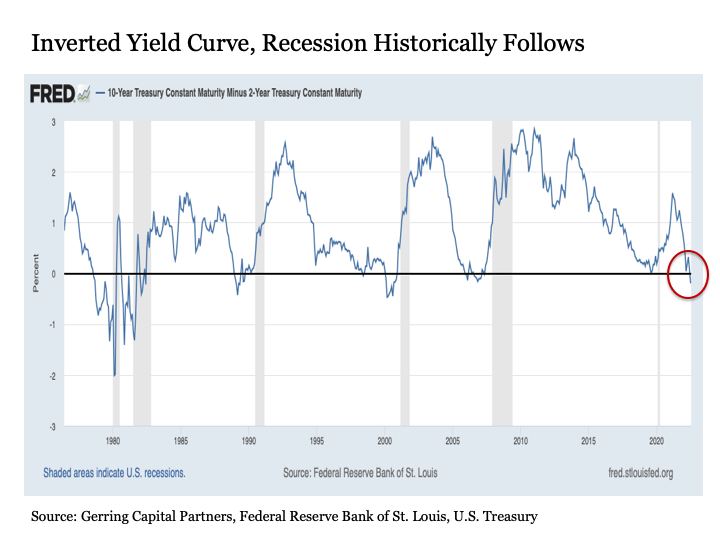
Why does this matter for inflation? Because a recession typically brings with it a decrease in income, which reduces the demand for normal goods. The lower future prices that also come with the onset of a recession may also increasingly encourage consumers to forgo demand today and wait to purchase at potentially lower prices later. Both of these forces, among others, result in shifts in demand that lead to lower prices.
2. Core Producer Prices Are Falling
The latest Producer Price Index (PPI) reading was released this past Thursday, the day after the CPI release. While the headline PPI caused an added stir with a year-over-year increase of 11.3% in June that popped up 0.4 percentage points from the previous month and represented the second-highest reading during the current cycle next to the 11.6% high from March, some decidedly better news on the inflation came from the PPI reading less food, energy, and trade services. This Core PPI reading increased by 6.4% for June. While this is still a high reading by historical standards, it represented another 0.3 percentage point decline from the previous month’s reading at 6.7%. It is also 0.7 percentage points below the cycle high reading of 7.1% from March and represented the lowest Core PPI reading since last October.
In short, core producer prices outside of the volatile food, energy, and trade services readings continue to move in the right direction. This matters because input prices are a key factor that shifts the supply curve. And if core input prices are starting to cool, this will help eventually encourage increased supply and thus lower prices.
While we are seeing signs of pricing relief starting to accumulate at the core level, lately it has been the readings at the headline level that has been causing the greatest consternation among investors. Fortunately, we are starting to see meaningful relief on this front that may start to show up in the monthly PPI data as soon as mid-August when the July readings are released and potentially not long after in the CPI data if current trends continue.
3. Food Prices
Let’s start with food prices. The following three charts containing the prices of major food product inputs clearly tell the story.
StockCharts.com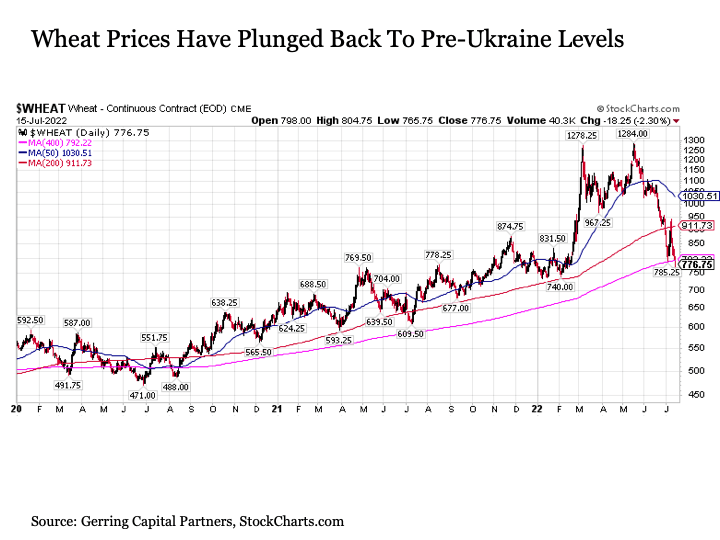
Consider wheat prices that soared upon the news that Russia invaded Ukraine. Since peaking in mid-May, wheat prices have fallen by -40%, with much of the price decline coming over the past month since mid-June.
StockCharts.com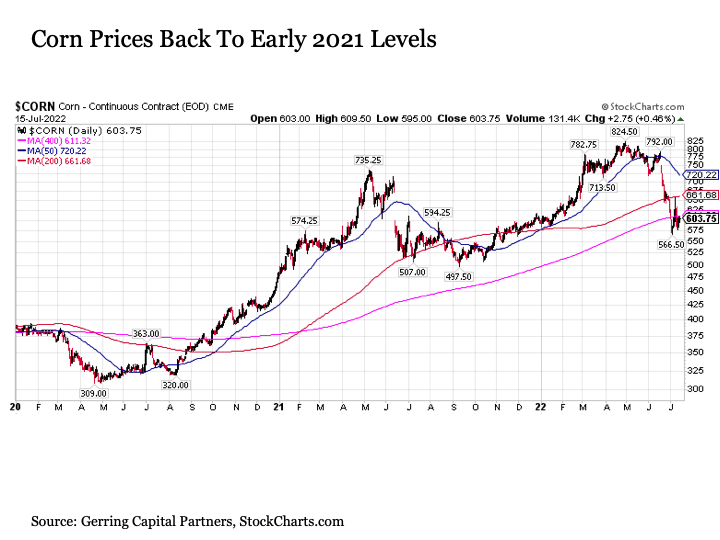
Next consider corn prices that hit their final current cycle peak in mid-June. Since that time, corn prices have fallen by nearly -25% over the past month alone.
StockCharts.com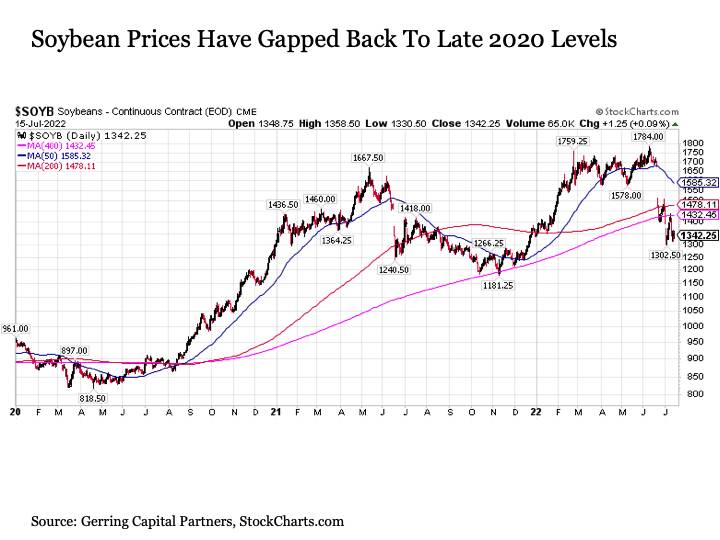
Then we have soybean prices, which have gapped lower by -25% after hitting cycle highs just a month ago.
The massive decline in the input prices of these major food inputs is likely to result in food price relief in relatively short order, particularly if these price declines continue in the months ahead.
4. Energy Prices
We’ll flip to the other side of the headline index with energy.
StockCharts.com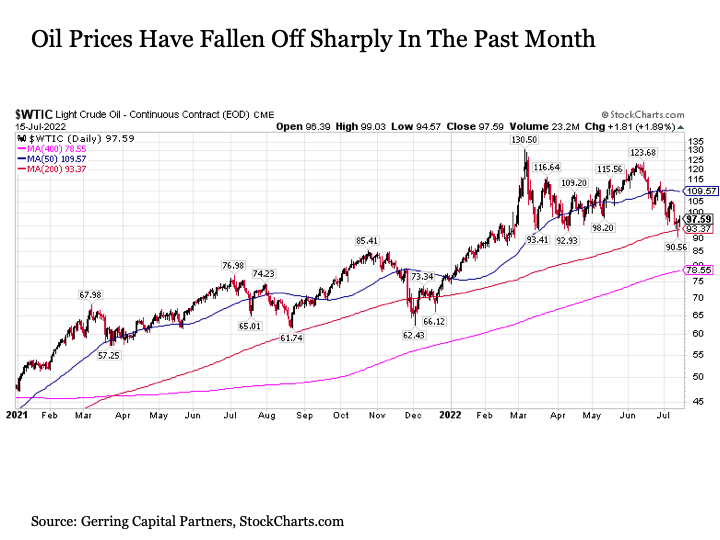
After hitting its latest peak in June, oil prices as measured by West Texas Intermediate Crude has dropped by -22% in the month since. Brent Crude prices have posted a similar decline over this time period.
StockCharts.com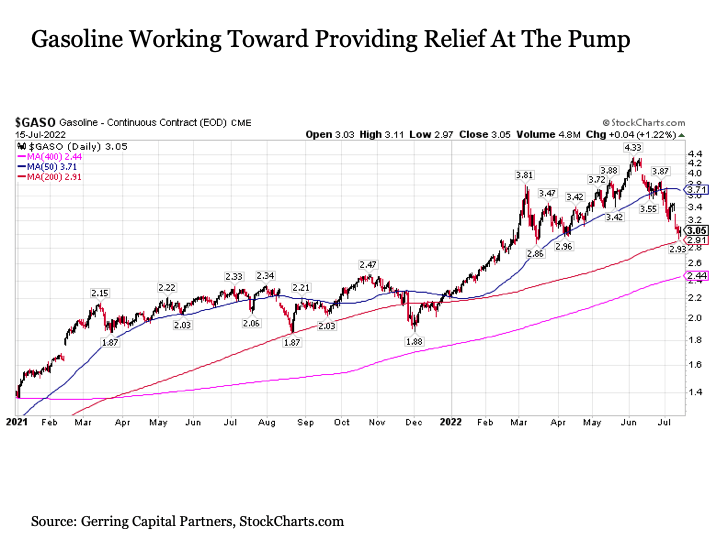
This has had a profound impact on gasoline prices, which have fallen by more than -30% since their early June peak.
StockCharts.com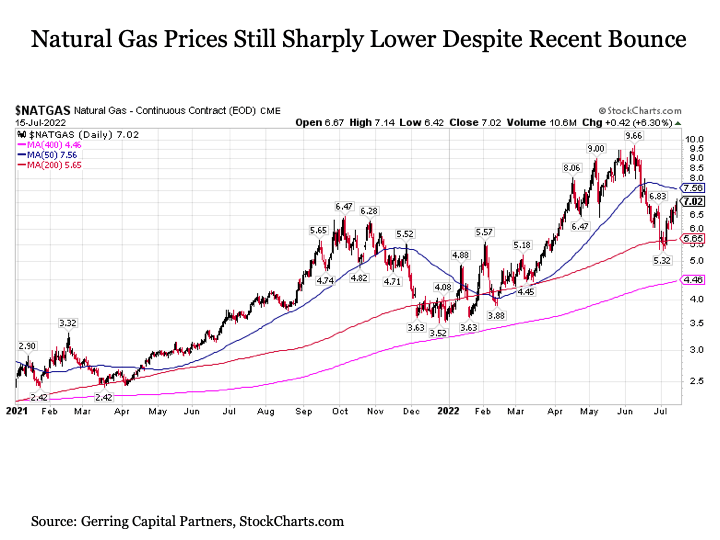
And while natural gas prices have recently bounced after falling by -45% over the one-month period from early June to early July, it still remains sharply below month ago peaks.
Both of these developments of sharply lower input prices across the board on food and energy suggest that meaningful relief may soon be coming on the headline inflation front relatively soon. Although they typically focus on core inflation readings, the recently scorching headline readings have been too hot to ignore. But if these volatile headline inflation drivers abruptly shift from high inflation to nearly flat if not negative versus year ago levels, this would likely provide the Fed with some latitude to back off a beat from continuing to move so aggressively in raising rates in the months ahead.
5. Metals Prices
Before bringing this pricing discussion to a close, it is worthwhile to include a few more additional readings in support of cooler inflation pressures in the months ahead.
StockCharts.com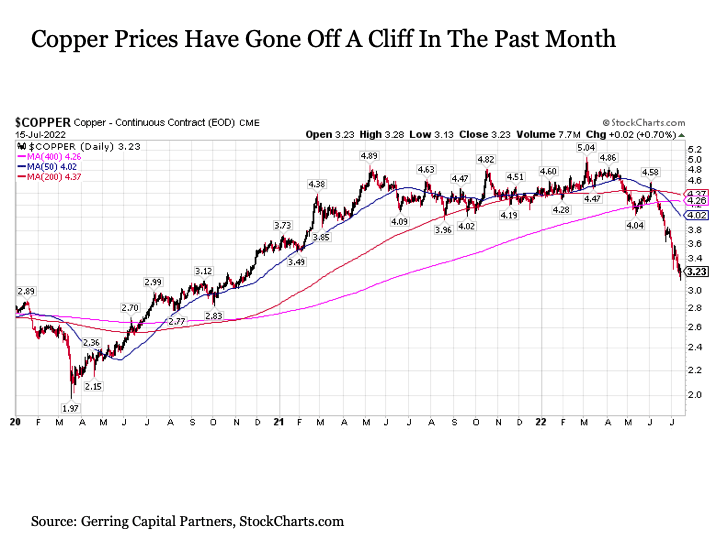
Leading among these is copper prices, which have plunged off of a cliff over the last several weeks. After reaching a final peak of $4.58 at the start of June, copper prices have declined by -30% over the past month and are also lower by a comparable amount on a year-over-year basis.
StockCharts.com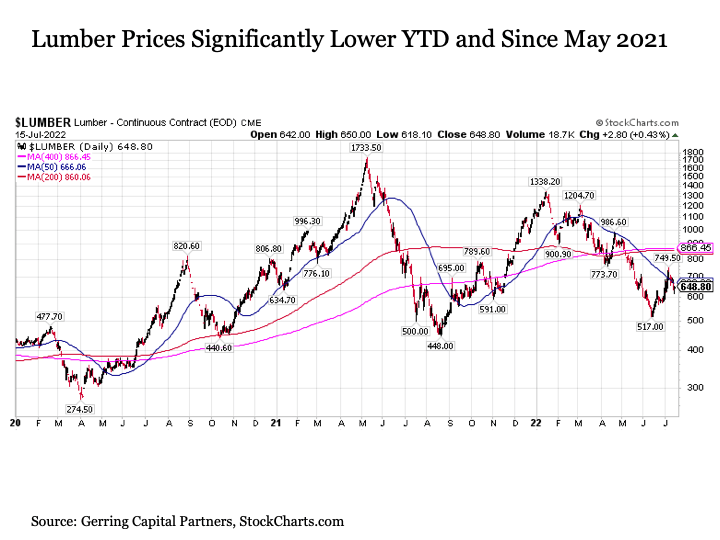
And then we have lumber prices, where the downtrend in prices remains firmly in place since the start of the year. Even after the solid bounce in prices over the past month, lumber prices are still lower by more than -50% since January and more than -60% from May 2021 peaks.
Bottom Line
The outbreak of persistently high inflation has had global capital markets transfixed for much of the past year. But while headline inflation readings remain as blistering as ever as we move through the summer months, a variety of signs suggest that the inflation fever is already in the process of breaking.
If further economic weakening coupled with meaningful recent input price declines continue in the weeks and months ahead, it is likely to bring meaningful relief on the pricing front, which may eventually encourage the suddenly and belatedly hawkish Fed from backing down from their aggressive policy tightening stance.
While this would come as a welcome development for global risk assets, the fact would still remain that a lot of central bank rate hikes already deployed still need to work their way through the economy and financial system over the next 9 to 18 months. As a result, investors still would likely have their work cut out for them in the months ahead, even if high inflation pressures finally abate.
Be the first to comment