

Mike_Kiev/iStock via Getty Images
Consumer inflation came in at 8.5% YOY and +0% month over month, better than the 8.7% economists expected.
Bureau of Labor Statistics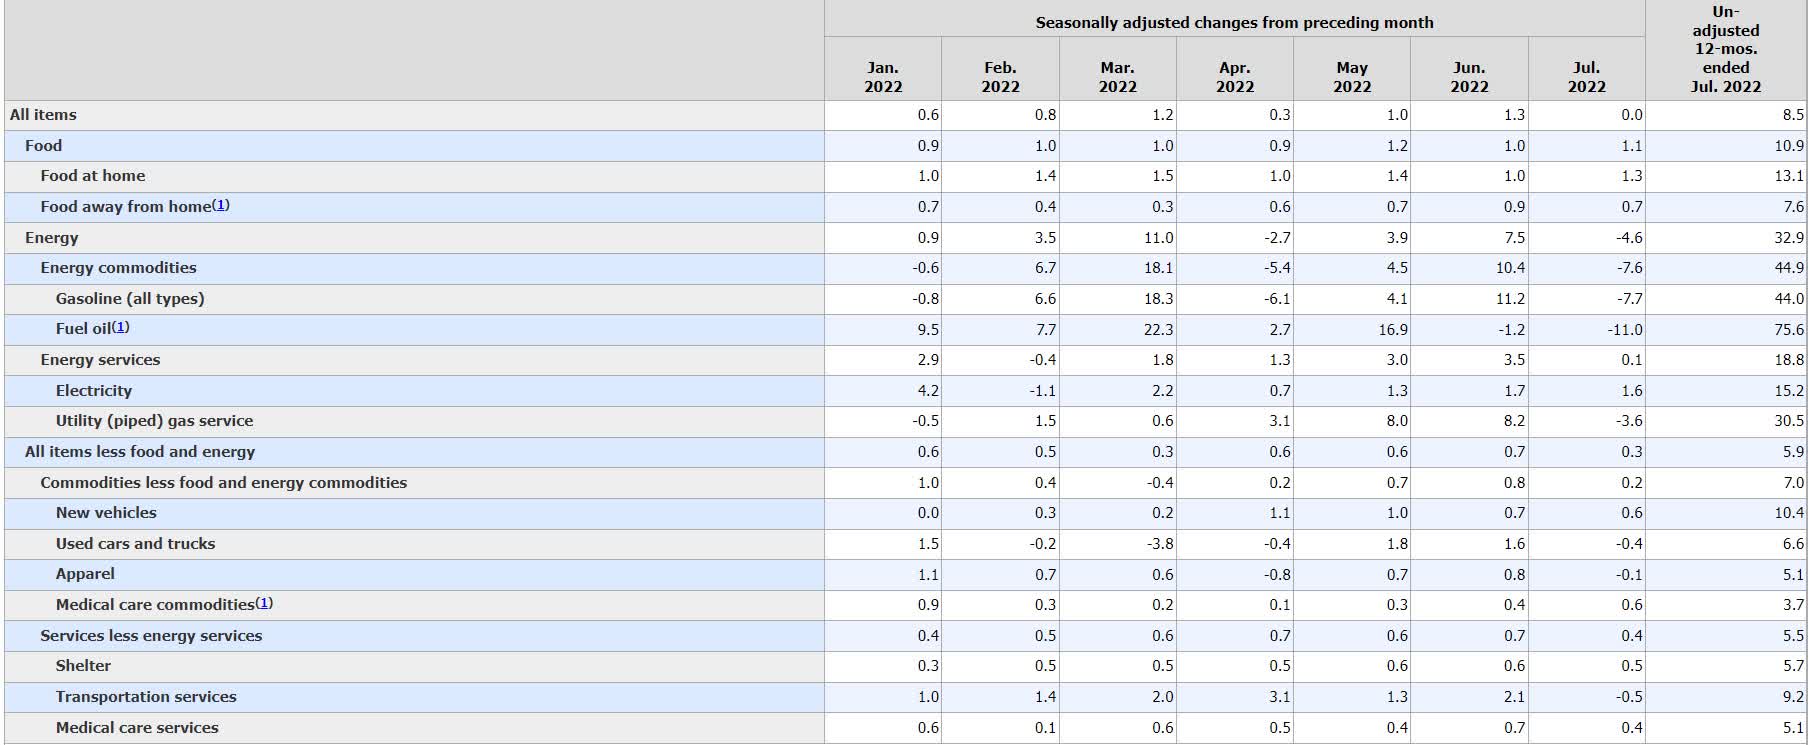
That’s great news because the Cleveland Fed was expecting 8.8% YOY price gains and Research Affiliates 9.4%.
However, we’re not out of the woods yet, because core inflation is still high at 5.9%, and the Fed has made it clear that it’s not done hiking by a long shot.
CME Group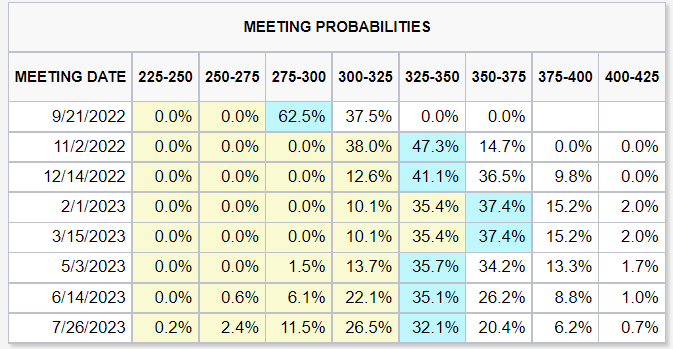
The bond market is now pricing in a terminal Fed funds rate of 3.5% in February, followed by one cut in May of 2023.
The market is reacting with relief and joy, which is understandable. However, I should point out that the Fed’s long-term plans are for a neutral rate of 2.5%, which is 0.25% higher than it is now.
The good news is that the Fed’s probability of achieving a soft landing and avoiding recession has increased a bit.
The bad news is that the bond market is still convinced that a mild recession is likely in 2023.
- the 2-10 yield curve went from -49 basis points the day before the report to -38 basis points after the report
- still the most inverted in 22 years
With earnings estimates still coming down on a weekly basis, and stocks now 5% historically overvalued, investors need to be ready for anything.
Could the market fall another 20% to 40%? If we get a recession that’s likely.
Daily Shot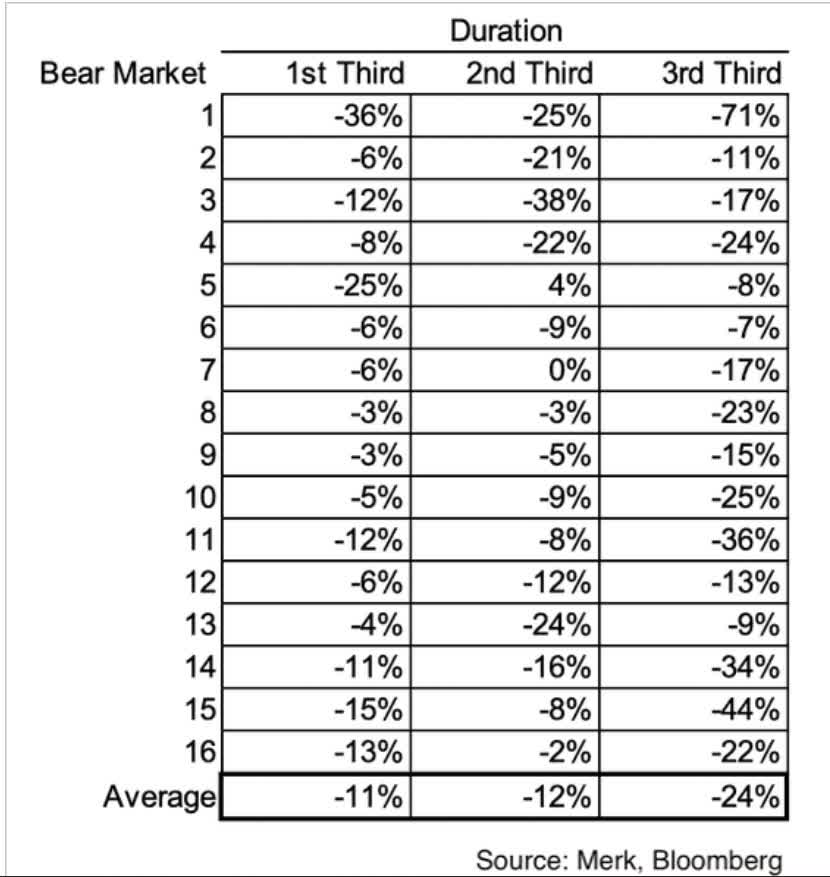
Historically speaking the last third of a bear market is the worst, generating 60% of the total decline.
On the other hand, an estimated $2.6 trillion in excess savings and the hottest job market in over 50 years could allow us to avoid a recession entirely if inflation keeps coming down at a steady rate.
What is the market likely to do next? That’s anyone’s guess but here’s what’s important for you to remember.
It’s always and forever a market of stocks, not a stock market. Blue-chip bargain hunting opportunities are still available even if the market trades sideways for the next year and doesn’t provide us with new terrifying/glorious lows. If you know where to look.
Let me show you why Comcast (NASDAQ:CMCSA), one of my favorite fast-growth dividend blue-chip ideas right now, isn’t just a good buy. It’s a table-pounding Buffett-style “fat pitch” Ultra Value buy.
Comcast’s P/E Is The Lowest It’s Been In 18 Years
FAST Graphs, FactSet
There are five reasons why it’s literally the best time in 18 years to buy Comcast, at today’s 7.1X cash-adjusted P/E, valuations only ever seen in the Great Recession and Pandemic crash.
Reason One: Comcast’s Earnings Crash Is An Overreaction
Here is my deep dive look into Comcast from a month ago. Here’s what’s changed after earnings.
I recommended CMCSA last on July 6th. Going into earnings, it was up 6% from that video.
Ycharts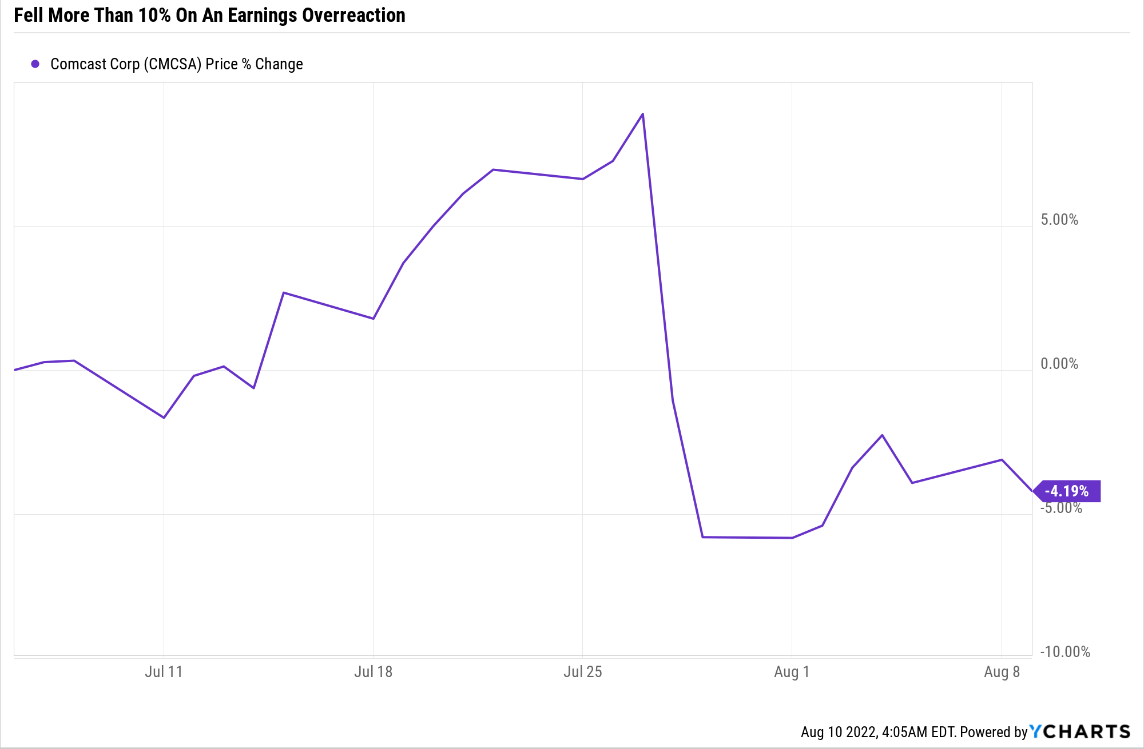
It then fell over 10% on the “disappointing” earnings that weren’t that bad.
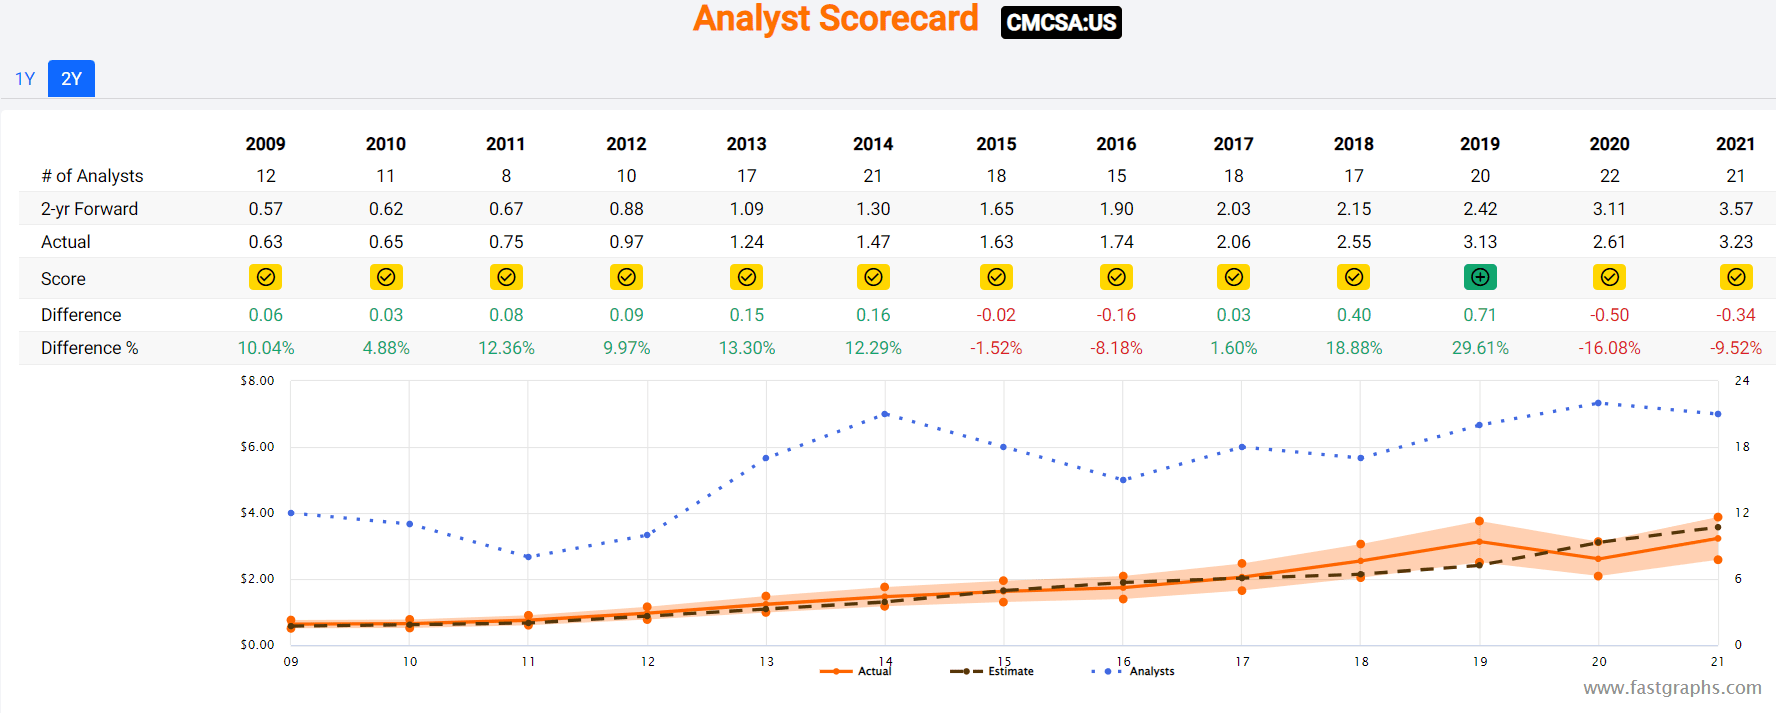
- which is the consensus of our 48 expert panel
- every analyst, rating agency, and the bond market
- collectively this panel knows CMCSA better than anyone other than management
Earnings Update: Why Comcast Isn’t A Value Trap
Comcast Stock Deeply Undervalued as Market Misinterprets Zero Growth…
Comcast’s second quarter was a mixed bag, but the market has keyed in on one negative figure: zero net broadband customer additions during the period, with a loss of 10,000 net residential customers. Very modest broadband growth is likely here to stay; we believe investors are better served focusing on the firm’s ability to generate strong cash flow despite lingering pandemic headwinds and to return that cash to shareholders. Our $60 fair value estimate is unchanged.
In my last video, in the risk section, I talked about how CMCSA’s subscriber base was expected to shrink in the coming years.
- Greater revenue/account + buybacks + cost cutting = how CMCSA was and still is expected to deliver double-digit growth in the long-term
CEO Brian Roberts outlined three reasons for the drop-off in customer growth: economic conditions that have slowed consumer move rates, the reversal of pandemic-driven trends, and competitive pressures including fixed wireless. None of these is a revelation. Comcast again insisted that customer churn remains extremely low, but that the overall volume and its share of new customer connections have dropped sharply. Part of this weakness reflects the return of normal seasonal patterns-for the decade through 2019, the second quarter was the weakest quarter for broadband customer growth every year, with a 10-year average of 185,000 net additions in what was a much less mature business than it is today. With over 32 million broadband customers, very small changes in consumer activity can produce big swings in Comcast’s quarterly customer additions.” – Morningstar
CMCSA’s risk factors that were more than priced into a very high margin of safety remain, but today the margin of safety is slightly better.
Roberts was also the latest cable executive to largely dismiss the fixed-wireless threat, stating that wireless network capacity is fundamentally limited. We agree. On its earnings call, T-Mobile declined to update the number of fixed-wireless customers it believes it can serve (7 million-8 million by the middle of this decade) despite adding 560,000 customers during the quarter. It said it won’t take on customers it can’t serve well. We also believe that T-Mobile and its peers won’t risk degrading the service provided to their core wireless phone customers to add a relatively small amount of broadband revenue.” – Morningstar
The largest threat to CMCSA’s core business is turning out not to be as big a threat as previously expected, that’s a good thing, despite what the stock price might have you believe.
Earnings Call Highlights
We grew second quarter consolidated revenue by 5%, adjusted EBITDA by 10%, and adjusted EPS by 20%.” – CEO, Q2 conference call
CMCSA’s bottom line results were fantastic.
While we’ve added nearly 800,000 broadband subscribers in the past 12 months, more recently, that pace has slowed, and we posted flat broadband subscriber additions in the second quarter. – CEO, Q2 conference call
Flat growth in Q2 but still modest growth in broadband subscribers over the past year.
Turning to capital allocation, we repurchased $3 billion worth of our shares in the quarter. In addition, dividend payments totaled $1.2 billion for a total return of capital in the second quarter of $4.2 billion. We ended the quarter with net leverage at 2.3 times in line with our expectations for leverage to remain around 2.4 times going forward.” – CFO, Q2 conference call
Comcast bought back nearly 2% of its shares in Q2 at some of the best valuations in the company’s history.
- Analysts expect $12.3 billion in buybacks this year.
- and $84 billion through 2027
- CMCSA is on track to achieve that
Reason Two: Comcast Is The Complete Dividend Growth Blue-Chip Package
Here’s the bottom line up front on Comcast after earnings.
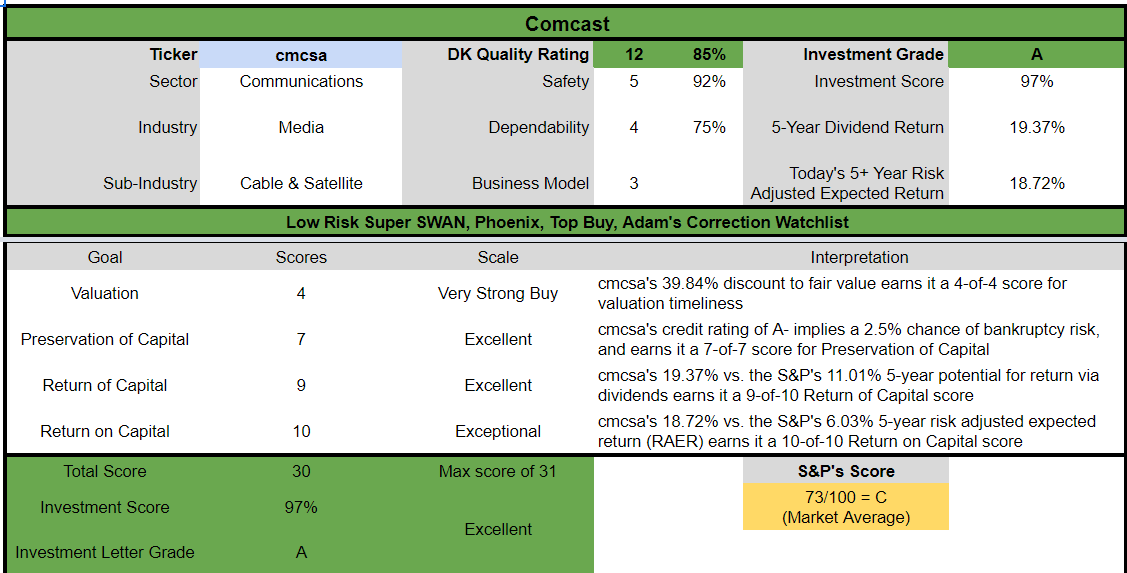
Reasons To Potentially Buy CMCSA Today
- 86% quality low-risk 12/13 Super SWAN telecom
- 145th highest quality company on the Master List (71st percentile)
- 93% dividend safety score
- 14-year dividend growth streak (every year since it began paying one)
- 2.8% very safe yield
- 0.5% average recession dividend cut risk
- 1.35% severe recession dividend cut risk
- 40% conservatively undervalued (potential Ultra Value Buy)
- Fair Value: $63.43 (16.8X earnings)
- 10.1X forward earnings vs. 17.5X to 18.0X historical
- 7.1X cash-adjusted earnings = anti-bubble blue-chip priced for -4.8% growth
- A- stable outlook credit rating = 2.5% 30-year bankruptcy risk
- 60th industry percentile risk management consensus = above-average
- 8% to 15% margin-of-error growth consensus range (12% to 20% CAGR last time)
- 12.5% CAGR median growth consensus (Vs. 13.7% last time) = 0.57 PEG = growth at a wonderful price
- 5-year consensus total return potential: 25% to 26% CAGR (25% to 27% last time)
- base-case 5-year consensus return potential: 26% CAGR (5X more than the S&P consensus)
- consensus 12-month total return forecast: 30% (vs. 35% last time)
- Fundamentally Justified 12-Month Returns: 69% (Vs. 63% last time)
CMCSA Long-Term Growth Outlook Is Intact
| Metric | 2021 Growth Consensus | 2022 Growth Consensus | 2023 Growth Consensus | 2024 Growth Consensus | 2025 Growth Consensus | 2026 Growth Consensus |
2027 Growth Consensus |
| Sales | 12% | 9% | 0% | 3% | 2% | 4% | 1% |
| Dividend | 9% | 8% (Official) | 7% | 9% | 6% | 1% | 9% |
| EPS | 24% | 11% | 8% | 12% | 13% | 20% | 18% |
| Operating Cash Flow | 17% | -2% | 8% | 9% | 16% | 28% | 27% |
| Free Cash Flow | 28% | -11% | 9% | 10% | 16% | 28% | 26% |
| EBITDA | 12% | 11% | 2% | 5% | NA | NA | NA |
| EBIT (operating income) | 17% | 15% | 3% | 7% | NA | NA | NA |
(Source: FAST Graphs, FactSet)
Does this look like a dying company? A value trap? A company on its way to zero? A company that should be trading at 7.1X cash-adjusted earnings?
It’s literally the best time in 18 years to buy Comcast, on par with the Pandemic lows and the depths of the Great Recession.
The Last Time Comcast Was This Cheap… This Happened
Portfolio Visualizer Premium
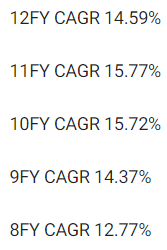
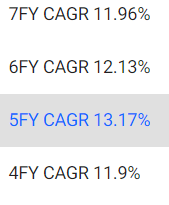
Historically when CMCSA is this undervalued, it delivered Buffett-like returns over the next 1 to 15 years.
- up to 9X over the next seven years
- up to 14X over the next 10 years
- up to 10X over the next 15 years
CMCSA 2024 Consensus Total Return Potential
(Source: FAST Graphs, FactSet) (Source: FAST Graphs, FactSet)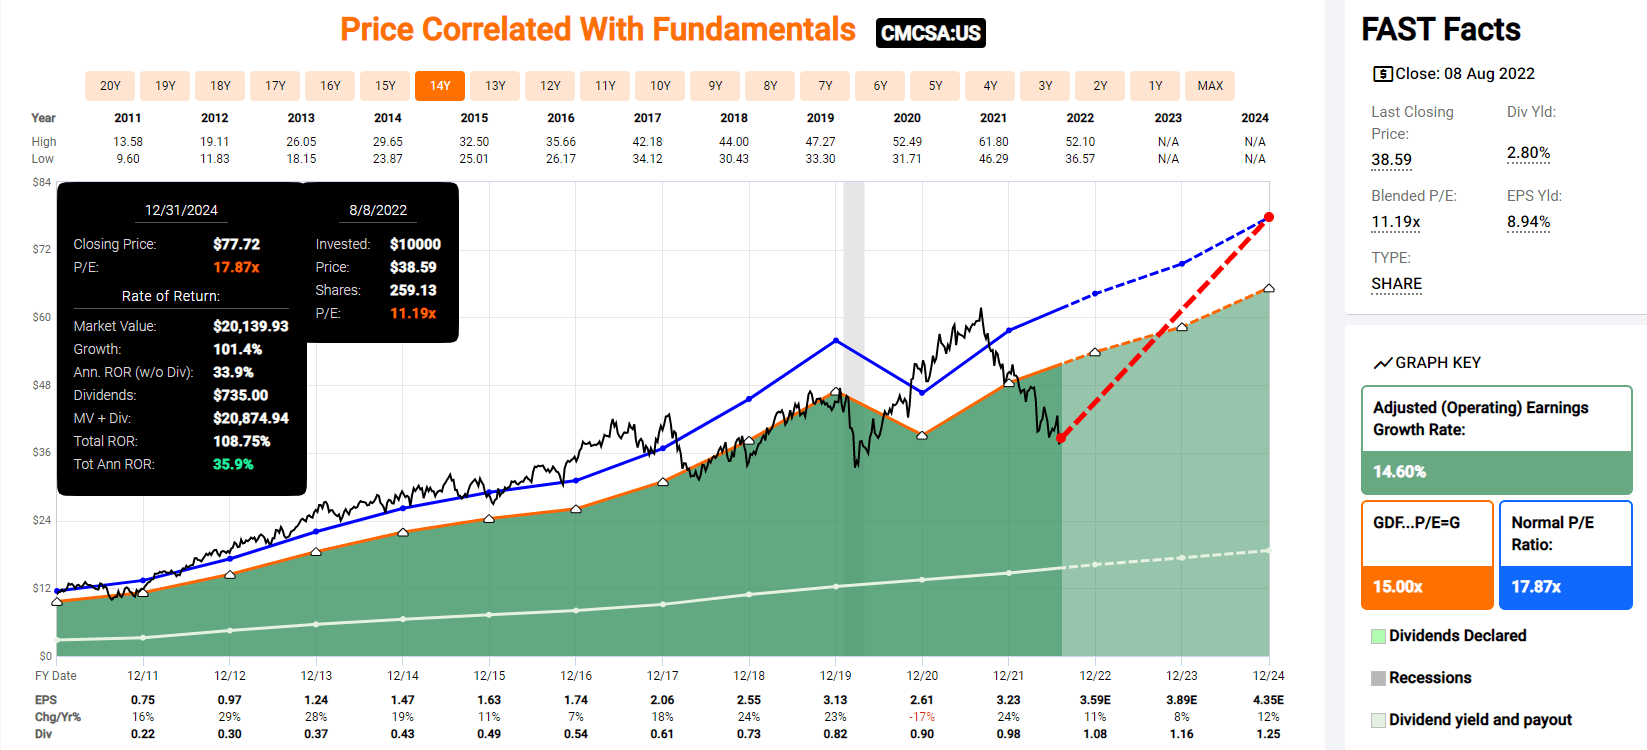
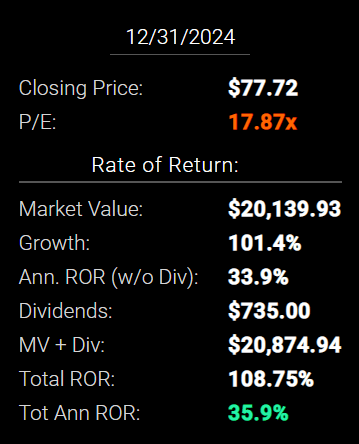
If CMCSA grows as analysts expect by 2024 and returns to historical mid-range fair value, it could deliver 108% total returns or 36% annually.
- 4X the S&P 500 consensus
- Buffett and Joel Greenblatt-like returns from an anti-bubble blue-chip bargain hiding in plain sight
Now compare it to the S&P 500 consensus.
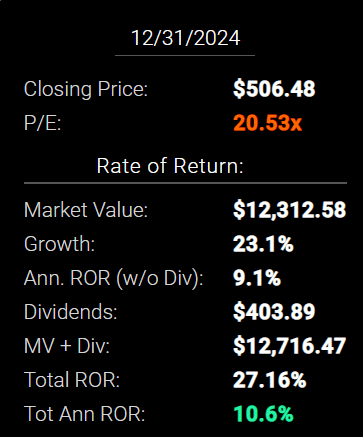
S&P 500 2024 Consensus Total Return Potential
(Source: FAST Graphs, FactSet) (Source: FAST Graphs, FactSet)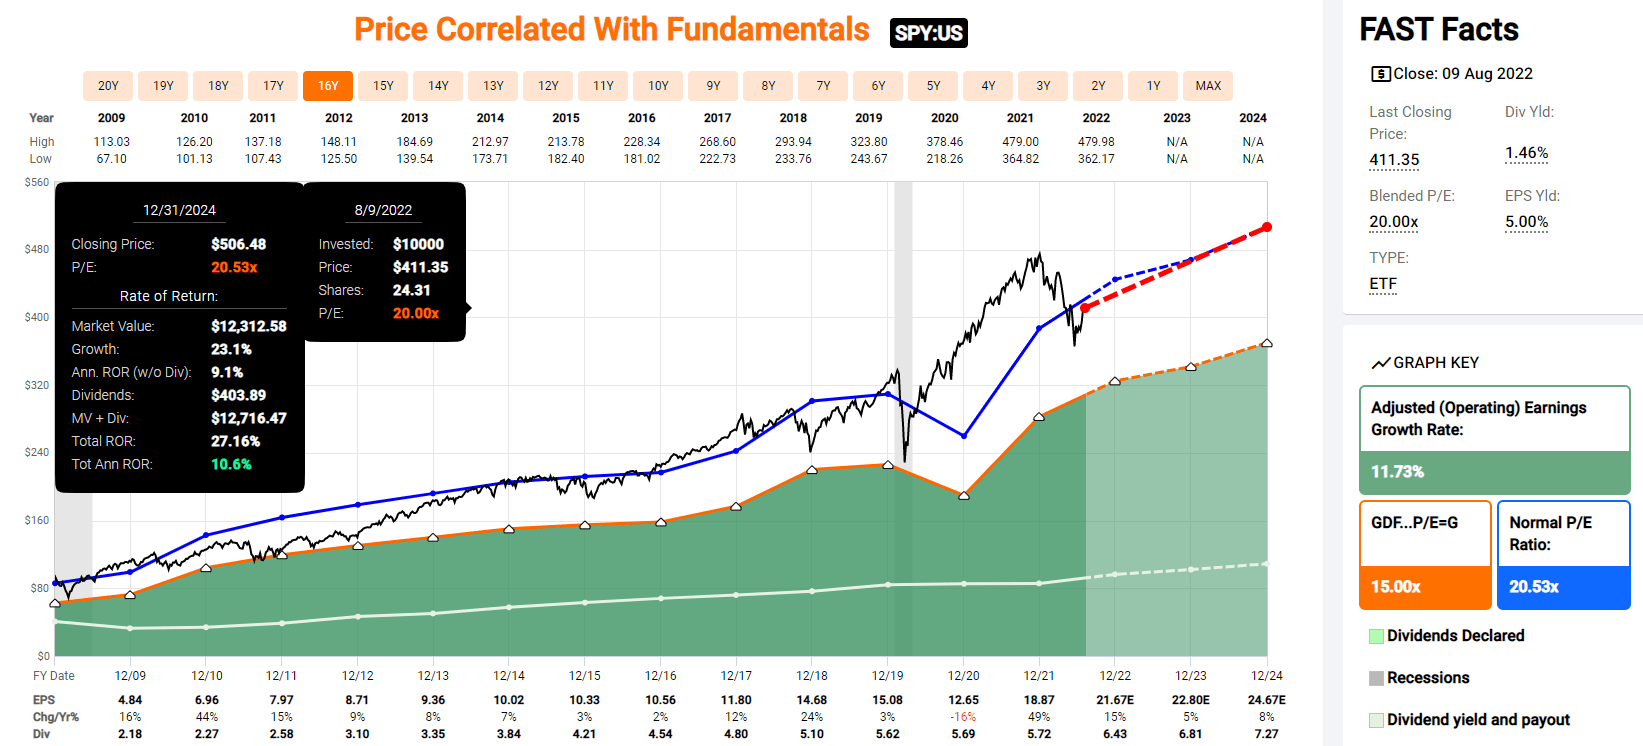
CMCSA 2027 Consensus Total Return Potential
(Source: FAST Graphs, FactSet) (Source: FAST Graphs, FactSet)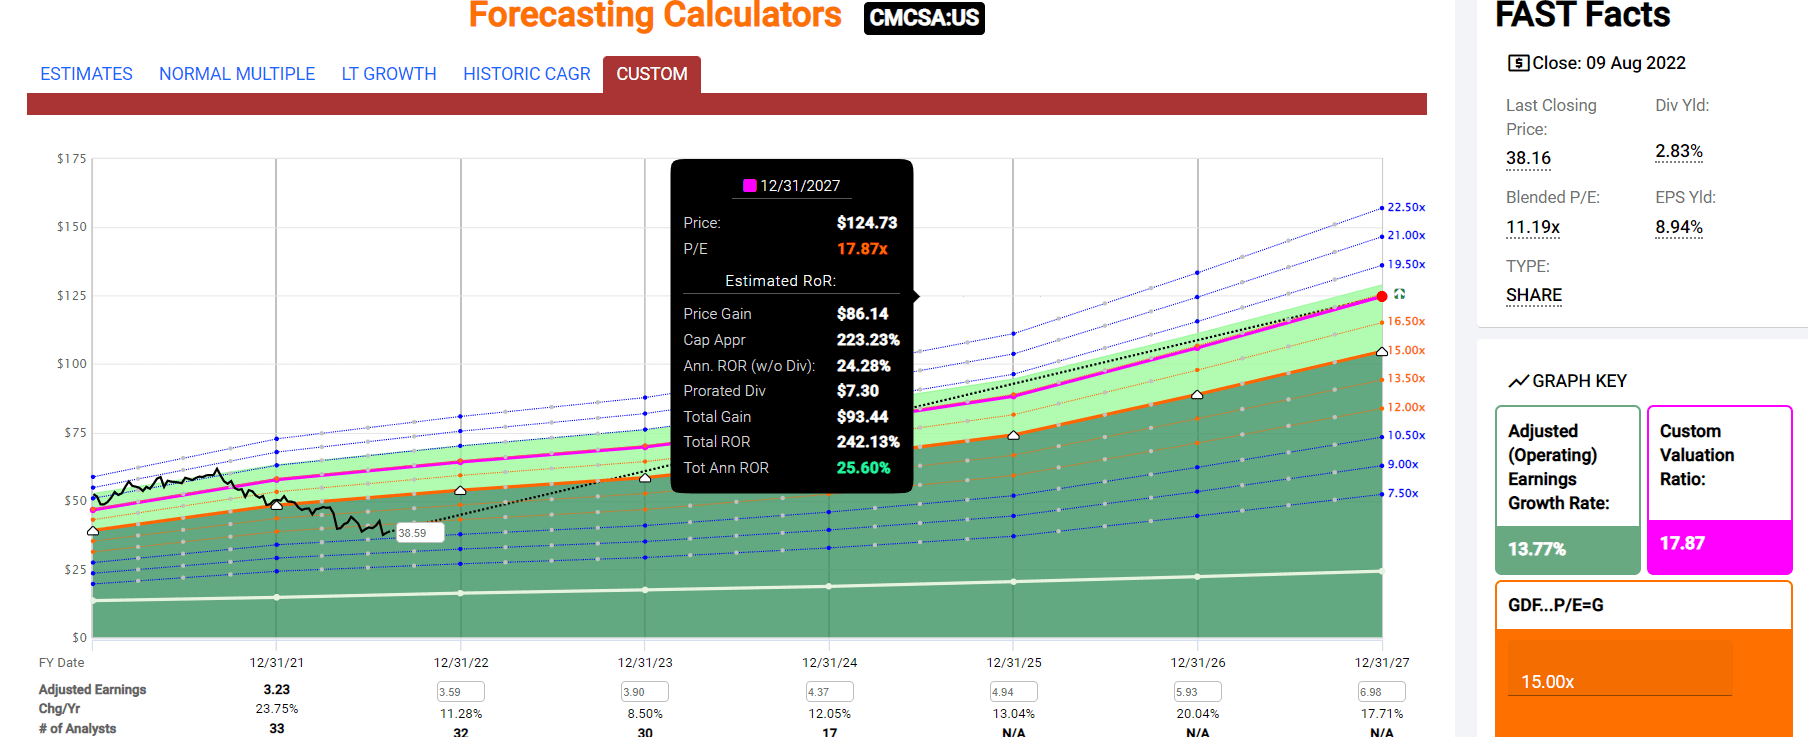
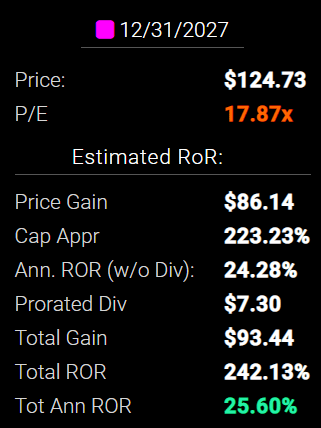
By 2027 if CMCSA grows as expected and returns to historical mid-range fair value, it could deliver 242% total returns or 26% annually.
- 5X more than the S&P 500 consensus
- Buffett and Peter Lynch-like returns from an anti-bubble blue-chip bargain hiding in plain sight.
S&P 500 2027 Consensus Total Return Potential
| Year | Upside Potential By End of That Year | Consensus CAGR Return Potential By End of That Year | Probability-Weighted Return (Annualized) |
Inflation And Risk-Adjusted Expected Returns |
| 2027 | 47.21% | 8.04% | 6.03% | 3.75% |
(Source: DK S&P 500 Valuation & Total Return Potential Tool)
CMCSA Long-Term Consensus Total Return Potential
| Investment Strategy | Yield | LT Consensus Growth | LT Consensus Total Return Potential | Long-Term Risk-Adjusted Expected Return | Long-Term Inflation And Risk-Adjusted Expected Returns | Years To Double Your Inflation & Risk-Adjusted Wealth |
10-Year Inflation And Risk-Adjusted Expected Return |
| Comcast | 2.8% | 12.5% | 15.3% | 10.7% | 8.5% | 8.5 | 2.26 |
| Dividend Aristocrats | 2.5% | 8.6% | 11.0% | 7.7% | 5.5% | 13.1 | 1.71 |
| S&P 500 | 1.6% | 8.5% | 10.1% | 7.1% | 4.9% | 14.8 | 1.61 |
| Nasdaq | 1.0% | 14.3% | 15.3% | 10.7% | 8.5% | 8.5 | 2.25 |
(Sources: Morningstar, FactSet, Ycharts) – ignoring valuations that cancel out over 30+ years
- analysts expect CMCSA to deliver 15.3% long-term returns, similar to what it’s done historically (17% average annual return since 1988)
- more than most popular investment strategies such as the aristocrats and S&P 500
- potentially matching the Nasdaq’s returns with 3X higher yield on day one
A Dividend Growth Blue-Chip You Can Trust
(Source: Portfolio Visualizer Premium) special dividends in several years, no cuts in the regular dividend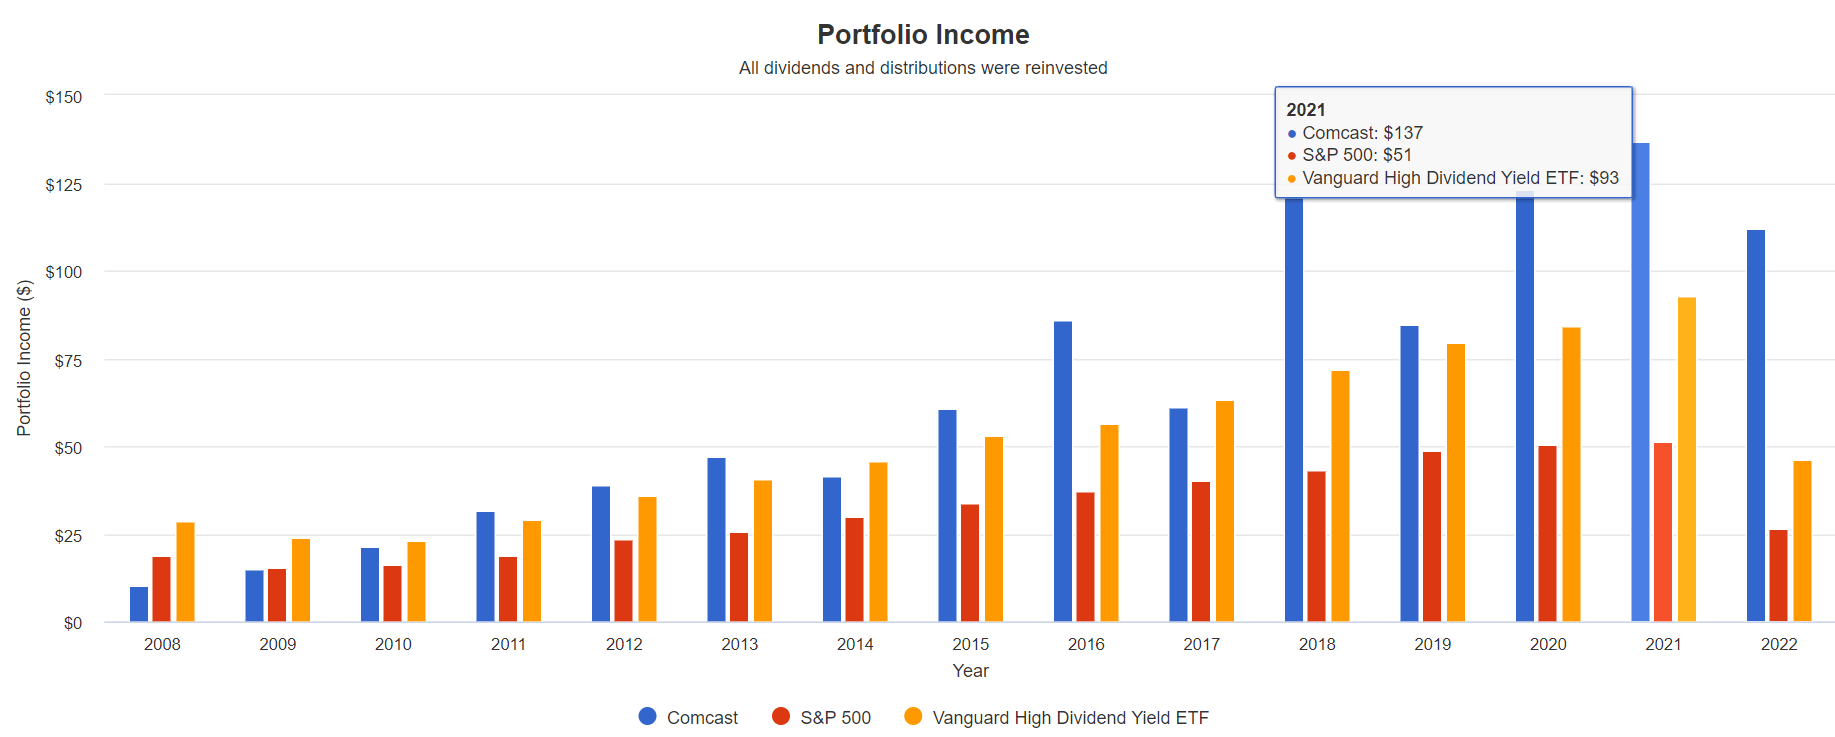
(Source: Portfolio Visualizer Premium) special dividends in several years, no cuts in the regular dividend
| Portfolio | 2008 Income Per $1000 Investment | 2022 Income Per $1000 Investment | Annual Income Growth | Starting Yield |
2022 Yield On Cost |
| S&P 500 | $19 | $54 | 7.75% | 1.9% | 5.4% |
| Vanguard High Dividend ETF | $29 | $92 | 8.60% | 2.9% | 9.2% |
| Nasdaq | $3 | $42 | 20.74% | 0.3% | 4.2% |
| Comcast | $10 | $224 | 24.87% | 1.0% | 22.4% |
(Source: Portfolio Visualizer Premium)
CMCSA’s income growth over the last 14 years has been an incredible 25% per year, beating even the Nasdaq’s 21% and tripling the growth rate of VYM.
- QQQM is the gold standard of fast-dividend growth ETFs
- VIG is the gold standard of dividend growth ETFs
- VYM and SCHD are the gold standards of high-yield ETFs
Comcast Cumulative Dividends Since 2008: $1,000 Initial Investment
| Metric | S&P 500 | Comcast |
| Total Dividends | $506 | $1,104 |
| Annualized Income Growth Rate | 7.75% | 24.87% |
| Total Income/Initial Investment | 0.51 | 1.10 |
| Inflation-Adjusted Income/Initial Investment | 0.36 | 0.79 |
| More Inflation-Adjusted Income Than The S&P 500 | 2.18 |
(Source: Portfolio Visualizer Premium)
Comcast has repaid its initial investment 110% since it began paying a dividend in 2008, 79% adjusted for inflation. That’s more than 2X the real income of the S&P 500.
What about the future?
Comcast Consensus Future Income Growth Forecast
| Analyst Consensus Income Growth Forecast | Risk-Adjusted Expected Income Growth | Risk And Tax-Adjusted Expected Income Growth |
Risk, Inflation, And Tax Adjusted Income Growth Consensus |
| 30.9% | 21.7% | 18.4% | 16.2% |
(Source: DK Research Terminal, FactSet)
Thanks to a much higher yield and similar growth prospects, analysts expect 21% income growth from CMCSA in the future, which adjusted for the risk of it not growing as expected, inflation, and taxes are about 10.2% real expected income growth.
Now compare that to what they expect from the S&P 500.
| Time Frame | S&P Inflation-Adjusted Dividend Growth | S&P Inflation-Adjusted Earnings Growth |
| 1871-2021 | 1.6% | 2.1% |
| 1945-2021 | 2.4% | 3.5% |
| 1981-2021 (Modern Falling Rate Era) | 2.8% | 3.8% |
| 2008-2021 (Modern Low Rate Era) | 3.5% | 6.2% |
| FactSet Future Consensus | 2.0% | 5.2% |
(Sources: S&P, FactSet, Multipl.com)
- 1.7% CAGR inflation and tax-adjusted S&P 500 income growth
- 5.8% CAGR is the historical inflation and tax adjusted income growth rate for the S&P 500
What about a 60/40 retirement portfolio?
- 0.5% consensus inflation, risk, and tax-adjusted income growth.
In other words, CMCSA is could generate 3X to 9X faster real income growth than the S&P 500 and up to 32X faster income growth than a 60/40.
- and with a 1% higher yield from day one
Inflation-Adjusted Consensus Return Potential: $1,000 Initial Investment
| Time Frame (Years) | 7.9% CAGR Inflation-Adjusted S&P Consensus | 8.8% Inflation-Adjusted Aristocrat Consensus | 13.1% CAGR Inflation-Adjusted CMCSA Consensus | Difference Between Inflation-Adjusted CMCSA Consensus And S&P Consensus |
| 5 | $1,461.18 | $1,523.16 | $1,848.97 | $387.78 |
| 10 | $2,135.06 | $2,320.01 | $3,418.68 | $1,283.62 |
| 15 | $3,119.71 | $3,533.75 | $6,321.02 | $3,201.31 |
| 20 | $4,558.47 | $5,382.46 | $11,687.35 | $7,128.88 |
| 25 | $6,660.75 | $8,198.35 | $21,609.51 | $14,948.76 |
| 30 | $9,732.58 | $12,487.39 | $39,955.26 | $30,222.68 |
(Source: DK Research Terminal, FactSet) – ignoring valuation
Even if CMCSA only grows as expected for a decade, that’s still a potential 3.4X inflation-adjusted return.
- Ignoring its anti-bubble valuation entirely
| Time Frame (Years) | Ratio Aristocrats/S&P Consensus | Ratio Inflation-Adjusted CMCSA Consensus vs. S&P consensus |
| 5 | 1.04 | 1.27 |
| 10 | 1.09 | 1.60 |
| 15 | 1.13 | 2.03 |
| 20 | 1.18 | 2.56 |
| 25 | 1.23 | 3.24 |
| 30 | 1.28 | 4.11 |
(Source: DK Research Terminal, FactSet)
Which is potentially 60% more than the S&P 500 and 47% more than the dividend aristocrats
CMCSA Investment Decision Score
DK (Source: DK Automated Investment Decision Tool)
For anyone comfortable with its risk profile, CMCSA is one of the most reasonable and prudent fast-growing dividend blue-chips you can buy.
- 40% discount vs 4% market premium = 44% better valuation
- 2.8% yield vs. 1.6% yield (and a much safer yield at that)
- potentially 50% higher long-term return potential than S&P 500 overtime
- 3X better risk-adjusted expected return over the next five years
- 2X the consensus dividends over the next five years
Reason Three: Comcast Is Still One Of The World’s Greatest Companies
There are many ways to measure safety and quality, and I factor in pretty much all of them.
The Dividend Kings’ overall quality scores are based on a 257-point model that includes:
-
Dividend safety
-
Balance sheet strength
-
Credit ratings
-
Credit default swap medium-term bankruptcy risk data
-
Short and long-term bankruptcy risk
-
Accounting and corporate fraud risk
-
Profitability and business model
-
Growth consensus estimates
-
Management growth guidance
-
Historical earnings growth rates
-
Historical cash flow growth rates
-
Historical dividend growth rates
-
Historical sales growth rates
-
Cost of capital
-
GF Scores
-
Morningstar business model uncertainty score
-
Long-term risk-management scores from MSCI, Morningstar, FactSet, S&P, Reuters’/Refinitiv, and Just Capital
-
Management quality
-
Dividend-friendly corporate culture/income dependability
-
Long-term total returns (a Ben Graham sign of quality)
-
Analyst consensus long-term return potential
It includes over 1,000 fundamental metrics, including the 12 rating agencies we use to assess fundamental risk.
-
credit and risk management ratings make up 41% of the DK safety, and quality model
-
dividend/balance sheet/risk ratings make up 82% of the DK safety and quality model
How do we know that our safety and quality model works well?
During the two worst recessions in 75 years, our safety model 87% of blue-chip dividend cuts, the ultimate baptism by fire for any dividend safety model.
How does CMCSA score on our comprehensive safety and quality models?
CMCSA Dividend Safety
| Rating | Dividend Kings Safety Score (165 Point Safety Model) | Approximate Dividend Cut Risk (Average Recession) | Approximate Dividend Cut Risk In Pandemic Level Recession |
| 1 – unsafe | 0% to 20% | over 4% | 16+% |
| 2- below average | 21% to 40% | over 2% | 8% to 16% |
| 3 – average | 41% to 60% | 2% | 4% to 8% |
| 4 – safe | 61% to 80% | 1% | 2% to 4% |
| 5- very safe | 81% to 100% | 0.5% | 1% to 2% |
| CMCSA | 93% | 0.50% | 1.40% |
| Risk Rating | Low-Risk (60th industry percentile risk-management consensus) | A- stable outlook credit rating 2.5% 30-year bankruptcy risk | 15% OR LESS Max Risk Cap Recommendation |
Long-Term Dependability
| Company | DK Long-Term Dependability Score | Interpretation | Points |
| Non-Dependable Companies | 21% or below | Poor Dependability | 1 |
| Low Dependability Companies | 22% to 60% | Below-Average Dependability | 2 |
| S&P 500/Industry Average | 61% (61% to 70% range) | Average Dependability | 3 |
| Above-Average | 71% to 80% | Very Dependable | 4 |
| Very Good | 81% or higher | Exceptional Dependability | 5 |
| CMCSA | 75% | Very Dependable | 4 |
Overall Quality
| CMCSA | Final Score | Rating |
| Safety | 91% | 5/5 Very Safe |
| Business Model | 90% | 3/3 Wide and Stable Moat |
| Dependability | 75% | 4/5 Very Dependable |
| Total | 86% | 12/13 Super SWAN |
| Risk Rating | 4/5 Low-Risk | |
| 15% OR LESS Max Risk Cap Rec |
10% Margin of Safety For A Potentially Good Buy |
- quality falls by 1% (not significant) to 86%
- risk rating upgraded to low from medium (60th percentile risk management consensus vs. 57th last time)
CMCSA is the 147th (down from 118th) highest quality company on the DK 500 Masterlist.
- 71st percentile (down from 76th)
How significant is this? The DK 500 Master List is one of the world’s best watchlists, including
- every dividend aristocrat (S&P companies with 25+ year dividend growth streaks)
- every dividend champion (every company, including foreign, with 25+ year dividend growth streaks)
- every dividend king (every company with 50+ year dividend growth streaks)
- every foreign aristocrat (every company with 20+ year dividend growth streaks)
- Ultra SWANs (wide moat aristocrats and future aristocrats)
- 40 of the world’s best growth stocks
In other words, even among the world’s best companies, CMCSA is higher quality than 71% of them. It’s similar to quality to:
- Walmart (WMT): Ultra SWAN dividend aristocrat
- AbbVie (ABBV): Ultra SWAN dividend king
- Nestle (OTCPK:NSRGY): Ultra SWAN global aristocrat
- Coca-Cola (KO): Ultra SWAN dividend king
Why I Trust Comcast And So Can You
See section two of this article for a deep dive into Comcast’s full investment thesis.
Quantitative Analysis: The Math Backing Up The Investment Thesis
Ben Graham recommended combining qualitative (the story) analysis with quantitative analysis looking at the past, present, and likely future.
CMCSA Credit Ratings
| Rating Agency | Credit Rating | 30-Year Default/Bankruptcy Risk | Chance of Losing 100% Of Your Investment 1 In |
| S&P | A- Stable Outlook | 2.50% | 40.0 |
| Fitch | A- Stable Outlook | 2.50% | 40.0 |
| Moody’s | A3 (A- equivalent) Stable Outlook | 2.50% | 40.0 |
| Consensus | A- Stable Outlook | 2.50% | 40.0 |
(Source: S&P, Fitch, Moody’s)
Rating agencies estimate CMCSA’s fundamental risk at 2.5%, or a 1 in 40 chance of losing all your money over the next 30 years.
CMCSA Leverage Consensus Forecast
| Year | Debt/EBITDA | Net Debt/EBITDA (3.5 Or Less Safe According To Credit Rating Agencies) |
Interest Coverage (4+ Safe) |
| 2021 | 2.73 | 2.48 | 4.86 |
| 2022 | 2.49 | 2.38 | 5.88 |
| 2023 | 2.48 | 2.35 | 6.00 |
| 2024 | 2.30 | 2.29 | 6.48 |
| 2025 | 2.17 | 2.23 | 6.80 |
| 2026 | 2.25 | 2.18 | 7.25 |
| 2027 | 2.13 | 2.23 | 7.63 |
| Annualized Change | -4.04% | -1.74% | 7.80% |
(Source: FactSet Research Terminal)
Leverage is coming down steadily while interest coverage is rising rapidly.
CMCSA Balance Sheet Consensus Forecast
| Year | Total Debt (Millions) | Cash | Net Debt (Millions) | Interest Cost (Millions) | EBITDA (Millions) | Operating Income (Millions) | Average Interest Rate |
| 2021 | $94,850 | $8,711 | $86,139 | $4,281 | $34,707 | $20,817 | 4.51% |
| 2022 | $92,488 | $4,159 | $88,386 | $3,938 | $37,072 | $23,160 | 4.26% |
| 2023 | $94,105 | $4,375 | $89,273 | $3,980 | $37,927 | $23,869 | 4.23% |
| 2024 | $91,142 | $5,169 | $90,752 | $3,916 | $39,641 | $25,368 | 4.30% |
| 2025 | $88,751 | $6,124 | $91,068 | $3,868 | $40,874 | $26,299 | 4.36% |
| 2026 | $98,093 | $4,718 | $94,642 | $4,004 | $43,513 | $29,019 | 4.08% |
| 2027 | $95,542 | $12,711 | $100,033 | $3,959 | $44,770 | $30,217 | 4.14% |
| Annualized Growth | 0.12% | 6.50% | 2.52% | -1.29% | 4.33% | 6.41% | -1.41% |
(Source: FactSet Research Terminal)
CMCSA’s debt is expected to remain stable at around $90 billion net, with cash flows growing steadily over time.
The average borrowing cost is also expected to remain stable at around 4%.
CMCSA Bond Profile
(Source: FactSet Research Terminal)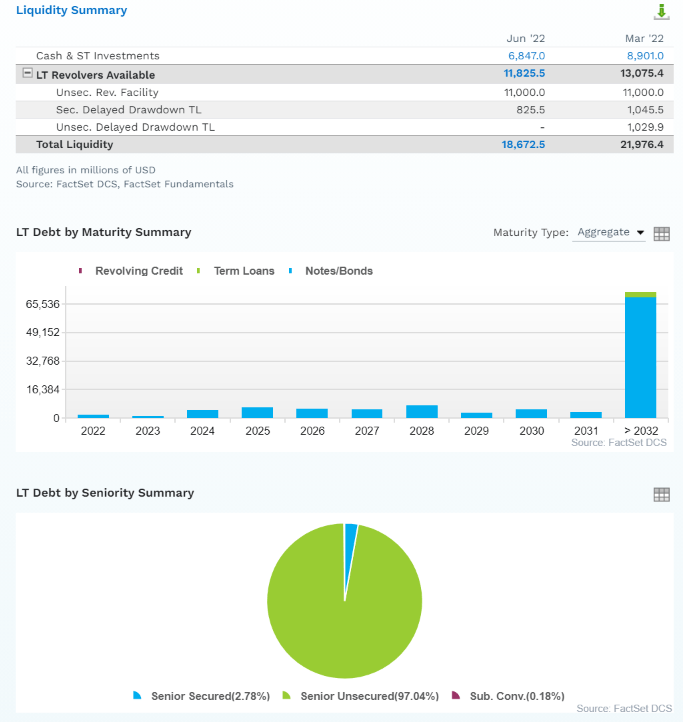
(Source: FactSet Research Terminal)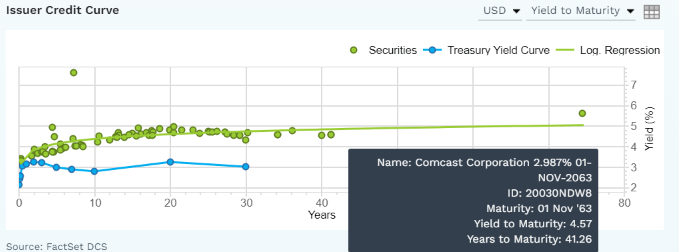
- $18.7 billion in liquidity
- well-staggered bond maturities (no problem refinancing maturing debt)
- 97% unsecured bonds for maximum financial flexibility
- bond investors are so confident in CMCSA’s long-term prospects they are willing to lend to it for 41 years at 4.6% (3% originally)
- the average borrowing cost is 4.12%
- 1.9% after the bond market’s 30-year inflation expectations
- 1.9% real borrowing costs vs. 9.1% cash returns on invested capital
CMCSA Credit Default SWAPs: Real-Time Fundamental Risk Analysis From The Bond Market
(Source: FactSet Research Terminal)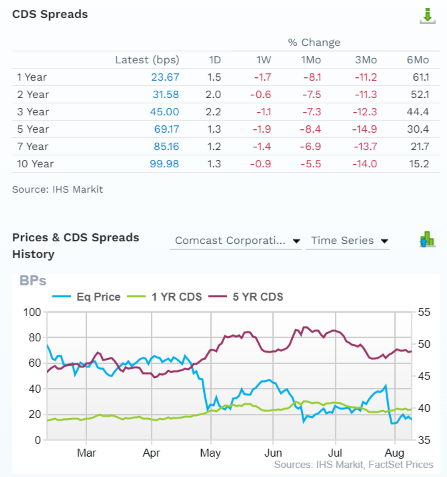
Credit default SWAPs are the insurance policies bond investors take out against default.
- they represent real-time fundamental risk assessment from the “smart money” on Wall Street
- CMCSA’s fundamental risk has increased modestly in the last six months
- fundamental risk has fallen a bit in the last month as the price has gone down
- the bond market is pricing in a 3.0% 30-year default risk, which is consistent with its credit ratings
- 30-year default risk is down from 3.5% a month ago
- analysts, rating agencies, and the bond market all agree
- CMCSA’s thesis is intact
- 38 analysts, 8 rating agencies, and the bond market make up our CMCSA expert consensus
- 46 expert consensus + the bond market monitoring CMCSA’s risk profile
- how we track fundamental risk in real-time
- to ensure high-probability/low-risk investment recommendations
CMCSA Profitability: Wall Street’s Favorite Quality Proxy
(Source: GuruFocus Premium)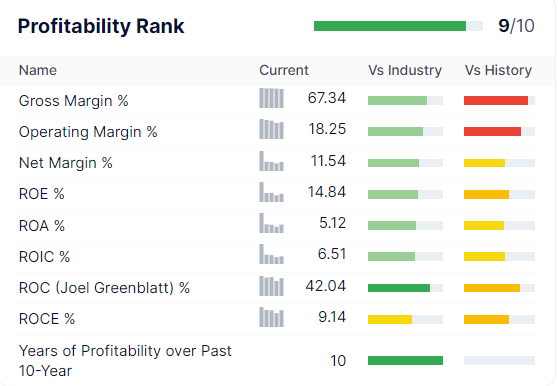
CMCSA’s profitability is historically in the top 10% of peers.
CMCSA Trailing 12-Month Profitability Vs. Peers
| Metric | TTM | Industry Percentile | Major Telecom Companies providers More Profitable Than CMCSA (Out Of 405) |
| Gross Margins | 67.34% | 78.26 | 88 |
| Operating Margin | 18.25% | 73.8 | 106 |
| Net Margin | 11.54% | 68.51 | 128 |
| Return On Equity | 14.84% | 66.49 | 136 |
| Return On Assets | 5.12% | 63.7 | 147 |
| Returns On Invested Capital | 6.51% | 63.03 | 150 |
| Return On Capital (Greenblatt) | 42.04% | 82.29 | 72 |
| Return On Capital Employed | 9.14% | 58.51 | 168 |
| Average | 21.85% | 69.32 | 124 |
(Source: GuruFocus Premium)
Profitability has taken a hit in the last year but the return on capital is still in the top 18% of its peers.
CMCSA Profit Margin Consensus Forecast
| Year | FCF Margin | EBITDA Margin | EBIT (Operating) Margin | Net Margin | Return On Capital Expansion |
Return On Capital Forecast |
| 2021 | 14.7% | 29.8% | 17.9% | 12.2% | 1.25 | |
| 2022 | 12.5% | 30.4% | 19.0% | 11.4% | TTM ROC | 42.04% |
| 2023 | 13.3% | 30.9% | 19.4% | 12.3% | Latest ROC | 40.77% |
| 2024 | 14.5% | 31.4% | 20.1% | 12.8% | 2027 ROC | 52.46% |
| 2025 | 14.8% | 31.7% | 20.4% | 13.1% | 2027 ROC | 50.88% |
| 2026 | 15.4% | 32.5% | 21.7% | 14.2% | Average | 51.67% |
| 2027 | 16.2% | 33.1% | 22.3% | 14.9% | Industry Median | 14.44% |
| 2028 | NA | NA | NA | NA | CMCSA/Industry Median | 3.58 |
| Annualized Growth | 1.62% | 1.74% | 3.76% | 3.42% | Vs. S&P | 3.54 |
(Source: FactSet Research Terminal)
CMCSA’s margins are expected to steadily improver over time, with FCF margins rising to 16% by 2027.
Returns on capital are expected to grow by 25% over the next five years to 52%.
- return on capital is Joel Greenblatt’s gold standard proxy for quality and moatiness
- annual pretax profit/the money it takes to run the business
- 40% annual returns for 21 years
- one of the greatest investors in history
- S&P 500 ROC is 14.6%
- the average S&P investment takes about 7 years to pay for itself
- CMCSA’s ROC is expected to grow to 52%
- investment payback 2 years
- almost 4X better than the S&P and median industry peers
(Source: GuruFocus Premium)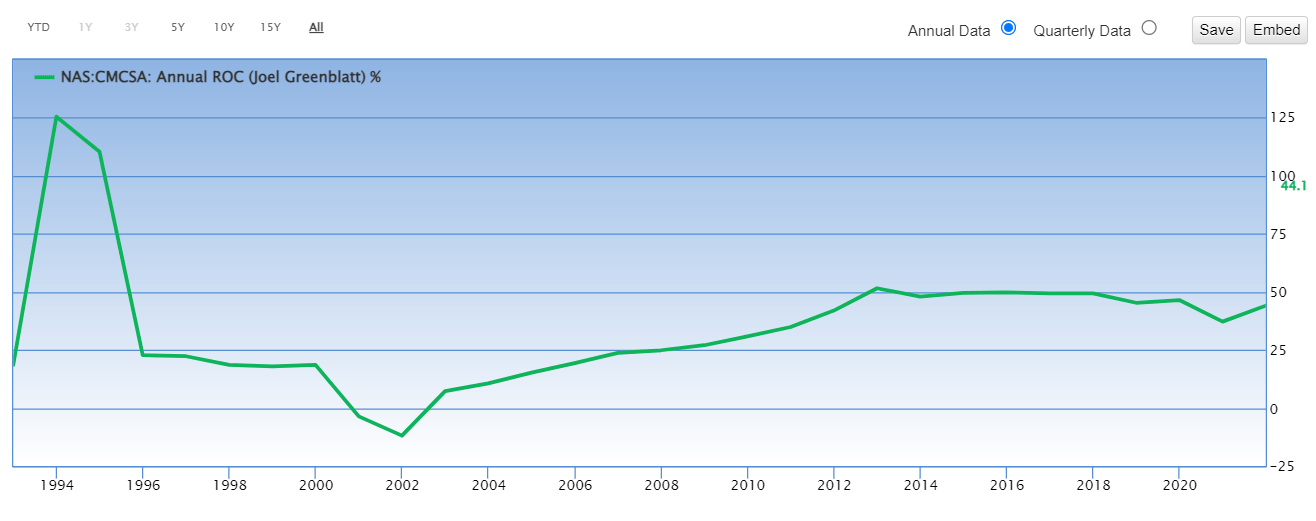
CMCSA’s ROC has been stable for 30 years, confirming its wide and stable moat.
Reason Four: Strong Growth Prospects Remain Driven By Buybacks And Cost Cutting
At 7.1X cash-adjusted earnings, CMCSA is priced for -2.8% growth. Here’s what analysts expect now.
CMCSA Medium-Term Growth Consensus Forecast
| Year | Sales | Free Cash Flow | EBITDA | EBIT (Operating Income) | Net Income |
| 2021 | $116,385 | $17,089 | $34,707 | $20,817 | $14,159 |
| 2022 | $121,804 | $15,286 | $37,072 | $23,160 | $13,932 |
| 2023 | $122,741 | $16,373 | $37,927 | $23,869 | $15,092 |
| 2024 | $126,164 | $18,250 | $39,641 | $25,368 | $16,128 |
| 2025 | $128,936 | $19,133 | $40,874 | $26,299 | $16,912 |
| 2026 | $133,939 | $20,616 | $43,513 | $29,019 | $19,075 |
| 2027 | $135,376 | $21,889 | $44,770 | $30,217 | $20,151 |
| Annualized Growth | 2.55% | 4.21% | 4.33% | 6.41% | 6.06% |
| Cumulative Next 2022-2027 | $768,960 | $111,547 | $243,797 | $157,932 | $101,290 |
(Source: FactSet Research Terminal)
CMCSA is growing its top line at a modest 3% though its bottom line is growing at mid-single digits.
$112 billion in total free cash flow is expected through 2027.
110% of net income converted into free cash flow.
- an excellent cash conversion ratio
- confirming good management, a very safe dividend, and minimal accounting fraud risk
CMCSA Dividend Growth Consensus Forecast
| Year | Dividend Consensus | FCF/Share Consensus | FCF Payout Ratio | Retained (Post-Dividend) Free Cash Flow | Buyback Potential | Debt Repayment Potential |
| 2022 | $1.08 | $3.31 | 32.6% | $9,841 | 5.84% | 10.5% |
| 2023 | $1.16 | $3.80 | 30.5% | $11,650 | 6.92% | 12.8% |
| 2024 | $1.26 | $4.53 | 27.8% | $14,431 | 8.57% | 15.8% |
| 2025 | $1.34 | $5.24 | 25.6% | $17,211 | 10.22% | 19.4% |
| 2026 | $1.43 | $6.69 | 21.4% | $23,212 | 13.78% | 23.7% |
| 2027 | $1.61 | $8.46 | 19.0% | $30,229 | 17.95% | 30.8% |
| Total 2022 Through 2027 | $7.88 | $32.03 | 24.6% | $106,573.95 | 63.28% | 116.93% |
| Annualized Rate | 8.3% | 20.6% | -10.2% | 25.2% | 25.2% | 24.1% |
(Source: FactSet Research Terminal)
70% is the safety guideline for FCF payout ratios for telecoms, according to rating agencies.
CMCSA is expected to grow the dividend at 8% annually over the next five years (up from 6.5% in the last video).
Buybacks are expected to drive 21% FCF/share growth and reduce the payout ratio from a very safe 33% to a ridiculously safe 19% by 2027.
Post dividend retained free cash flow through 2027 is expected to be $107 billion, enough to pay off 117% of current debt or buy back as much as 63% of its stock at current valuations.
CMCSA Buyback Consensus Forecast
| Year | Consensus Buybacks ($ Millions) | % Of Shares (At Current Valuations) | Market Cap |
| 2022 | $12,330 | 7.3% | $168,409 |
| 2023 | $12,408 | 7.4% | $168,409 |
| 2024 | $13,813 | 8.2% | $168,409 |
| 2025 | $13,933 | 8.3% | $168,409 |
| 2026 | $16,000 | 9.5% | $168,409 |
| 2027 | $16,000 | 9.5% | $168,409 |
| Total 2022 through 2024 | $84,484 | 50.2% | $168,409 |
| Annualized Rate | 10.91% | Average Annual Buybacks | $14,081 |
| 1% Buyback Tax | $845 | Average Annual Buyback Tax | $141 |
(Source: FactSet Research Terminal)
Analysts expect CMCSA to buy back $85 billion worth of stock in the next six years, averaging $14 billion annually.
- at current valuations, potentially up to 11% of shares repurchased each year
Ycharts
For the last 19 years, CMCSA has averaged 2.3% annual net buybacks.
| Time Frame (Years) | Net Buyback Rate | Shares Remaining | Net Shares Repurchased | Each Share You Own Is Worth X Times More (Not Including Future Growth And Dividends) |
| 5 | 2.3% | 89.02% | 10.98% | 1.12 |
| 10 | 2.3% | 79.24% | 20.76% | 1.26 |
| 15 | 2.3% | 70.54% | 29.46% | 1.42 |
| 20 | 2.3% | 62.79% | 37.21% | 1.59 |
| 25 | 2.3% | 55.89% | 44.11% | 1.79 |
| 30 | 2.3% | 49.76% | 50.24% | 2.01 |
(Source: DK Research Terminal, Ycharts)
If CMCSA continues its historical buyback rate, it will potentially repurchase 50% of its stock in the next 30 years.
- doubling the intrinsic value of your shares, not counting EPS or dividend growth
| Time Frame (Years) | Net Buyback Rate | Shares Remaining | Net Shares Repurchased | Each Share You Own Is Worth X Times More (Not Including Future Growth And Dividends) |
| 5 | 10.9% | 56.12% | 43.88% | 1.78 |
| 10 | 10.9% | 31.50% | 68.50% | 3.17 |
| 15 | 10.9% | 17.68% | 82.32% | 5.66 |
| 20 | 10.9% | 9.92% | 90.08% | 10.08 |
| 25 | 10.9% | 5.57% | 94.43% | 17.96 |
| 30 | 10.9% | 3.13% | 96.87% | 32.00 |
(Source: DK Research Terminal, FactSet)
At current valuations, if CMCSA buys back stock as aggressively as analysts expect, it could repurchase 97% of its stock, increasing the intrinsic value of your shares by 32X, not counting EPS or dividend growth, over the next 30 years.
CMCSA Long-Term Growth Outlook
(Source: FactSet Research Terminal)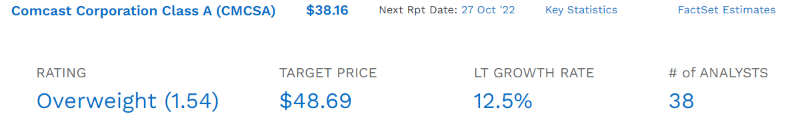
- 9.0 to 12.5% growth consensus range (four sources)
- the median consensus from all 38 analysts is 12.5%
FAST Graphs, FactSet Research FAST Graphs, FactSet Research
- Smoothing for outliers, historical analyst margins of error is 10% to the downside and 15% to the upside
- margin-of-error adjusted consensus growth range: 8% to 15% CAGR
- 70% statistical probability that CMCSA grows 8% to 15% over time
FAST Graphs, FactSet Research FAST Graphs, FactSet Research FAST Graphs, FactSet Research
CMCSA’s historical growth rates are low to mid-double-digits, and analysts think it will grow at a similar rate as the next eight years.
Reason Five: The Best Valuation In 18 Years
(Source: FAST Graphs, FactSet) (Source: FAST Graphs, FactSet)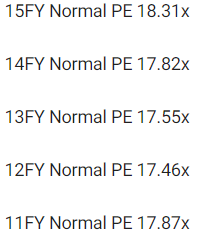
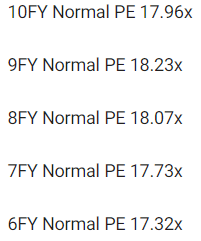
Over statistically significant periods, CMCSA has been valued by hundreds of millions of income growth investors at 17.5X earnings to 18.0X earnings outside of bear markets and bubbles.
- 90% statistical probability the intrinsic value is within this range
| Metric | Historical Fair Value Multiples (14-Years) | 2021 | 2022 | 2023 | 2024 |
12-Month Forward Fair Value |
| 5-Year Average Yield | 2.00% | $50.00 | $54.00 | $54.00 | $63.00 | |
| 13-Year Median Yield | 1.70% | $58.82 | $63.53 | $63.53 | $74.12 | |
| 13-Year Average Yield | 1.51% | $66.23 | $71.52 | $71.52 | $83.44 | |
| Earnings | 17.87 | $57.72 | $64.15 | $69.69 | $82.56 | |
| Average | $57.62 | $62.67 | $63.91 | $74.82 | $63.43 | |
| Current Price | $38.16 | |||||
|
Discount To Fair Value |
33.77% | 39.11% | 40.29% | 49.00% | 39.84% | |
|
Upside To Fair Value (NOT Including Dividends) |
50.99% | 64.22% | 67.48% | 96.07% | 66.22% (69% including dividend) | |
| 2022 EPS | 2023 EPS | 2021 Weighted EPS | 2022 Weighted EPS | 12-Month Forward EPS | 12-Month Average Fair Value Forward PE |
Current Forward PE |
| $3.59 | $3.90 | $1.38 | $2.40 | $3.78 | 16.8 | 10.1 |
I conservatively estimate CMCSA’s historical fair value at 16.8X earnings; today, it trades at 10.1X.
- 7.1X cash-adjusted earnings
- 0.57 PEG
- an anti-bubble, Buffett-style “fat pitch.”
|
Analyst Median 12-Month Price Target |
Morningstar Fair Value Estimate |
| $48.69 (12.5 PE) | $60.00 (15.9 PE) |
|
Discount To Price Target (Not A Fair Value Estimate) |
Discount To Fair Value |
| 21.63% | 36.40% |
|
Upside To Price Target (Not Including Dividend) |
Upside To Fair Value (Not Including Dividend) |
| 27.59% | 57.23% |
|
12-Month Median Total Return Price (Including Dividend) |
Fair Value + 12-Month Dividend |
| $49.77 | $61.08 |
|
Discount To Total Price Target (Not A Fair Value Estimate) |
Discount To Fair Value + 12-Month Dividend |
| 23.33% | 37.52% |
|
Upside To Price Target ( Including Dividend) |
Upside To Fair Value + Dividend |
| 30.42% | 60.06% |
Morningstar’s discounted cash flow model agrees with outs that CMCSA is about 40% undervalued with massive upside potential.
Analysts expect the P/E to expand to 12.5X within 12 months, generating a 30% total return.
- A 69% total return in the next 12 months would be 100% justified by CMCSA’s fundamentals.
I don’t recommend companies based on 12-month forecasts but on the margin of safety and whether or not it sufficiently compensates you for a company’s risk profile.
Margin Of Safety Not 12-Month Price Targets Are How I Make Investment Decisions.
| Rating | Margin Of Safety For Low-Risk 12/13 Quality Super SWANs | 2022 Fair Value Price | 2023 Fair Value Price |
12-Month Forward Fair Value |
| Potentially Reasonable Buy | 0% | $62.67 | $63.91 | $63.43 |
| Potentially Good Buy | 10% | $56.40 | $57.52 | $57.09 |
| Potentially Strong Buy | 20% | $50.13 | $51.13 | $50.75 |
| Potentially Very Strong Buy | 30% | $39.48 | $44.74 | $44.40 |
| Potentially Ultra-Value Buy | 40% | $37.60 | $38.35 | $38.06 |
| Currently | $38.16 | 39.11% | 40.29% | 39.84% |
| Upside To Fair Value (Not Including Dividends) | 64.22% | 67.48% | 66.22% |
CMCSA is a potentially very strong buy for anyone comfortable with its risk profile.
It’s 10 cents away from being an Ultra Value buy.
I round up and consider it an Ultra Value buy.
Risk Profile: Why Comcast Isn’t Right For Everyone
There are no risk-free companies, and no company is right for everyone. You have to be comfortable with the fundamental risk profile.
What Could Cause CMCSA’s Investment Thesis To Break
- safety falls to 40% or less
- balance sheet collapses (highly unlikely, 2.5% probability according to rating agencies)
- things like 5-G internet or satellite internet disrupt the core business
- growth outlook falls to less than 5.2% for six years
- CMCSA’s role in my portfolio is to deliver long-term 8+% returns with minimal fundamental risk
- 8+% total return requirement for defensive sectors (including telecoms)
- 10+% for non-defensive (cyclical) sectors – like industrials
How long it takes for a company’s investment thesis to break depends on the quality of the company.
| Quality |
Years For The Thesis To Break Entirely |
| Below-Average | 1 |
| Average | 2 |
| Above-Average | 3 |
| Blue-Chip | 4 |
| SWAN | 5 |
| Super SWAN | 6 |
| Ultra SWAN | 7 |
| 100% Quality Companies (MSFT, LOW, and MA) | 8 |
These are my rule of thumb for when to sell a stock if the investment thesis has broken. CMCSA is highly unlikely to suffer such catastrophic declines in fundamentals.
Risk Profile Summary
- regulatory risk (potentially increasing costs and decreasing pricing power)
- disruption risk: T-mobile is investing heavily into 5-G ultra-fast home internet, SpaceX and Amazon are investing in low-cost satellite internet
- M&A execution risk
- changing consumer tastes: cord-cutting
- talent retention risk in the tightest job market in 50 years
- cyber-security risk: hackers and ransomware
- currency risk: growing over time
(Source: FactSet Research Terminal)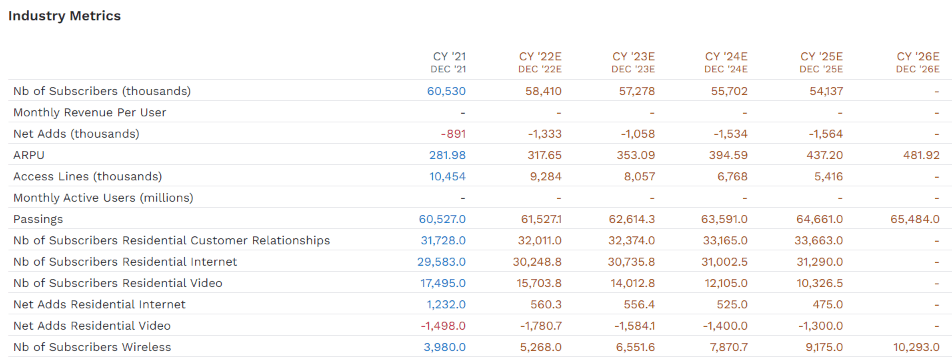
Analysts expect CMCSA’s subscriber base to shrink over time due to cord-cutting.
Cigarette volumes fall annually, but revenue and EPS go up for MO, BTI and PM.
And that’s why they are great dividend stocks. Cash flow per share growing at 21% CAGR is what counts, not subscribers. Dividends aren’t paid out of subscribers but cash flow.
The average revenue per user growth of 11.6% to $437 by 2025 is the key to CMCSA’s ability to grow at the rate analysts expect.
There is no guarantee that CMCSA can achieve this ARPU growth.
- buybacks are a strong growth booster but will face a headwind from falling subscribers over time
How do we quantify, monitor, and track such a complex risk profile? By doing what big institutions do.
Long-Term Risk Analysis: How Large Institutions Measure Total Risk
- see the risk section of this video to get an in-depth view (and link to two reports) of how DK and big institutions measure long-term risk management by companies
CMCSA Long-Term Risk-Management Consensus
| Rating Agency | Industry Percentile |
Rating Agency Classification |
| MSCI 37 Metric Model | 68.0% |
BBB Average, Positive Trend |
| Morningstar/Sustainalytics 20 Metric Model | 99.0% |
24.8/100 Medium Risk |
| Reuters’/Refinitiv 500+ Metric Model | 89.8% | Good |
| S&P 1,000+ Metric Model | 40.0% |
Below-Average, Stable Trend |
| Just Capital 19 Metric Model | 40.0% |
Below-Average, Stable Trend |
| FactSet | 30.0% |
Below-Average, Stable Trend |
| Morningstar Global Percentile (All 15,000 Rated Companies) | 57.4% | Very Good |
| Just Capital Global Percentile (All 954 Rated US Companies) | 57.4% | Average |
| Consensus | 60.2% |
Low Risk, Above-Average Risk-Management, Stable Trend |
(Sources: MSCI, Morningstar, FactSet, S&P, Just Capital, Reuters)
CMCSA’s Long-Term Risk Management Is The 293rd Best In The Master List (41st Percentile)
| Classification | Average Consensus LT Risk-Management Industry Percentile |
Risk-Management Rating |
| S&P Global (SPGI) #1 Risk Management In The Master List | 94 | Exceptional |
| Strong ESG Stocks | 78 |
Good – Bordering On Very Good |
| Foreign Dividend Stocks | 75 | Good |
| Ultra SWANs | 71 | Good |
| Low Volatility Stocks | 68 | Above-Average |
| Dividend Aristocrats | 67 | Above-Average |
| Dividend Kings | 63 | Above-Average |
| Master List average | 62 | Above-Average |
| Hyper-Growth stocks | 61 | Above-Average |
| Monthly Dividend Stocks | 60 | Above-Average |
| Comcast | 60 | Above-Average |
| Dividend Champions | 57 | Average |
(Source: DK Research Terminal)
CMCSA’s risk-management consensus is in the bottom 41% of the world’s highest quality companies and similar to that of such other blue-chips as
- Church & Dwight (CHD): Ultra SWAN dividend aristocrat
- Polaris (PII): Ultra SWAN dividend champion
- Altria (MO): Ultra SWAN dividend king
- Sherwin-Williams (SHW): Ultra SWAN dividend aristocrat
- Costco (COST): Ultra SWAN
The bottom line is that all companies have risks, and Comcast is above-average at managing theirs.
How We Monitor CMCSA’s Risk Profile
- 38 analysts
- 3 credit rating agencies
- 8 total risk rating agencies
- 46 experts who collectively know this business better than anyone other than management
- and the bond market for real-time fundamental risk updates
When the facts change, I change my mind. What do you do, sir?” – John Maynard Keynes
There are no sacred cows at iREIT or Dividend Kings. Wherever the fundamentals lead, we always follow. That’s the essence of disciplined financial science, the math behind retiring rich and staying rich in retirement.
Bottom Line: It’s The Best Time In 18 Years To Buy Comcast
Let me be clear; Super SWAN status doesn’t mean a stock can’t fall in a bear market.
- Safety and quality have zero to do with short-term price volatility
Fundamentals are all that determine safety and quality, and my recommendations.
- over 30+ years, 97% of stock returns are a function of pure fundamentals, not luck
- in the short-term, luck is more powerful than fundamentals
- in the long-term, fundamentals are as powerful as luck
While I can’t predict the market in the short-term, here’s what I can tell you about CMCSA:
- CMCSA is one of the world’s safest, most dependable, and highest quality monthly paying blue-chips on earth
- top 29% of the world’s best companies
- 2.8% very safe yield, growing 8% per year
- 15.3% CAGR long-term total return potential, better than the, aristocrats or S&P 500 and matching that of the Nasdaq.
- 40% historically undervalued, a potentially Ultra Value Buy
- 7.1X cash-adjusted earnings = anti-bubble blue-chip = 0.57 PEG
- almost 250% consensus return potential over the next five years, 26% CAGR, 5X more than the S&P 500
- 3X better risk-adjusted expected returns of the S&P 500 over the next five years.
- 2X more consensus income than the S&P 500 over the next five years
If we get a recession and stocks fall a lot further, Comcast might also fall a lot lower.
In the Great Recession, it bottomed at a trailing P/E of 6.17, approximately half what it is now. But remember that not every recession is a financial crisis, and if you insist on only buying the very bottom of every stock, you’ll never buy any blue-chip.
Don’t try to buy at the bottom and sell at the top. This can’t be done – except by liars.” – Barnard Baruch
Today Comcast has a lower PEG than Amazon (AMZN)! This is a blue-chip that’s delivered 17% annual returns since 1972.
(Source: investor presentation)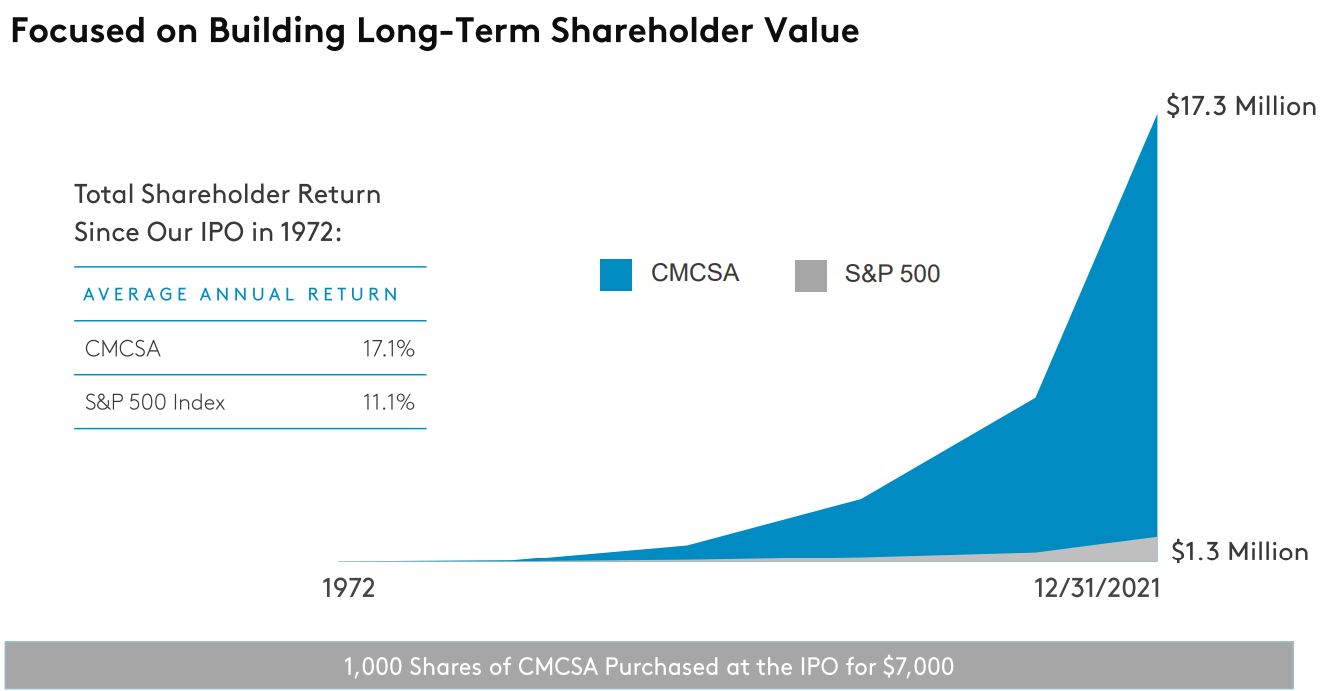
Comcast is one of the greatest growth stories in history and one that’s been flying under the radar the entire time.
This telecom and entertainment giant has a proven track record of adapting and overcoming any and all challenges from rivals and the economy.
No one in history has ever bought Comcast at 7.1X cash-adjusted earnings and lived to regret it, as long as they avoided becoming a forced seller for emotional or financial reasons.
I can’t tell you what the market will do in the next year or even exactly how fast Comcast will grow. But I can say with 80% statistical certainty that anyone buying this fast-growing dividend growth blue-chip at the best valuation in 18 years is likely to be very happy in 5+ years.
That’s because Comcast is a classic example of how even after the market has taken off from its lows, you can still earn Buffett-like returns from blue-chip bargains hiding in plain sight.
Be the first to comment