

imagedepotpro/E+ via Getty Images
The stock market is down 10% in the last month, and tech stocks are down 13%.
Ycharts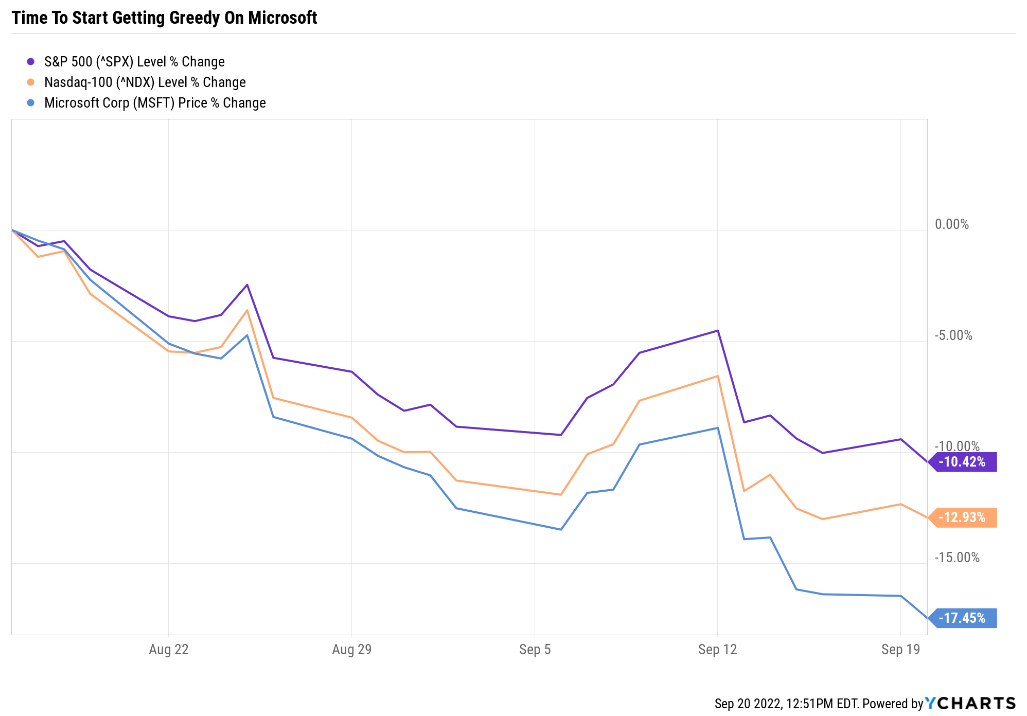
The market generals, including Microsoft (NASDAQ:MSFT) are no longer buffering the declines; they are leading the collapse.
In turbulent times like these, it may seem crazy to be recommending anyone buy anything. The only sane choice seems to be “go to cash and wait for the dust to settle”.
But let me show you the five reasons why now might be exactly the right time to add some Microsoft to your portfolio, when investor terror is so high.
Reason One: Fortunes Are Made In Bear Markets
Fortunes are made in bear markets. – Todd Sullivan (famous value investor)
Be greedy when others are fearful. – Warren Buffett
It seems obvious that stocks can only fall from here, right? Just look at the Wall of Worry we’re facing.
- persistently high inflation
- rising core inflation
- the Fed on the warpath
- elevated recession risk
- geo-political uncertainty (Russia and China)
Daily Shot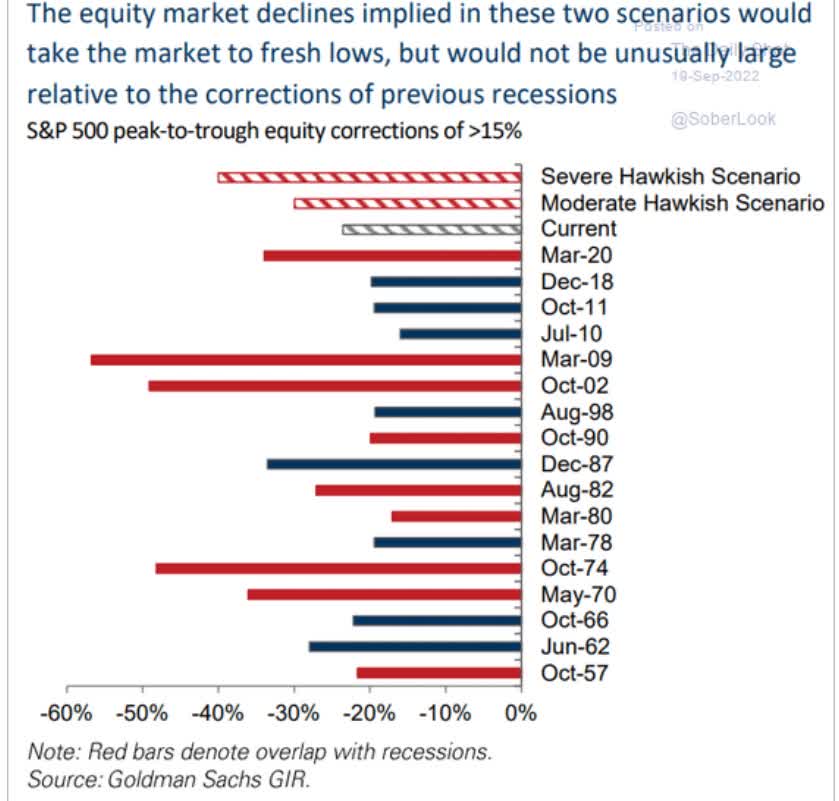
Goldman Sachs thinks stocks will fall another 20% to 25% depending on when the Fed finally stops hiking rates.
Morgan Stanley thinks the best case scenario, where we avoid recession, ends with the stock market down “only” 12% more, to 3,400 on the S&P.
New York Federal Reserve, Bloomberg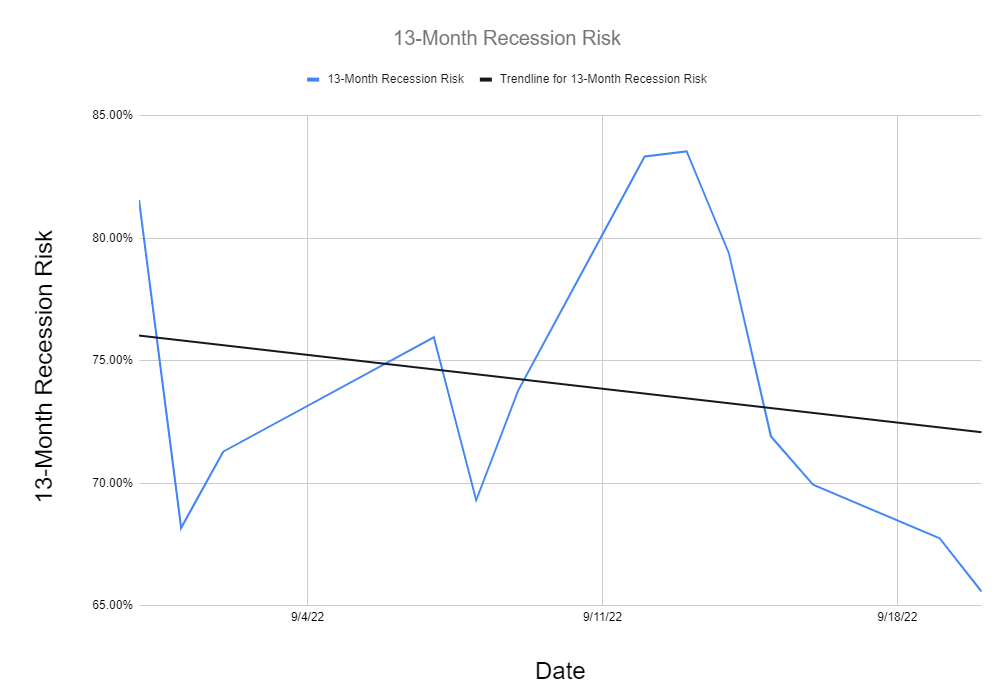
While the odds of a recession remain elevated at 65% according to the bond market, they are trending in the right direction.
And even if we get a recessionary bear market collapse, as the blue-chip consensus expects, tech giants like Microsoft might surprise you.
Why? Because of the inflationary regime that we’re about to enter.
Bloomberg
For the last nine months, we’ve been in a high and rising inflationary regime, the worst historical period for stocks.
But now inflation is high and falling, though gradually. If the economy slows down enough, inflation will come down at an accelerating pace.
Guess what economists expect?
Bloomberg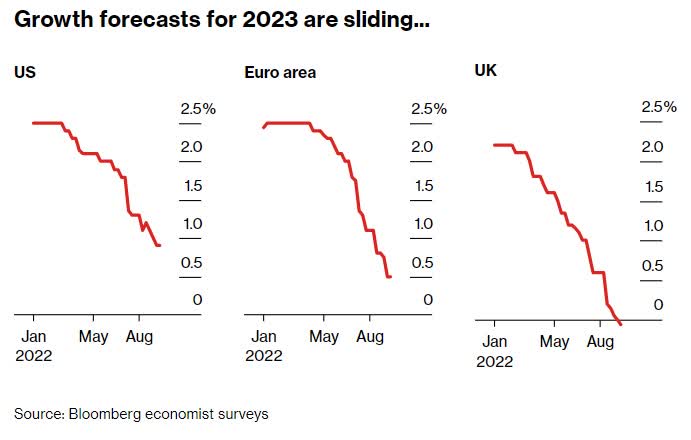
No recession yet, except for the UK, but definitely slower growth. So what does that mean for inflation?
Daily Shot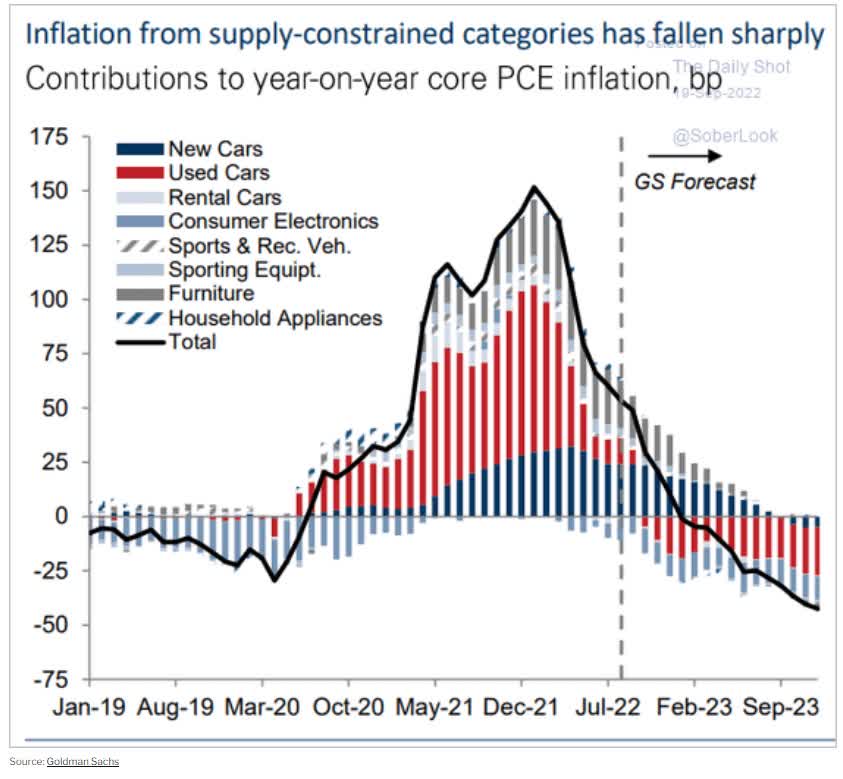
That inflation is likely to come down, ending the Fed’s relentless hiking cycle.
Does that mean the pivot so many growth investors have been praying for is upon us?
CME Group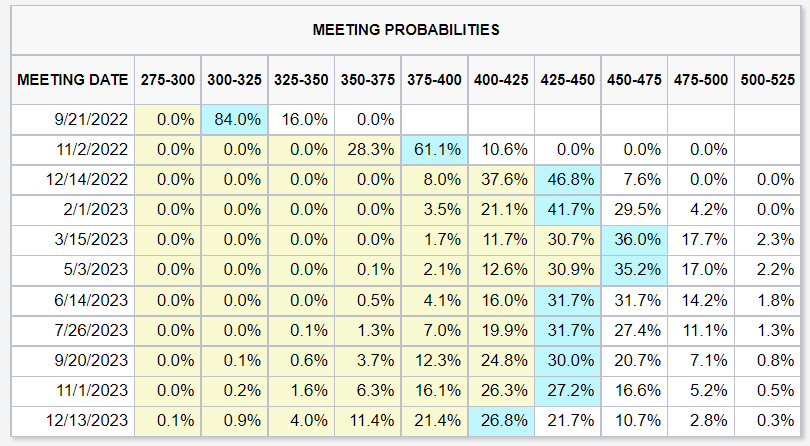
Not even close. The bond market is now pricing in not just a 75-point hike in September (which we just got) but also a 75-point hike in November and then a 50-point hike in December. And then one final hike in March to put us at 4.5% where the Fed is likely to pause and wait to see what happens.
So how is this bullish for Microsoft? Because the market is well on its way to pricing in higher for longer interest rates. If you don’t believe me ask yourself one simple question.
If 10-year yields are at new cycle highs, why aren’t stocks at new lows? Why are we still 6% above the June lows?
Remember the Pandemic crash? We had 30,000 peak daily cases when the market bottomed at -34%. In January 2022 we hit 1.4 million cases in a single day. Was the market crashing at the time? No, it was at all time highs.
The market priced in the Pandemic long before pandemic suck peaked.
That’s also true of recessions, where the market historically bottoms halfway through the actual downturn.
With the odds of a recession now 35% and falling, isn’t it reasonable and prudent to buy at least some blue-chip bargains?
And let’s not forget that it’s a market of stocks, not a stock market.
- Altria (MO) bottomed in December 2008, four months before the market
- MO was up 9% by the time the market stopped falling on March 9th
- Amazon (AMZN) bottomed in January 2002, eight months before the S&P did
- AMZN was up almost 60% by the time the S&P started rising
In a recession, what’s the #1 concern? A lack of growth. What has plenty of growth? Secular growth stocks, especially tech utilities like Microsoft.
What’s been the biggest headwind for growth in this bear market? Soaring interest rates. What happens in 92% of recessions? Rates collapse.
How low does the blue-chip consensus think 10-year yields fall to in a potential 2023 recession? 1% to 2%. Where are they now? 3.55%.
In other words, if you love Microsoft’s business and want to buy some in this bear market, assuming that it will keep falling faster than the market right up until the market bottoms, is speculative.
Nobody can predict interest rates, the future direction of the economy or the stock market. Dismiss all such forecasts and concentrate on what’s actually happening to the companies in which you’ve invested. – Peter Lynch
You might be worried that stocks might fall another 20%. And the fundamentals say this is certainly possible. But there the market has already bottomed in June or is months away or even a year from bottoming, is the wrong question.
Don’t ask, “what will stocks do in the next year”; ask, “what will the stocks I want to own do in the next 10 years.”
Charlie Bilello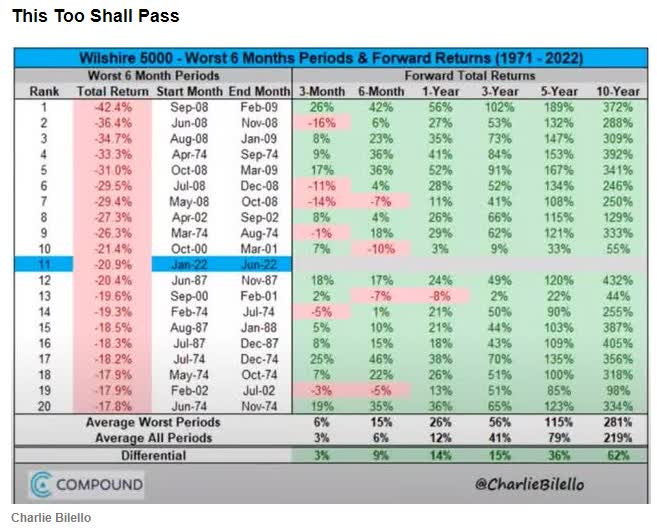
Even in stagflationary hells stocks crash and then deliver sensational returns within a few years. The average 10-year gain from bear markets like this is a nearly 4X return.
And that’s the stock market. Individual companies can deliver 8X to 16X returns the decade following a bear market.
And do you know what Microsoft is? A world-beater blue-chip that’s growing 50% faster than the market and that’s about 5X as undervalued.
Do you know what that sounds like to me? A bear market-blue-chip bargain opportunity you don’t want to miss.
Now let me prove it to you.
Reason Two: Microsoft Is The Complete Dividend Growth Package
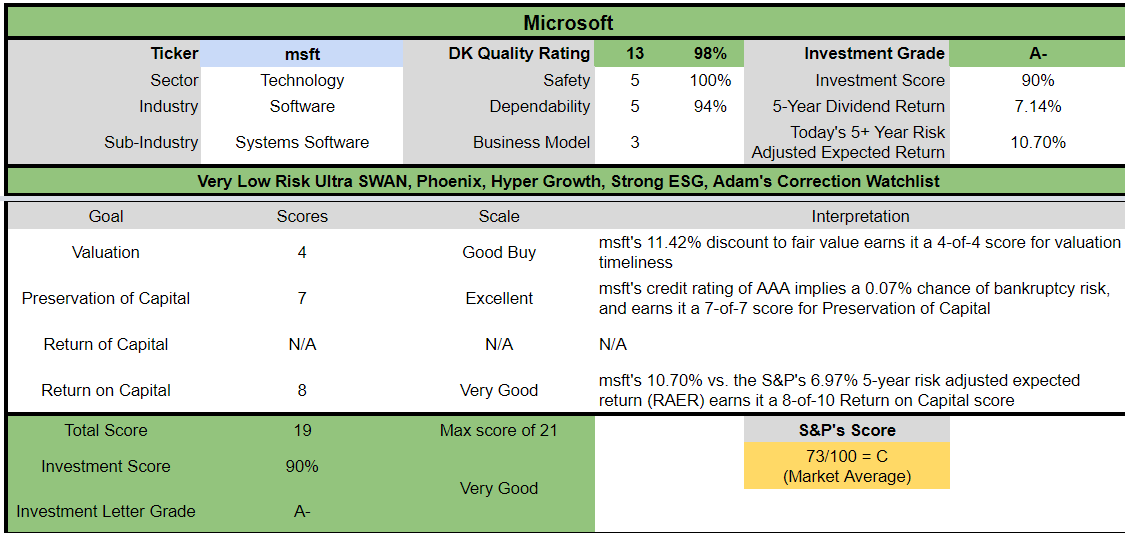
Here is the bottom line on MSFT’s fundamentals.
Reasons To Potentially Buy Microsoft Today
| Metric | Microsoft |
| Quality | 98% 13/13 Ultra SWAN (Sleep Well At Night) |
| Risk Rating | Very Low Risk |
| DK Master List Quality Ranking (Out Of 500 Companies) | 9 |
| Quality Percentile | 98% |
| Dividend Growth Streak (Years) | 18 |
| Dividend Yield | 1.0% |
| Dividend Safety Score | 100% very safe |
| Average Recession Dividend Cut Risk | 0.5% |
| Severe Recession Dividend Cut Risk | 1.00% |
| S&P Credit Rating |
AAA Stable Outlook |
| 30-Year Bankruptcy Risk | 0.07% |
| Consensus LT Risk-Management Industry Percentile | 84% Very Good |
| Fair Value | $276.30 |
| Current Price | $244.74 |
| Discount To Fair Value | 11% |
| DK Rating |
Potentially Good Buy |
| PE | 22.8 |
| Cash-Adjusted PE | 15.9 |
| Historical PE Range | 24 to 27 |
| LT Growth Consensus/Management Guidance | 12.5% |
| 5-year consensus total return potential |
12% to 17% CAGR |
| Base Case 5-year consensus return potential |
14% CAGR (2X better than the S&P 500) |
| Consensus 12-month total return forecast | 36% |
| Fundamentally Justified 12-Month Return Potential | 14% |
| LT Consensus Total Return Potential | 13.5% |
| Inflation-Adjusted Consensus LT Return Potential | 11.3% |
| Consensus 10-Year Inflation-Adjusted Total Return Potential (Ignoring Valuation) | 2.91 |
| LT Risk-Adjusted Expected Return | 9.44% |
| LT Risk-And Inflation-Adjusted Return Potential | 7.22% |
| Conservative Years To Double | 9.97 |
(Source: DK Zen Research Terminal)
MSFT is one of the lowest-risk ways to conservatively double your money in risk and inflation-adjusted terms every decade.
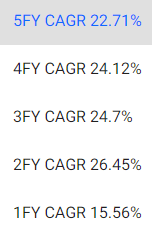
Microsoft 2025 Consensus Total Return Potential
(Source: FAST Graphs, FactSet)
MSFT offers a very solid 17% annual return potential through mid-2025.
Microsoft 2028 Consensus Total Return Potential
(Source: FAST Graphs, FactSet)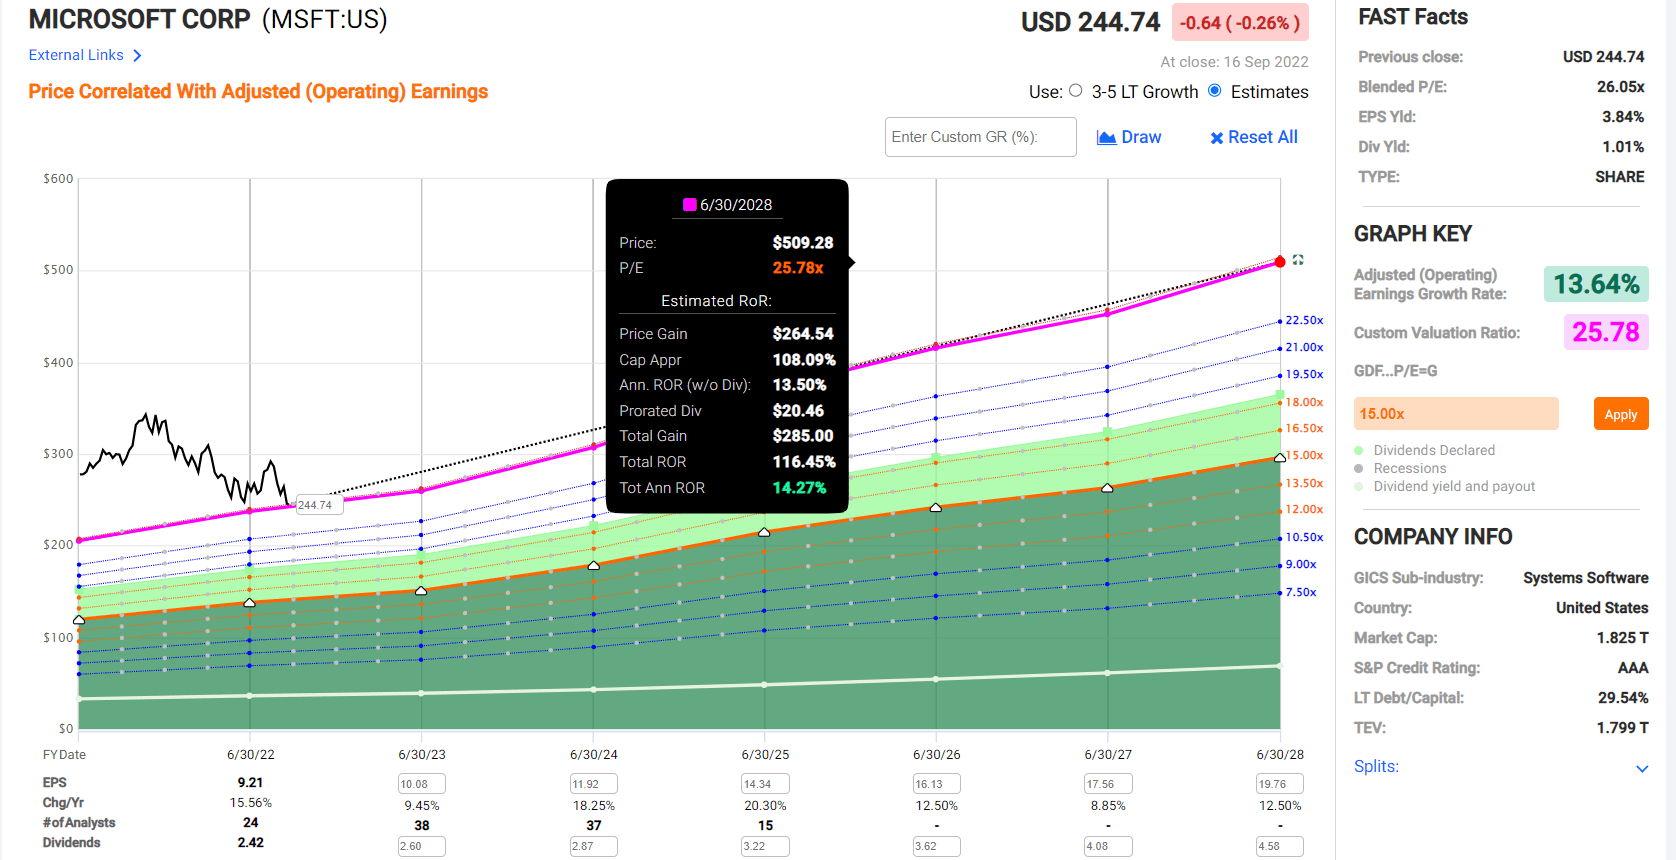
Through 2028 it offers the chance to potentially more than double your money, with 14% CAGR total returns, and with almost no fundamental risk.
Now compare that to the S&P 500.
S&P 500 2024 Consensus Total Return Potential
(Source: FAST Graphs, FactSet)
- over the next 2.5 years, analysts think the S&P will deliver about 12% annual returns
- MSFT could deliver 33% higher annual returns
S&P 500 2027 Consensus Total Return Potential
| Year | Upside Potential By End of That Year | Consensus CAGR Return Potential By End of That Year | Probability-Weighted Return (Annualized) |
Inflation And Risk-Adjusted Expected Returns |
| 2027 | 56.71% | 9.29% | 6.97% | 4.64% |
(Source: DK S&P 500 Valuation & Total Return Tool)
Over the next five years, analysts expect 9% annual returns from the S&P 500, about 2.0X less than they expect from MSFT.
MSFT Investment Decision Score
DK (Source: Dividend Kings Automated Investment Decision Tool)
MSFT is a very reasonable Ultra SWAN fast-dividend growth option for anyone looking for supreme quality and comfortable with its risk profile.
- 11% discount vs. 3% market discount = 8% better valuation
- 35% better long-term annual return potential
- 50% better risk-adjusted expected return over the next five years
Reason Three: One Of The World’s Highest Quality Companies
There are many ways to measure safety and quality, and I factor in pretty much all of them.
The Dividend Kings’ overall quality scores are based on a 269-point model that includes the following:
-
Dividend safety
-
Balance sheet strength
-
Credit ratings
-
Credit default swap medium-term bankruptcy risk data
-
Short and long-term bankruptcy risk
-
Accounting and corporate fraud risk
-
Profitability and business model
-
Growth consensus estimates
-
Management growth guidance
-
Historical earnings growth rates
-
Historical cash flow growth rates
-
Historical dividend growth rates
-
Historical sales growth rates
-
Cost of capital
-
GF Scores
-
Morningstar business model uncertainty score
-
Long-term risk-management scores from Moody’s, MSCI, Morningstar, FactSet, S&P, Reuters’/Refinitiv, and Just Capital
-
Management quality
-
Dividend-friendly corporate culture/income dependability
-
Long-term total returns (a Ben Graham sign of quality)
-
Analyst consensus long-term return potential
It includes over 1,000 fundamental metrics, including the 12 rating agencies we use to assess fundamental risk.
-
credit and risk management ratings make up 41% of the DK safety, and quality model
-
dividend/balance sheet/risk ratings make up 82% of the DK safety and quality model
How do we know that our safety and quality model works well?
During the two worst recessions in 75 years, our safety model 87% of blue-chip dividend cuts, the ultimate baptism by fire for any dividend safety model.
How does MSFT score on our comprehensive safety and quality models?
Microsoft Dividend Safety
| Rating | Dividend Kings Safety Score (202 Point Safety Model) | Approximate Dividend Cut Risk (Average Recession) | Approximate Dividend Cut Risk In Pandemic Level Recession |
| 1 – unsafe | 0% to 20% | over 4% | 16+% |
| 2- below average | 21% to 40% | over 2% | 8% to 16% |
| 3 – average | 41% to 60% | 2% | 4% to 8% |
| 4 – safe | 61% to 80% | 1% | 2% to 4% |
| 5- very safe | 81% to 100% | 0.5% | 1% to 2% |
| MSFT | 100% | 0.5% | 2.00% |
| Risk Rating | Very Low Risk (84th industry percentile risk-management consensus) | AAA Stable Outlook rating = 0.07% 30-year bankruptcy risk | 20% OR LESS Max Risk Cap Recommendation |
Long-Term Dependability
| Company | DK Long-Term Dependability Score | Interpretation | Points |
| Non-Dependable Companies | 20% or below | Poor Dependability | 1 |
| Low Dependability Companies | 21% to 59% | Below-Average Dependability | 2 |
| S&P 500/Industry Average | 60% (60% to 69% range) | Average Dependability | 3 |
| Above-Average | 70% to 79% | Very Dependable | 4 |
| Very Good | 80% or higher | Exceptional Dependability | 5 |
| MSFT | 94% | Exceptional Dependability | 5 |
Overall Quality
| MSFT | Final Score | Rating |
| Safety | 100% | 5/5 very safe |
| Business Model | 100% | 3/3 wide and stable moat |
| Dependability | 94% | 5/5 exceptional |
| Total | 98% | 13/13 Ultra SWAN |
| Risk Rating |
5/5 Very Low Risk |
|
| 20% OR LESS Max Risk Cap Rec |
5% Margin of Safety For A Potentially Good Buy |
MSFT is the 9th highest quality company on the DK 500 Masterlist.
How significant is this? The DK 500 Master List is one of the world’s best watchlists, including
- every dividend aristocrat (S&P companies with 25+ year dividend growth streaks)
- every dividend champion (every company, including foreign, with 25+ year dividend growth streaks)
- every dividend king (every company with 50+ year dividend growth streaks)
- every foreign aristocrat (every company with 20+ year dividend growth streaks)
- every Ultra SWAN (wide moat aristocrats, as close to perfect quality companies as exist)
- 40 of the world’s best growth stocks
In other words, even among the world’s best companies, MSFT is higher quality than 98% of them, similar in quality to such aristocrats and Ultra SWANs as:
- Lowe’s (LOW): Ultra SWAN dividend king
- Colgate-Palmolive (CL): Ultra SWAN dividend king
- Mastercard (MA): Ultra SWAN
- ASML (ASML): Ultra SWAN
- Adobe (ADBE): Ultra SWAN
MSFT Credit Ratings
| Rating Agency | Credit Rating | 30-Year Default/Bankruptcy Risk | Chance of Losing 100% Of Your Investment 1 In |
| S&P | AAA Stable Outlook | 0.07% | 1428.6 |
| Fitch | AAA Stable Outlook | 0.07% | 1428.6 |
| Moody’s | AAA Stable Outlook | 0.07% | 1428.6 |
| Consensus | AAA Stable Outlook | 0.07% | 1428.6 |
(Source: S&P, Fitch, Moody’s)
All three major rating agencies estimate a 0.07% fundamental risk of MSFT going bankrupt in the next 30 years.
- the lowest fundamental risk in corporate America
- 1 in 1,429 chance of going to zero
- as close to a risk-free single company investment as exists on Wall Street
- S&P rates MSFT a lower credit risk than the US treasury
MSFT Leverage Consensus Forecast
| Year | Debt/EBITDA | Net Debt/EBITDA (3 Or Less Safe According To Credit Rating Agencies) |
Interest Coverage (8+ Safe) |
| 2021 | 0.71 | -0.88 | NA |
| 2022 | 0.51 | -0.56 | NA |
| 2023 | 0.45 | -0.67 | 143.73 |
| 2024 | 0.38 | -0.84 | 177.34 |
| 2025 | 0.34 | -1.20 | 147.16 |
| 2026 | NA | -0.78 | NA |
| 2027 | NA | -0.48 | NA |
| Annualized Change | -17.06% | -2.44% | 1.18% |
(Source: FactSet Research Terminal)
MSFT’s fortress balance sheet is expected to remain resilient in the coming years.
MSFT Balance Sheet Consensus Forecast
| Year | Total Debt (Millions) | Cash | Net Debt (Millions) | Interest Cost (Millions) | EBITDA (Millions) | Operating Income (Millions) |
| 2021 | $58,146 | $14,224 | -$72,188 | NA | $81,602 | $69,916 |
| 2022 | $49,781 | $13,931 | -$54,976 | NA | $97,843 | $83,383 |
| 2023 | $49,436 | $64,547 | -$73,346 | $648 | $109,063 | $93,139 |
| 2024 | $47,848 | $96,641 | -$106,251 | $607 | $126,341 | $107,646 |
| 2025 | $49,926 | $126,366 | -$177,847 | $867 | $148,080 | $127,587 |
| 2026 | NA | $104,734 | -$131,791 | NA | $168,579 | $141,446 |
| 2027 | NA | $115,513 | -$90,831 | NA | $187,499 | $152,511 |
| Annualized Growth | -3.74% | 41.78% | 12.79% | 15.67% | 15.62% | 15.13% |
(Source: FactSet Research Terminal)
MSFT’s cash position is growing rapidly as are its cash flows.
Credit Default Swaps: The Bond Market’s Real-Time Fundamental Risk Assessment
(Source: FactSet Research Terminal)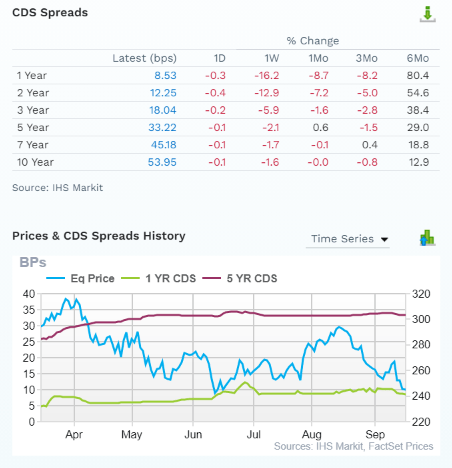
Credit default swaps are bond insurance policies taken out against default.
- they provide a real-time fundamental risk assessment from the “smart money” on Wall Street
For AAA-rated companies, they don’t actually estimate fundamental risk since that is approximately 0.07% over 30 years.
- they represent long-shot bets some bond investors are making about MSFT’s risk profile
- basically speculation about the short-term risk outlook on the company
MSFT’s fundamental risk might have increased a bit in the last few months, but it remains very low on an absolute basis, and you can see that it’s far more stable than the stock price.
- bond investors don’t care about stock price volatility
- , and neither should long-term investors
Why I Don’t Fear Recessions And Neither Should Microsoft Investors
Microsoft was founded in 1975 in Redmond, Washington, and has become potentially the best tech utility on earth.
We believe that Azure is the centerpiece of the new Microsoft. Even though we estimate it is already an approximately $45 billion business, it grew at a staggering 45% rate in fiscal 2022. Azure has several distinct advantages, including that it offers customers a painless way to experiment and move select workloads to the cloud creating seamless hybrid cloud environments. Since existing customers remain in the same Microsoft environment, applications and data are easily moved from on-premises to the cloud. Microsoft can also leverage its massive installed base of all Microsoft solutions as a touch point for an Azure move. Azure also is an excellent launching point for secular trends in AI, business intelligence, and the Internet of Things, as it continues to launch new services centered around these broad themes. – Morningstar
Microsoft is a cloud-based tech utility and arguably the most recession-resistant tech company in the world.
Daily Shot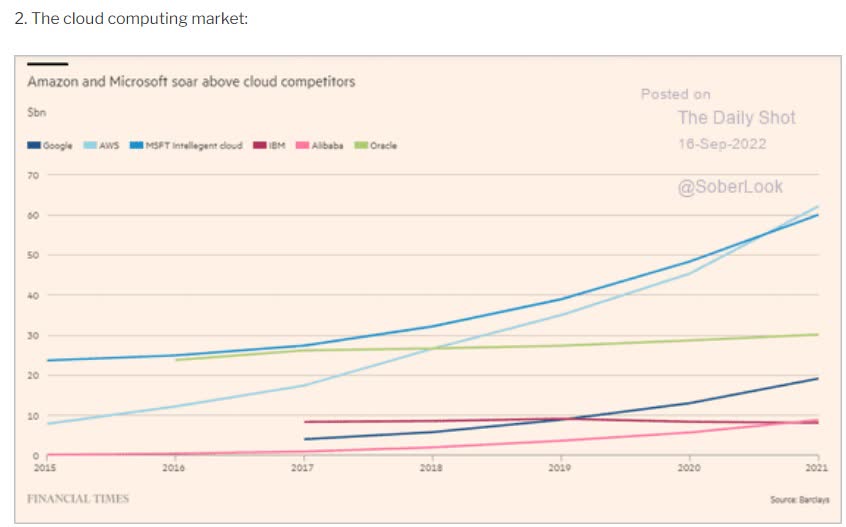
Microsoft and Amazon are the top two cloud computing giants in the world, and other than Alphabet (GOOG), no one appears ready to challenge them in the foreseeable future.
(Source: FactSet Research Terminal)
Analysts expect Azure to grow at 35% annually even through the likely 2023 recession.
- cloud improves productivity and margins
- and thus is a mission-critical bit of spending for companies
- even in recession
IOT Analytics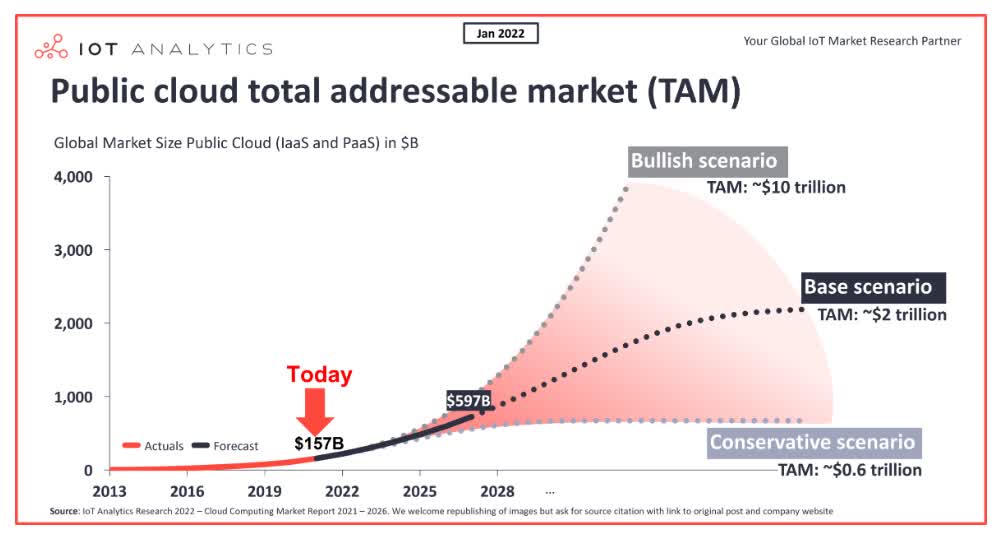
Some analysts believe that cloud computing could grow into a multi-trillion global market within a few years giving Microsoft a long growth runway to keep driving incredible growth in its top and bottom lines.
Microsoft Growth Spending Consensus Forecast
| Year | SG&A (Selling, General, Administrative) | R&D | Capex | Total Growth Spending | Sales | Growth Spending/Sales |
| 2021 | $25,224 | $20,716 | $20,622 | $66,562 | $168,088 | 39.60% |
| 2022 (last year) | $27,725 | $24,512 | $23,886 | $76,123 | $198,270 | 38.39% |
| 2023 (this year) | $31,631 | $26,913 | $27,181 | $85,725 | $220,527 | 38.87% |
| 2024 | $35,441 | $29,851 | $31,222 | $96,514 | $251,334 | 38.40% |
| 2025 | $39,519 | $34,103 | $35,222 | $108,844 | $288,510 | 37.73% |
| 2026 | $45,116 | $38,993 | $42,932 | $127,041 | $330,541 | 38.43% |
| 2027 | $50,238 | $43,421 | $49,521 | $143,180 | $358,849 | 39.90% |
| Annualized Growth | 12.17% | 13.13% | 15.72% | 13.62% | 13.47% | 0.13% |
| Total Spending 2023-2027 | $201,945 | $173,281 | $186,078 | $561,304 | $1,449,761 | NA |
(Source: FactSet Research Terminal)
That’s why MSFT, despite its incredible success so far, continues to invest in growth at a truly staggering scale.
- last year it spent $76 billion on growth
- this year $86 billion
- by 2027 an estimated $143 billion
Over the next five years, analysts expect MSFT to spend $561 billion on growth.
- including $173 billion on R&D
For context, the US government is spending just over $100 billion per year for the next decade on infrastructure.
In the next five years, MSFT is expected to outspend the US government on growth.
- MSFT is achieving 31% cash returns on invested capital
One Of The Most Profitable Companies On Earth
(Source: Gurufocus Premium)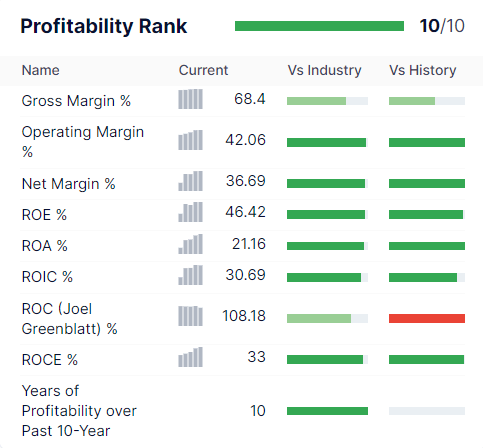
MSFT has historically had profitability in the top 5% of peers, and that was even back in the Ballmer years before Satya Nadella transformed it into a cloud-based higher-margin cash flow minting machine.
Ycharts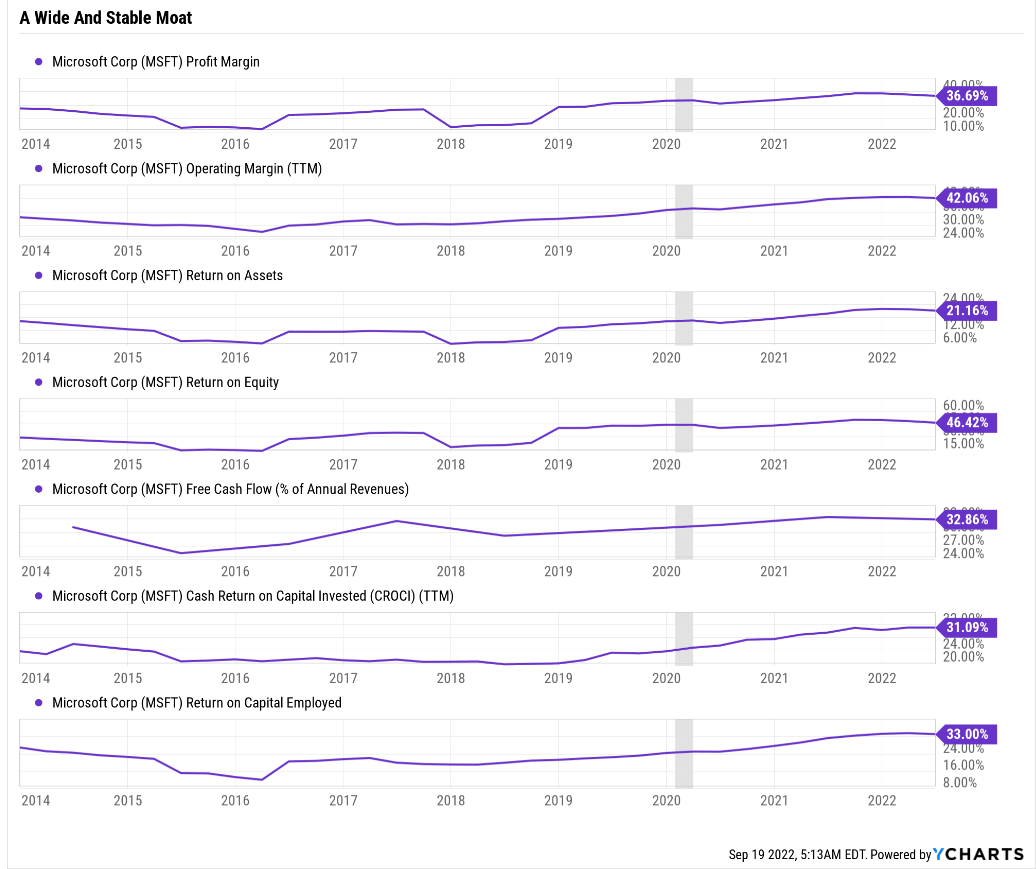
Since taking over for Ballmer, Nadella has taken a highly profitable slow-growing company and transformed it into a fast-growing, even more profitable company.
- including 33% free cash flow margins
- top 10% of all companies on earth
Microsoft Profit Margin Consensus Forecast
| Year | FCF Margin | EBITDA Margin | EBIT (Operating) Margin | Net Margin | Return On Capital Expansion |
Return On Capital Forecast |
| 2021 | 33.4% | 48.5% | 41.6% | 36.1% | 1.01 | |
| 2022 | 32.9% | 49.3% | 42.1% | 35.0% | TTM ROC | 108.18% |
| 2023 | 32.4% | 49.5% | 42.2% | 34.3% | Latest ROC | 98.30% |
| 2024 | 34.1% | 50.3% | 42.8% | 35.2% | 2027 ROC | 109.32% |
| 2025 | 35.8% | 51.3% | 44.2% | 36.4% | 2027 ROC | 99.34% |
| 2026 | 33.2% | 51.0% | 42.8% | 36.5% | Average | 104.33% |
| 2027 | 31.3% | 52.3% | 42.5% | 35.3% | Industry Median | 10.40% |
| 2028 | NA | NA | NA | NA | MSFT/Industry Median | 10.03 |
| Annualized Growth 2021-2027 | -1.08% | 1.23% | 0.36% | -0.35% | Vs. S&P | 7.15 |
(Source: FactSet Research Terminal)
Despite competing with two of the biggest tech giants on earth, MSFT is expected to maintain its industry-leading margins.
- including 35% net margins
Returns on capital, Joel Greenblatt’s gold standard proxy for quality and moatiness, is expected to remain stable at around 100%.
- return on capital: annual pre-tax profit/the cost of running the business
MSFT’s ROC is around 10X that of its industry peers and 7X more than the S&P 500.
- according to one of the greatest investors in history, MSFT is 10X higher quality than its peers and 7X higher quality than the average S&P 500 company
Why are analysts so confident that MSFT can maintain its wide moat in the face of such incredible competition from AMZN and GOOG, not to mention other software a service giants like Salesforce (CRM)?
That would be the wide moat nature of its ecosystem. MSFT bundles together productivity-enhancing tools that companies need and provide advanced data analytics to understand a company’s sales and earnings and how to boost productivity and profitability.
Machine-learning algorithms drive these analytics. The more data these algos have the faster they can improve themselves.
In other words, in cloud computing, winners keep on winning precisely because they already have a wide lead.
MSFT is also a leader in advertising, helping consumer-facing companies like Netflix create efficient ad-based subscription tiers.
- the top 3 cloud giants on earth are all involved in machine learning and advertising
- AMZN, GOOG, and MSFT
They are tech conglomerates leveraging the power of their wide moat data advantage to full effect.
Reason Four: Exceptional Growth Prospects As Far As The Eye Can See
Growth concerns are top of mind for many investors, but fortunately, MSFT’s recession-resistant business model is holding up well in this likely global recession.
| Metric | 2022 Growth (Last Year) | 2023 Growth Consensus (this year) | 2024 Growth Consensus (next year) | 2025 Growth Consensus | 2026 Growth Consensus |
2027 Growth Consensus |
| Sales | 12% | 14% | 14% | 15% | 15% | 9% |
| Dividend | 11% (Official) | 7% | 12% | 2% | 38% | 14% |
| EPS | 16% | 9% | 18% | 20% | 16% | 6% |
| Operating Cash Flow | 17% | 13% | 16% | 21% | NA | NA |
| Free Cash Flow | 17% | 12% | 17% | 22% | NA | NA |
| EBITDA | 22% | 12% | 16% | 18% | NA | NA |
| EBIT (operating income) | 20% | 13% | 16% | 17% | NA | NA |
(Source: FAST Graphs, FactSet Research Terminal)
MSFT is expected to keep growing at double-digits through the recession and deliver hyper-growth in its bottom line.
| Year | Sales | Free Cash Flow | EBITDA | EBIT (Operating Income) | Net Income |
| 2021 | $168,088 | $56,118 | $81,602 | $69,916 | $60,651 |
| 2022 | $198,270 | $65,149 | $97,843 | $83,383 | $69,447 |
| 2023 | $220,527 | $71,363 | $109,063 | $93,139 | $75,576 |
| 2024 | $251,334 | $85,722 | $126,341 | $107,646 | $88,593 |
| 2025 | $288,510 | $103,320 | $148,080 | $127,587 | $104,897 |
| 2026 | $330,541 | $109,825 | $168,579 | $141,446 | $120,688 |
| 2027 | $358,849 | $112,230 | $187,499 | $152,511 | $126,763 |
| Annualized Growth 2021-2027 | 13.47% | 12.25% | 14.87% | 13.88% | 13.07% |
| Cumulative 2023-2027 | $1,449,761 | $482,460 | $739,562 | $622,329 | $516,517 |
(Source: FactSet Research Terminal)
MSFT is growing at about 50% faster than the S&P 500 in its top and bottom line, generating rivers of free cash flow.
MSFT Dividend Growth Consensus Growth Forecast
| Year | Dividend Consensus | FCF/Share Consensus | FCF Payout Ratio | Retained (Post-Dividend) Free Cash Flow | Buyback Potential | Debt Repayment Potential |
| 2022 | $2.42 | $8.64 | 28.0% | $46,426 | 2.54% | 79.8% |
| 2023 | $2.60 | $9.67 | 26.9% | $52,770 | 2.89% | 106.0% |
| 2024 | $2.87 | $11.34 | 25.3% | $63,220 | 3.46% | 127.0% |
| 2025 | $3.22 | $13.88 | 23.2% | $79,566 | 4.36% | 160.9% |
| Total 2022 Through 2025 | $11.11 | $43.53 | 25.5% | $241,982.88 | 13.26% | 486.09% |
| Annualized Rate | 10.0% | 17.1% | -6.1% | 19.7% | 19.7% | 26.3% |
(Source: FactSet Research Terminal)
Rating agencies consider a 60% FCF payout ratio safe for this industry, and MSFT’s is 27% and expected to fall to 23% by 2025.
- despite 10% CAGR dividend growth
- courtesy of 17% CAGR growth in FCF/share
Even after paying out $83 billion in dividends, analysts expect MSFT to retain $242 billion in free cash flow over the coming years, enough to repay its debt by almost 5X or buyback up to 13% of shares at current valuations.
MSFT Buyback Consensus Forecast
| Year | Consensus Buybacks ($ Millions) | % Of Shares (At Current Valuations) | Market Cap |
| 2023 | $32,668 | 1.8% | $1,825,000 |
| 2024 | $35,982 | 2.0% | $1,825,000 |
| 2025 | $33,497 | 1.8% | $1,825,000 |
| 2026 | $41,645 | 2.3% | $1,825,000 |
| 2027 | $44,477 | 2.4% | $1,825,000 |
| Total 2023 through 2027 | $188,269 | 10.3% | $1,825,000 |
| Annualized Rate | 2.2% CAGR | Average Annual Buybacks | $37,654 |
| 1% Buyback Tax | $1,883 | Average Annual Buyback Tax | $377 |
(Source: FactSet Research Terminal)
Analysts expect MSFT to repurchase almost $200 billion worth of shares in the coming five years, averaging almost $40 billion per year.
At current valuations, that’s just over 2% of net shares each year.
Ycharts
Since the Nadella cloud era began, MSFT has averaged 1.3% CAGR net buybacks each year, and in this bear market, that’s expected to nearly double.
MSFT Long-Term Growth Outlook
(Source: FactSet Research)
- 12.5% CAGR to 16% CAGR from four sources
- 12.5% CAGR median consensus from all 47 analysts
How accurate are analysts at forecasting MSFT’s growth?
(Source: FAST Graphs, FactSet Research)
Smoothing for outliers, analyst margins of error on MSFT are 20% to the downside and 20% to the upside.
- 10% to 20% CAGR margin-of-error adjusted growth consensus range
(Source: FAST Graphs, FactSet Research) (Source: FAST Graphs, FactSet Research) (Source: FAST Graphs, FactSet Research) (Source: FAST Graphs, FactSet Research)

Analysts expect MSFT’s future growth to be similar to the last 10 and 19 years, though its cash flows are now subscription-based and thus more recession-resistant.
| Investment Strategy | Yield | LT Consensus Growth | LT Consensus Total Return Potential | Long-Term Risk-Adjusted Expected Return | Long-Term Inflation And Risk-Adjusted Expected Returns | Years To Double Your Inflation & Risk-Adjusted Wealth |
10-Year Inflation And Risk-Adjusted Expected Return |
| Microsoft | 1.0% | 12.5% | 13.5% | 9.5% | 7.2% | 10.1 | 2.00 |
| High-Yield (SCHD) | 3.4% | 8.7% | 12.1% | 8.5% | 6.2% | 11.7 | 1.82 |
| Dividend Aristocrats | 2.4% | 8.6% | 11.0% | 7.7% | 5.4% | 13.4 | 1.69 |
| S&P 500 | 1.7% | 8.5% | 10.2% | 7.1% | 4.9% | 14.8 | 1.61 |
| Nasdaq | 0.9% | 11.8% | 12.7% | 8.9% | 6.6% | 10.9 | 1.89 |
(Source: DK Research Terminal, Morningstar, FactSet, YCharts)
Analysts expect about 13.5% long-term annual returns from MSFT, better than the S&P, aristocrats, SCHD, and even the Nasdaq.
Total Returns Since April 1986
(Source: Portfolio Visualizer Premium) (Source: Portfolio Visualizer Premium)
MSFT is expected to slow down its returns compared to its incredible historical run. But 13.5% CAGR long-term return potential is still exceptional for an AAA-rated Ultra-SWAN growing its very safe dividend at double-digits.
Inflation-Adjusted Consensus Total Return Potential: $1,000 Initial Investment
| Time Frame (Years) | 7.9% CAGR Inflation-Adjusted S&P 500 Consensus | 8.7% Inflation-Adjusted Dividend Aristocrats Consensus | 11.2% CAGR Inflation-Adjusted MSFT Consensus | Difference Between Inflation-Adjusted MSFT Consensus And S&P Consensus |
| 5 | $1,461.18 | $1,516.17 | $1,701.06 | $239.88 |
| 10 | $2,135.06 | $2,298.77 | $2,893.60 | $758.54 |
| 15 | $3,119.71 | $3,485.33 | $4,922.18 | $1,802.47 |
| 20 | $4,558.47 | $5,284.36 | $8,372.92 | $3,814.45 |
| 25 | $6,660.75 | $8,012.00 | $14,242.82 | $7,582.07 |
| 30 | $9,732.58 | $12,147.56 | $24,227.87 | $14,495.29 |
(Source: DK Research Terminal, FactSet)
MSFT’s 11.2% CAGR inflation-adjusted consensus return potential means that MSFT offers the chance to triple your money over a decade.
| Time Frame (Years) | Ratio Dividend Aristocrats/S&P Consensus | Ratio Inflation And Inflation-Adjusted MSFT Consensus vs. S&P consensus |
| 5 | 1.04 | 1.16 |
| 10 | 1.08 | 1.36 |
| 15 | 1.12 | 1.58 |
| 20 | 1.16 | 1.84 |
| 25 | 1.20 | 2.14 |
| 30 | 1.25 | 2.49 |
(Source: DK Research Terminal, FactSet)
It means the potential to run circles around the aristocrats and S&P 500 with 0.07% fundamental risk.
Reason Five: A Wonderful Company At An Attractive Price
(Source: FAST Graphs, FactSet) (Source: FAST Graphs, FactSet) (Source: FAST Graphs, FactSet)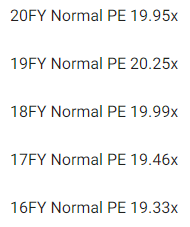
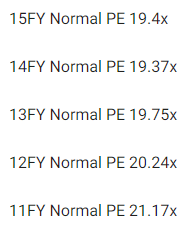
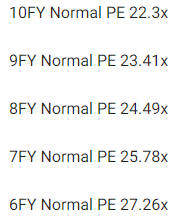
Even when it was being run by a fool (Ballmer) and growing at 9%, MSFT was valued at 19X earnings.
Since Nadella took over and changed the business model to be faster-growing, higher margin, and recurring revenue, it’s been valued at 24X to 27X earnings.
- GOOG and AMZN, MSFT’s two largest cloud computing peers, have also traded at 26X earnings and cash flow, historically
| Metric | Historical Fair Value Multiples (10-Years, Nadella Era, New Business Model) | 2021 | 2022 | 2023 | 2024 | 2025 |
12-Month Forward Fair Value |
| Earnings | 25.78 | $221.71 | $249.81 | $285.13 | $285.13 | $346.48 | |
| Average | $221.71 | $249.81 | $285.13 | $285.13 | $346.48 | $276.30 | |
| Current Price | $244.74 | ||||||
|
Discount To Fair Value |
-10.39% | 2.03% | 14.16% | 14.16% | 29.36% | 11.42% | |
|
Upside To Fair Value (NOT Including Dividends) |
-9.41% | 2.07% | 16.50% | 16.50% | 41.57% | 12.89% (14% including dividend) | |
| 2022 EPS | 2023 EPS | 2022 Weighted EPS | 2023 Weighted EPS | 12-Month Forward EPS | 12-Month Average Fair Value Forward PE |
Current Forward PE |
|
| $9.69 | $11.06 | $2.42 | $8.30 | $10.72 | 25.8 | 22.8 |
I estimate MSFT is worth about 26X earnings historically speaking, and today it trades at a very reasonable 22.8X.
- 15.9X cash-adjusted earnings
|
Analyst Median 12-Month Price Target |
Morningstar Fair Value Estimate |
| $329.19 (30.7 PE) | $352.00 (32.7 PE) |
|
Discount To Price Target (Not A Fair Value Estimate) |
Discount To Fair Value |
| 25.65% | 30.47% |
|
Upside To Price Target (Not Including Dividend) |
Upside To Fair Value (Not Including Dividend) |
| 34.51% | 43.83% |
|
12-Month Median Total Return Price (Including Dividend) |
Fair Value + 12-Month Dividend |
| $331.67 | $354.48 |
|
Discount To Total Price Target (Not A Fair Value Estimate) |
Discount To Fair Value + 12-Month Dividend |
| 26.21% | 30.96% |
|
Upside To Price Target ( Including Dividend) |
Upside To Fair Value + Dividend |
| 35.52% | 44.84% |
Analysts expect MSFT to trade at 31X earnings in 12 months, and Morningstar’s discounted cash flow model estimates it’s worth almost 33X earnings.
- 30% undervalued according to Morningstar
Analysts expect a 36% gain within 12 months, though I estimate that MSFT’s fundamentals justify a 14% 12-month gain.
| Rating | Margin Of Safety For Very Low Risk 13/13 Quality Ultra SWANs | 2022 Fair Value Price | 2023 Fair Value Price |
12-Month Forward Fair Value |
| Potentially Reasonable Buy | 0% | $249.81 | $285.13 | $276.30 |
| Potentially Good Buy | 5% | $237.32 | $270.87 | $262.48 |
| Potentially Strong Buy | 15% | $212.34 | $242.36 | $234.85 |
| Potentially Very Strong Buy | 25% | $177.99 | $213.85 | $207.22 |
| Potentially Ultra-Value Buy | 35% | $162.38 | $185.33 | $179.59 |
| Currently | $244.74 | 2.03% | 14.16% | 11.42% |
| Upside To Fair Value (Not Including Dividends) | 2.07% | 16.50% | 12.89% |
For anyone comfortable with its risk profile, MSFT is a potentially good buy.
Risk Profile: Why Microsoft Isn’t Right For Everyone
There are no risk-free companies, and no company is right for everyone. You have to be comfortable with the fundamental risk profile.
MSFT’s Risk Profile Includes
- Legacy high-margin business is being disrupted (by MSFT itself)
- disruption risk: AMZN and GOOG are the other two titans in cloud computing, but lots of smaller rivals (like CRM)
- M&A execution risk: $85 billion Activision purchase is the biggest in its history by far
- regulatory risk: mostly for future acquisitions as well as data tracking
- talent retention risk in the tightest job market in 50 years (tech is a high-wage sector)
- currency risk: modest headwind this year
How do we quantify, monitor, and track such a complex risk profile? By doing what big institutions do.
Long-Term Risk Management Analysis: How Large Institutions Measure Total Risk Management
See the risk section of this video to get an in-depth view (and link to two reports) of how DK and big institutions measure long-term risk management by companies
MSFT Long-Term Risk-Management Consensus
| Rating Agency | Industry Percentile |
Rating Agency Classification |
| MSCI 37 Metric Model | 100.0% |
AAA, Industry Leader, Stable Trend |
| Morningstar/Sustainalytics 20 Metric Model | 93.5% |
15.2/100 Low Risk |
| Reuters’/Refinitiv 500+ Metric Model | 99.8% | Good |
| S&P 1,000+ Metric Model | 58.0% |
Average, Stable Trend |
| Just Capital 19 Metric Model | 100.0% |
#1 Industry Leader |
| FactSet | 30.0% |
Below Average, PStable Trend |
| Morningstar Global Percentile (All 15,000 Rated Companies) | 90.2% | Exceptional |
| Just Capital Global Percentile (All 954 Rated US Companies) | 99.7% | Exceptional |
| Consensus | 84% |
Very Low Risk, Very Good Management, Stable Trend |
(Sources: Morningstar, MSCI, S&P, Reuters, Just Capital)
MSFT’s Long-Term Risk Management Is The 40th Best In The Master List (92nd Percentile)
| Classification | Average Consensus LT Risk-Management Industry Percentile |
Risk-Management Rating |
| S&P Global (SPGI) #1 Risk Management In The Master List | 94 | Exceptional |
| Microsoft | 84 |
Very Good |
| Strong ESG Stocks | 78 |
Good – Bordering On Very Good |
| Foreign Dividend Stocks | 75 | Good |
| Ultra SWANs | 71 | Good |
| Low Volatility Stocks | 68 | Above-Average |
| Dividend Aristocrats | 67 | Above-Average |
| Dividend Kings | 63 | Above-Average |
| Master List average | 62 | Above-Average |
| Hyper-Growth stocks | 61 | Above-Average |
| Monthly Dividend Stocks | 60 | Above-Average |
| Dividend Champions | 57 | Average bordering on above-average |
(Source: DK Research Terminal)
MSFT’s risk-management consensus is in the top 8% of the world’s highest quality companies and similar to that of such other blue-chips as
- Colgate-Palmolive (CL): Ultra SWAN dividend king
- Lockheed Martin (LMT): Ultra SWAN
- BlackRock (BLK): Ultra SWAN
- Amgen (AMGN): Ultra SWAN
- Bank of Montreal (BMO): Ultra SWAN
- Adobe (ADBE): Ultra SWAN
The bottom line is that all companies have risks, and MSFT is very good at managing theirs.
How We Monitor MSFT’s Risk Profile
- 47 analysts
- 3 credit rating agencies
- 8 total risk rating agencies
- 55 experts who collectively know this business better than anyone other than management
- and the bond market for real-time fundamental risk assessment
When the facts change, I change my mind. What do you do, sir? – John Maynard Keynes
There are no sacred cows at iREIT or Dividend Kings. Wherever the fundamentals lead, we always follow. That’s the essence of disciplined financial science, the math behind retiring rich and staying rich in retirement.
Bottom Line: It’s Time To Start Getting Greedy On Microsoft
Let me be clear: I’m NOT calling the bottom in MSFT (I’m not a market-timer).
Ultra SWAN doesn’t mean “can’t fall hard in a bear market.”
Fundamentals are all that determine safety and quality, and my recommendations.
- over 30+ years, 97% of stock returns are a function of pure fundamentals, not luck
- in the short-term; luck is 33X as powerful as fundamentals
- in the long-term, fundamentals are 33X as powerful as luck
While I can’t predict the market in the short term, here’s what I can tell you about MSFT.
- One of the highest quality, safest, and most dependable dividend blue-chips
- 1.0% very safe yield growing at double-digits.
- 13.5% CAGR long-term total return potential, better than the Nasdaq, aristocrats, S&P 500, and SCHD.
- 11% historically undervalued, a potentially good buy
- 15.9X cash-adjusted earnings
- 116% consensus return potential over the next five years, 14% CAGR, about 2X more than the S&P 500
- 50% better risk-adjusted expected returns of the S&P 500 over the next five years.
If you regret not buying MSFT during the June lows, then Mr. Market is giving you a gift by bringing one of the world’s best dividend growth blue-chips back to similar levels now.
Could it fall a lot further? Sure. Would its fundamentals justify that decline? Very likely not. Will that matter in the short-term? Maybe, maybe not.
Might you regret buying Microsoft today? Maybe for a few months. But will you regret buying it 5 years from now? Probably not. What about 10 years from now? Almost certainly not.
If you aren’t willing to own a stock for ten years, don’t even think about owning it for ten minutes.” – Warren Buffett
In 20 years, when your diversified and prudently risk-managed blue-chip portfolio has helped you retire in safety and splendor, will you remember what the bottom of the 2022 bear market even was?
Ycharts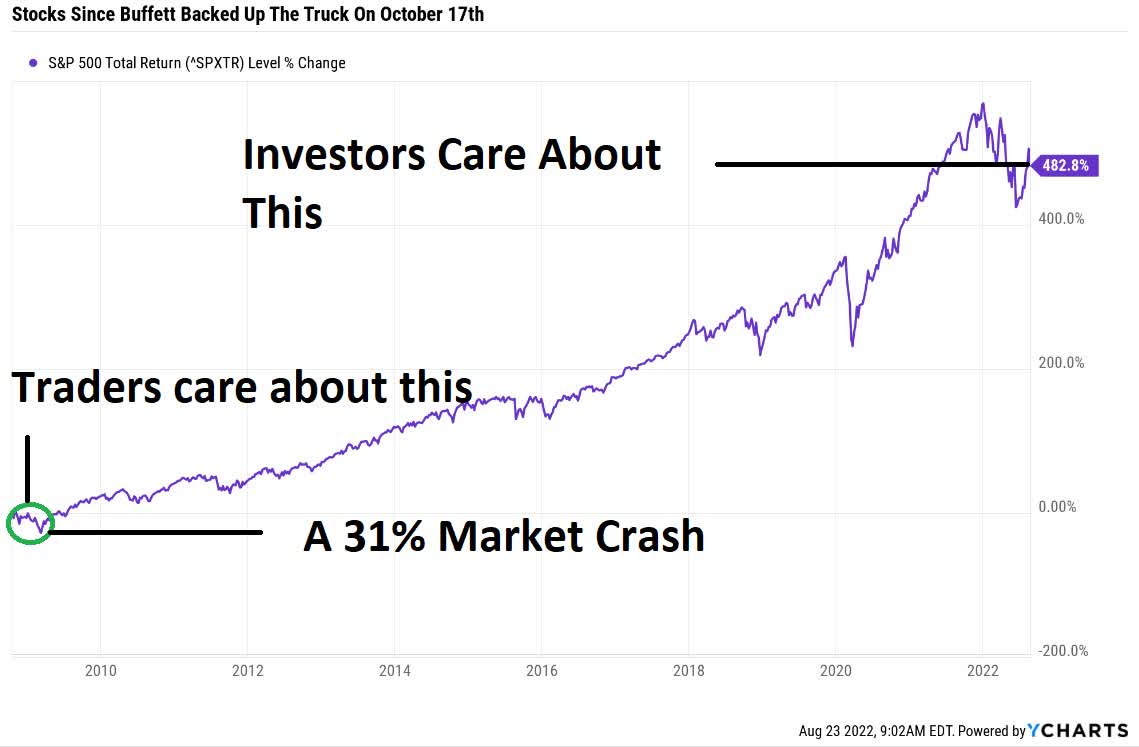
Did Buffett regret buying blue-chips by the billions in mid-October 2008?
Did anyone who followed his advice to “Buy American; I Am”?
Why should you consider buying Microsoft today? Because Wall Street doesn’t run on certainties, only probabilities. And to paraphrase Casablanca:
If the market leaves the ground and you haven’t bought some Microsoft in this bear market, you’ll regret it. Maybe not today. Maybe not tomorrow, but soon and for the rest of your life.
Be the first to comment