


Is it really that difficult? Just buy the share that’s going to go up. Collect income while waiting.
Svetlana Sultanaeva/iStock via Getty Images
Get ready for charts, images, and tables because they are better than words. The ratings and outlooks we highlight here come after Scott Kennedy’s weekly updates in the REIT Forum. Your continued feedback is greatly appreciated, so please leave a comment with suggestions.
We’ve been pretty active over the last several months with our preferred share trades. That activity has turned out pretty well as we’ve been able to slip into undervalued positions in time to catch a healthy rally quite a few times.
I want to talk investors through a few of our trades. We have a sizeable position in MFA-C again. However, we went through a few swaps to get here. When we swap our positions, we usually enter a new position the same day we close the old one. Often the difference in timing is only a few minutes. Our goal is to maintain the sector exposure, but to move between shares to take advantage of the opportunities.
We also opened our first position in GPMT-A.
Today, I want to walk investors through several of those swaps. You’ll notice that in each of the examples for this article, we’re using several of the same swaps. However, they execution price is slightly different because they were occurring in different accounts.
Some of these batches will be much larger than others. That’s okay. You don’t have to have a big account to use this technique. I find it gets harder as individual position sizes push past $50k.
Do Not Suggest PFF
Someone always wants to suggest the iShares Preferred and Income Securities ETF (PFF). For the time period we’re going to demonstrate, it delivered a return of negative 1.4% (including the dividend). If you like that better than our performance, that’s your decision. Personally, I prefer more money to less money.
Since the start of 2016, PFF delivered a total return of about 15.2%. That means it kept pace with inflation so long as the investor reinvested all dividends. If they wanted to spend dividends, the value of their position is down. That’s just not my goal. We’re up 120.1% in the same period.
Upside
Our most recent purchases are MFA-C, GPMT-A, and PMT-C. Upside to reach call value is:
- GPMT-A 37.3%
- MFA-C: 42%
- PMT-C: 48.5%
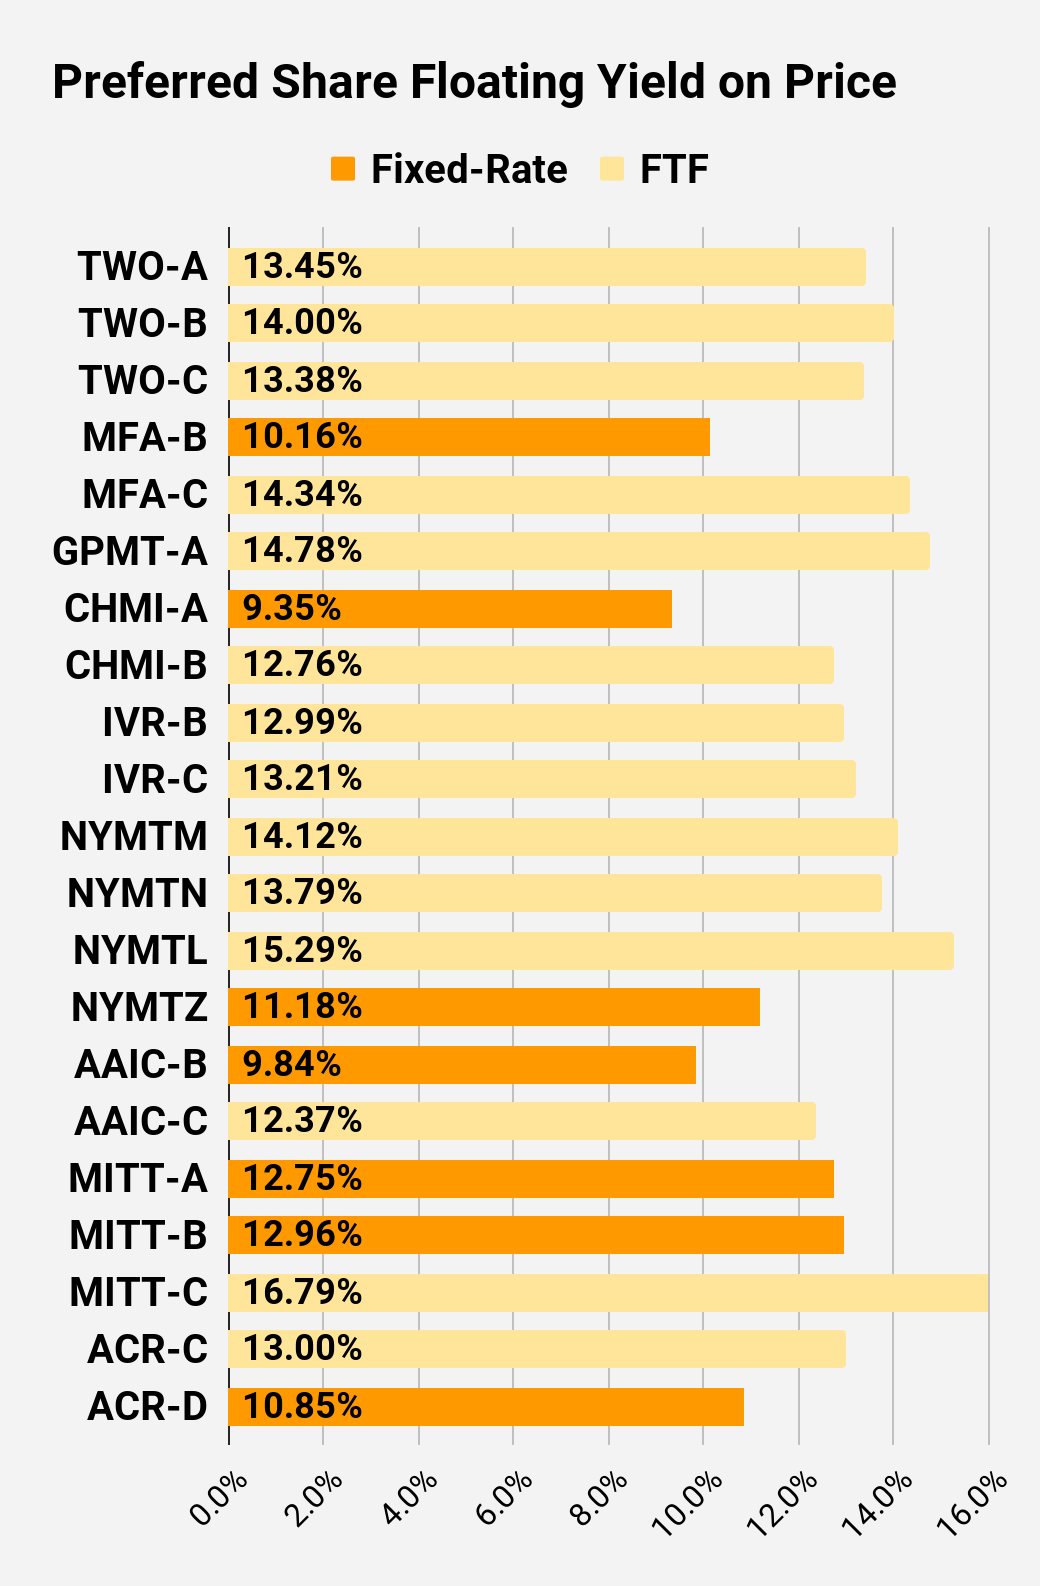
I don’t think PMT-C will get back up to call value unless rates fall quite a bit. However, MFA-C and GPMT are fixed-to-floating shares. Eventually, their rate is adjusted based on short-term rates. If short-term rates remain at their current levels, it would be a 14.34% yield on MFA-C and a 14.78% yield on GPMT-A.
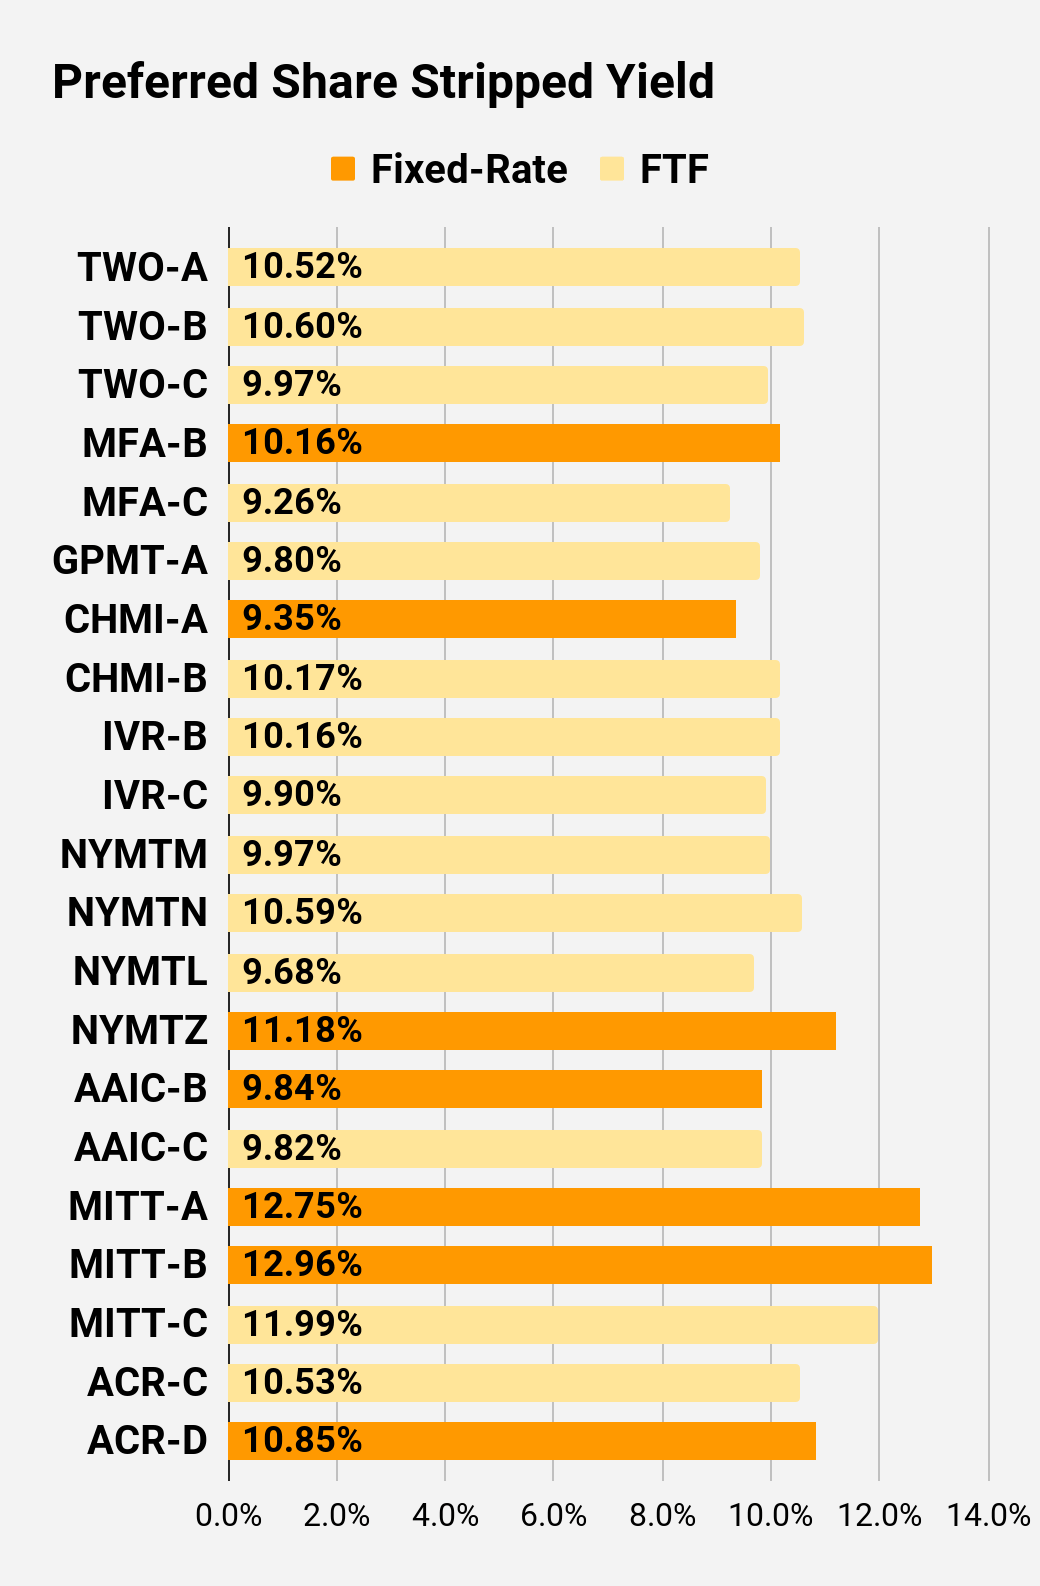
Prior to floating, the yields are still above 9%. For PMT-C, the dividend rate is fixed but the stripped yield is already slightly over 10%.
Clearly, there are strong incentives for investors to want these shares. However, the market has been inefficient in pricing them. Consequently, we’ve been swapping between shares in the sector to achieve stronger returns.
First Example
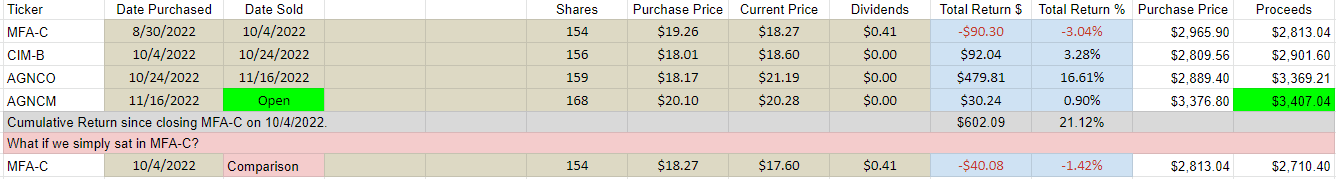
Our first series is going from MFA-C to CIM-B to AGNCO to AGNCM:
The REIT Forum
Let’s review:
We bought MFA-C on 8/30/2022. It was down on 10/4/2022, but we pushed emotion to the side. CIM-B looked better, so we sold MFA-C for proceeds of $2,813.04 and bought CIM-B for a total price of $2809.56.
Later that same month, we swapped CIM-B for AGNCO. Once again, our total purchase cost slightly less than we got from closing the prior position.
Yet in November, we decided we would rather have AGNCM than AGNCO because AGNCM was $20.10 and AGNCO was $21.19. That was a favorable ratio, so we swapped the position again.
At the end of that sequence, our position in AGNCM is worth $3,407.04 and we got there using the $2,813.04 in proceeds from selling MFA-C on 10/04/2022. In total, we ended up with a 21.12% return since 10/04/2022 by using our strategy.
We can compare that to a hypothetical investor who simply sat in MFA-C for that period. Economically, that would be identical to selling the shares for $18.27 and repurchasing them for $18.27. That investor has a return of negative 1.42% for the same period.
In my opinion, positive 21.12% is much better than negative 1.42%. I see it that way because my goal is to grow the portfolio.
Second Example
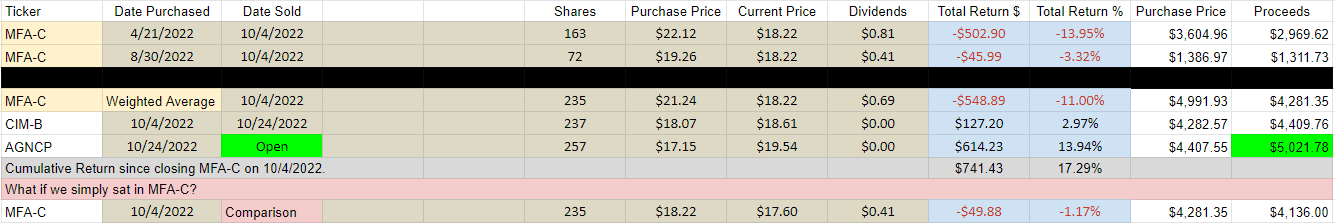
Our second series is going from MFA-C to CIM-B to AGNCP:
The REIT Forum
In this trade we started out with two positions in MFA-C. They were 163 and 72 shares. For your convenience, I’ve prepared the “Weighted Average” line that combines the two for a single position of 235 shares.
This series wasn’t quite as exceptional as the prior one, but it was still very good. In this case, our “Comparison” uses a price of $18.22 for MFA-C since the comparison should mimic repurchasing the shares for the same exact price, we had on closing the position. In this case, we were taking a larger loss on our older position in MFA-C. We don’t love losses but repositioning our portfolio to maximize returns resulted in much better performance.
Third Example
Getting the hang of it? We recently opened a position in GPMT-A. It’s a pretty small position, but our analysis suggested shares were getting quite attractive after severely underperforming peers.
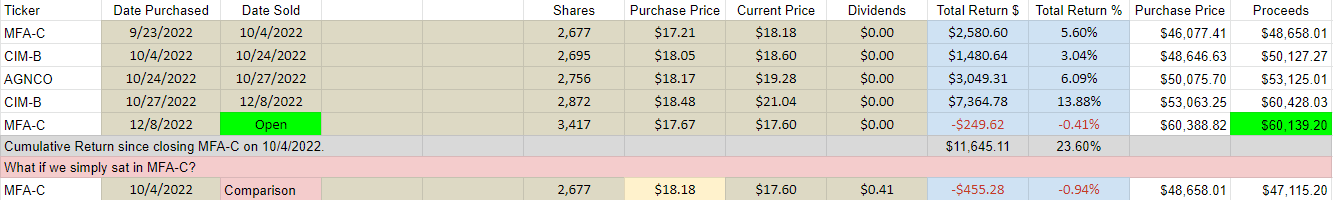
In this series we went from MFA-C to CIM-B to AGNCO back to CIM-B then to GPMT-A:

The REIT Forum
Once again, we combined the two positions at the top to create a weighted average. We ended up with a 24.38% return here while investors who were just sitting in MFA-C ended up with negative .81%. This happened because we were accurate in deciding when to jump back and forth between the positions.
Fourth Example
Now you might think that the point is to highlight some kind of flaw in MFA-C. That’s not the case at all. The following sequence combines the rest of our trades for this series. This series goes from MFA-C to CIM-B to AGNCO, then back to CIM-B, then back to MFA-C.
The REIT Forum
Once again, the returns were excellent. We ended up with 3,417 shares of MFA-C for these positions when we started with only 2,677 shares. That’s obviously a huge improvement.
All in all, before we started this sequence of trades, we had 3,591 shares of MFA-C. Through this series of trades, we turned that into:
- 3,417 shares of MFA-C
- 651 shares of GPMT-A
- 257 shares of AGNCP
- 168 shares of AGNCM
Trade Confirmations
I post all the trade confirmations in the trade alerts. We do that because it’s important for analysts to actually make the trades they suggest. It’s better to judge an analyst of their stock portfolio than off hypothetical trades they place into a spreadsheet. Consequently, our spreadsheets represent our actual positions.
If an analyst doesn’t post trade confirmations, they can claim there was some miscommunication. There is absolutely no misunderstanding with trade confirmations.
To avoid putting in several pages of trade confirmations, here are the latest purchases of MFA-C:
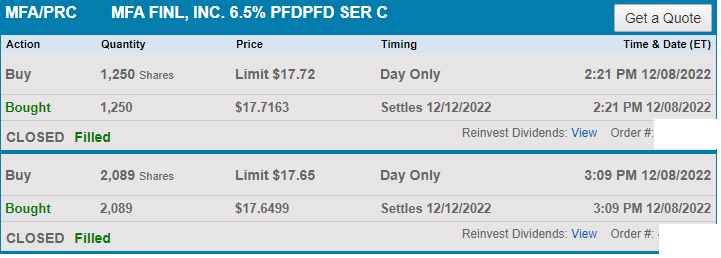
Charles Schwab
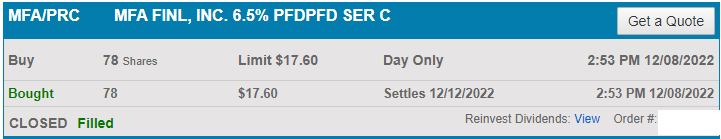
Charles Schwab
Current Position
For anyone who missed it, each of those slides was labeled with the “Open” position. Those are some of our most recent positions.
I’m quite bullish on MFA-C, GPMT-A, AGNCP, and AGNCM. We’re also bullish on AGNCO, which is similar to AGNCM and AGNCP.
However, we also opened a position in PMT-C recently. Shares of PMT-C are down about 1.8% since we opened our position, so that looks pretty nice also. As you can see, the positions we just opened are roughly flat to slightly down. Investors can still get similar prices or better. Clearly, we’re also bullish on PMT-C.
Recent Performance Comparison
In our latest trade alert for members of The REIT Forum, we included several charts to demonstrate the swing in relative valuations that helped lead us into our latest purchases of GPMT-A, MFA-C, and PMT-C. This section will help you understand how we spotted our opportunities.
There are several charts to include here because the technical factors playing into these trades are important.
First chart compares CIM-B to CIM-D and CIM-C:
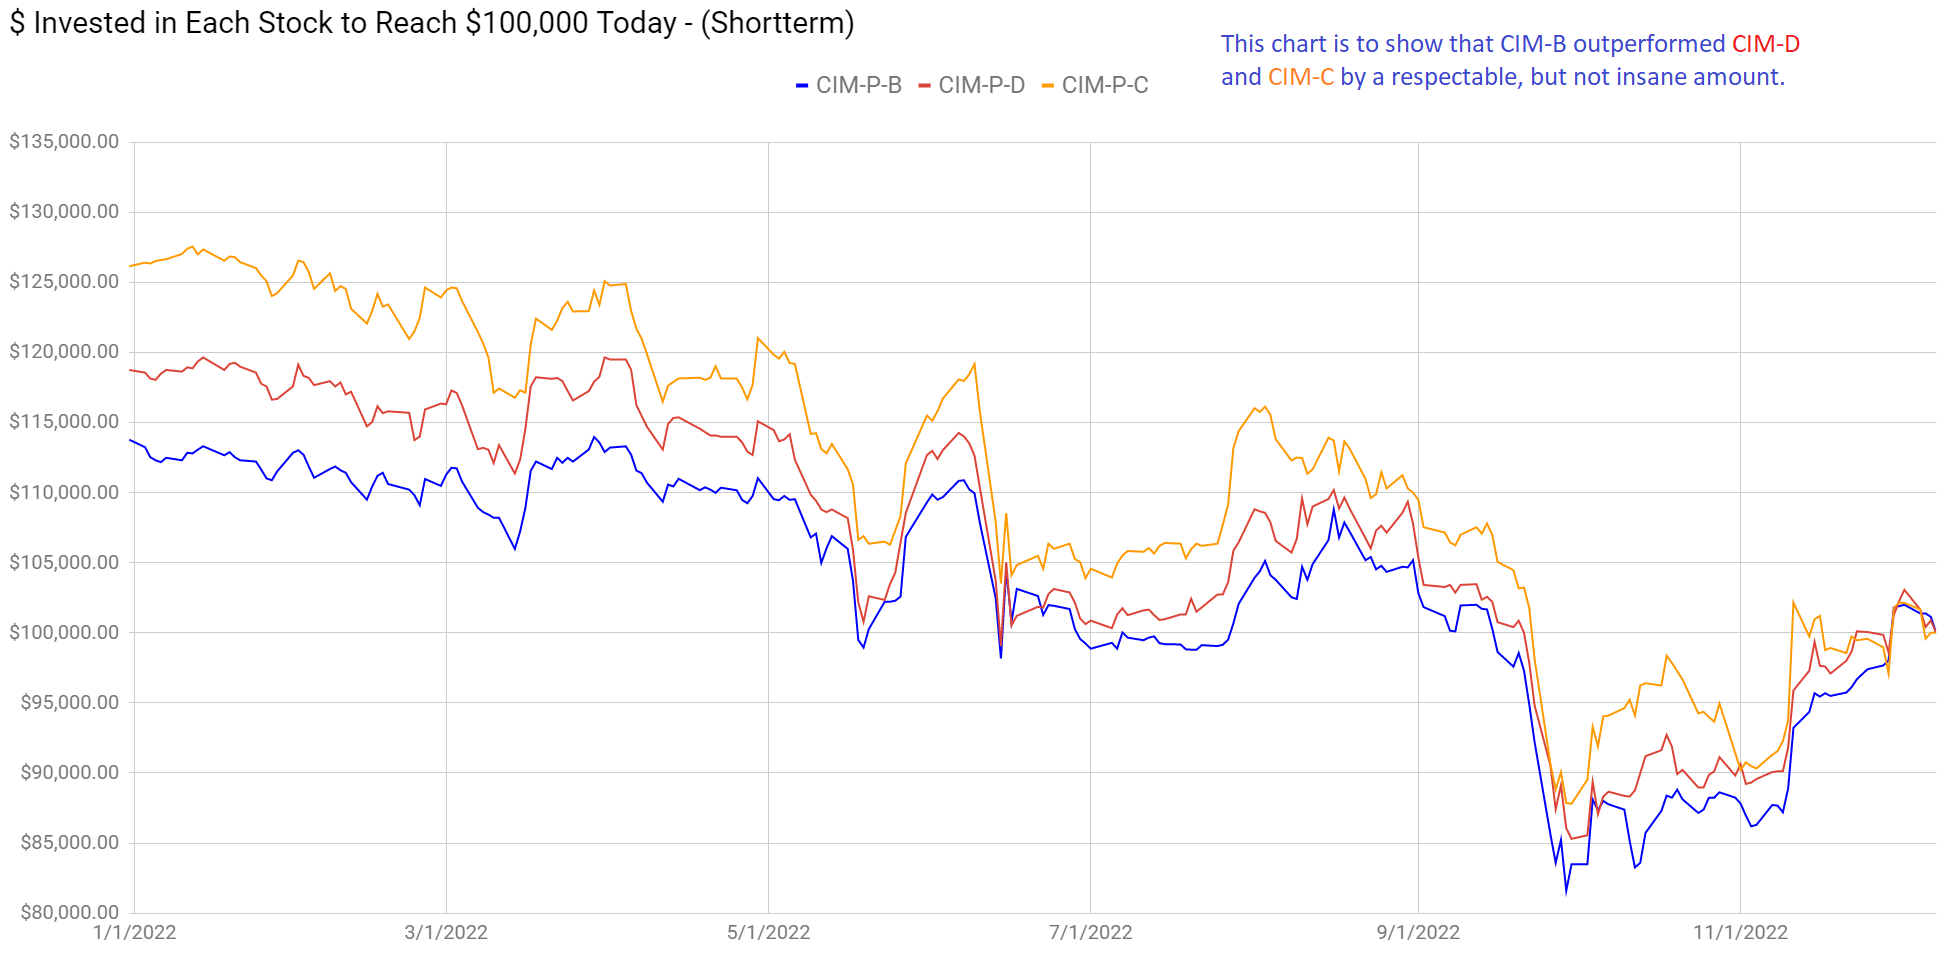
The REIT Forum
When we compare CIM-B to MFA-C and GPMT-A, it becomes clear CIM-B had a dramatic outperformance:

The REIT Forum
From our entry period, CIM-B was a rockstar.
It’s worth noting that CIM-B dominating MFA-C during this period cannot be attributed to differences in the common shares. MFA was better year-to-date and better since the October plunge:
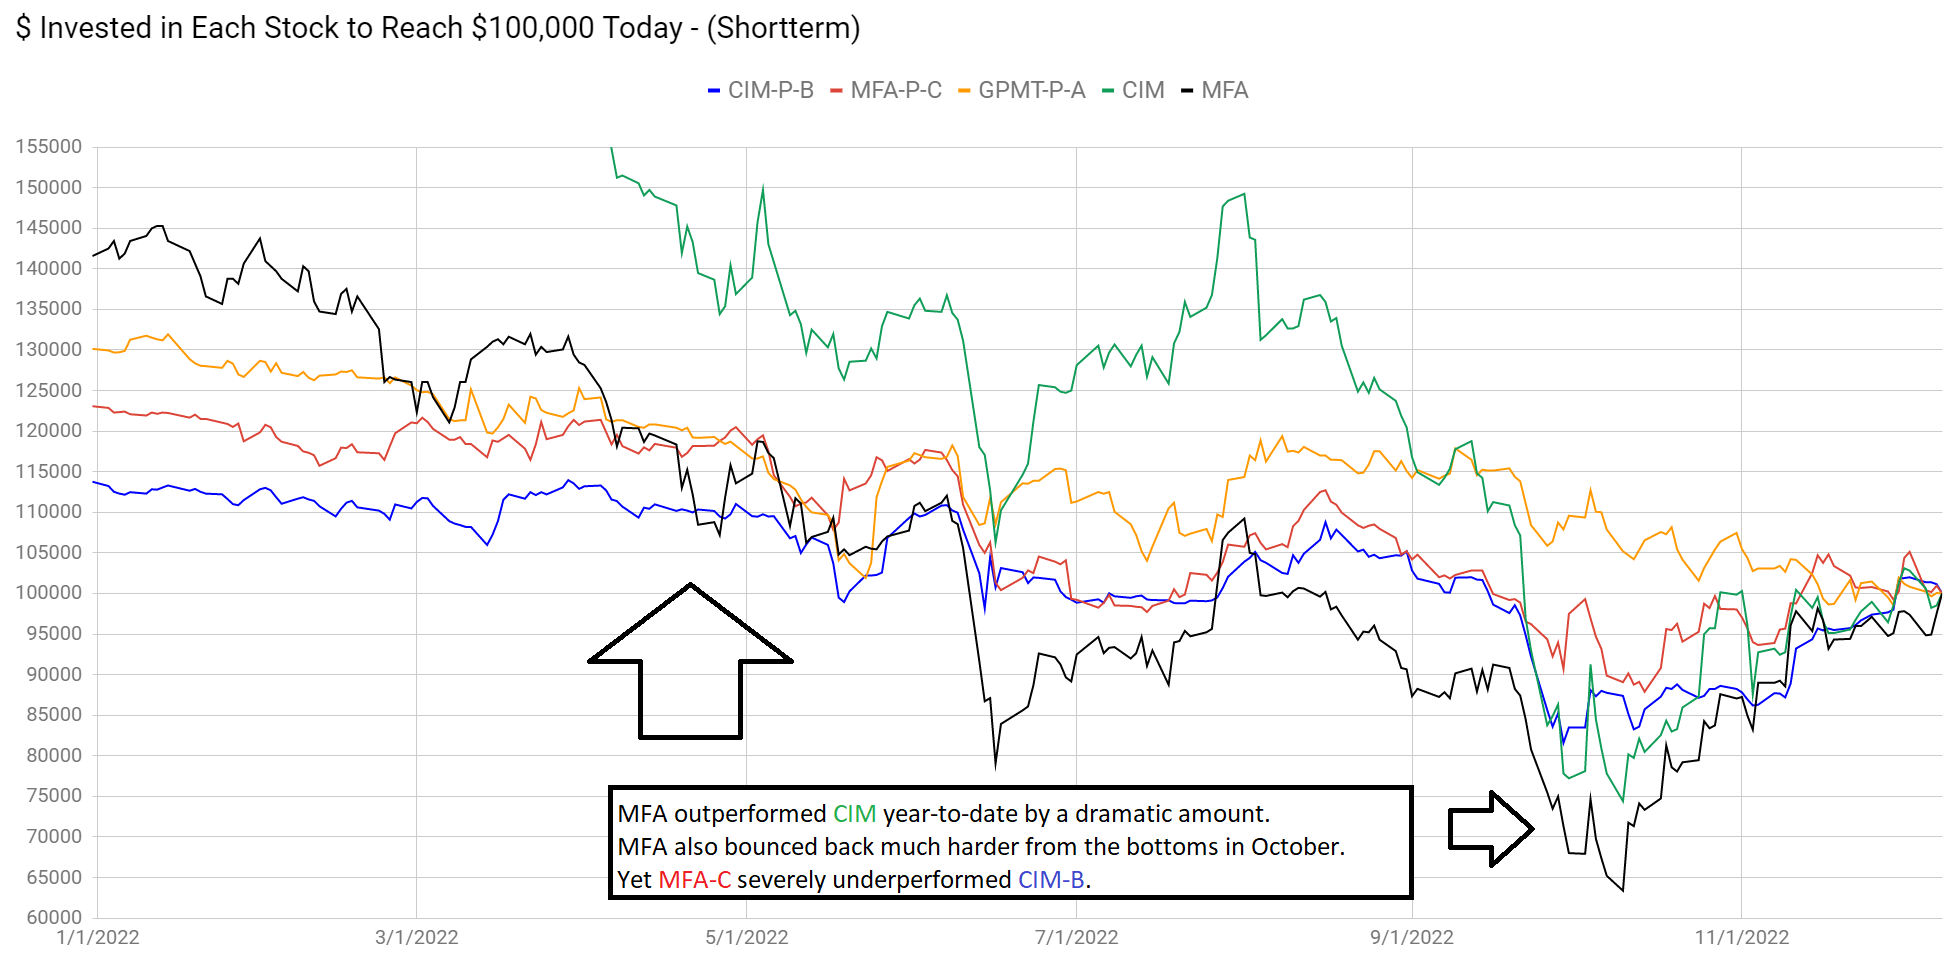
The REIT Forum
We could reasonably argue that the dramatic weakness in GPMT-A is related to the weakness in GPMT common shares. That’s a viable argument, but I think GPMT common shares sold off too hard. I’ve also been arguing that GPMT would be wise to repurchase GPMT-A in the open market. That doesn’t mean they will, simply that it would be a great use of their capital.
If we’re comparing common shares for some perspective on how the market views risks, then we really need the comparison between PMT and MFA:

The REIT Forum
Year-to-date PMT has easily been one of the best mortgage REITs. MFA was better than CIM, but PMT’s common shares were exceptionally strong. Despite that strength, PMT-C underperformed MFA-B.
PMT-C has a lower coupon rate than MFA-B, but the share price is so much lower the stripped yields were nearly identical. So, we get about the same amount of income, a lower risk rating, and more upside to call value.
Stock Table
We will close out the rest of the article with the tables and charts we provide for readers to help them track the sector for both common shares and preferred shares.
We’re including a quick table for the common shares that will be shown in our tables:
Let the images begin!
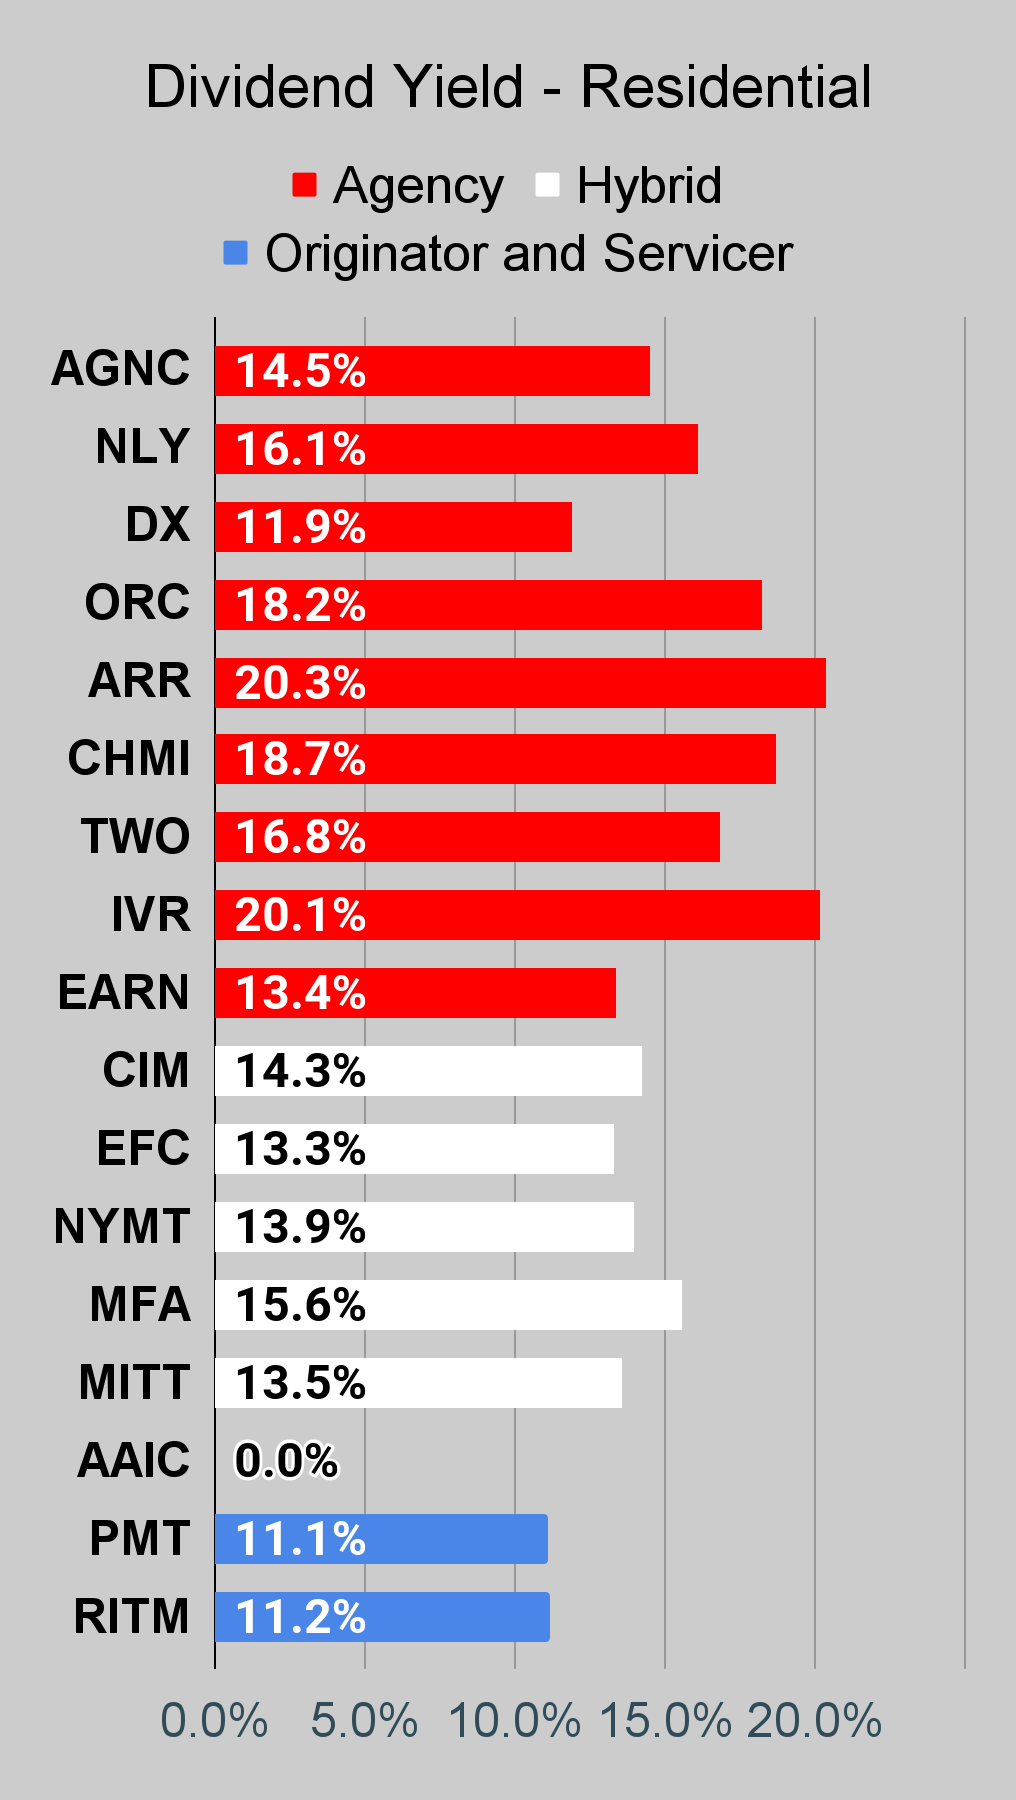
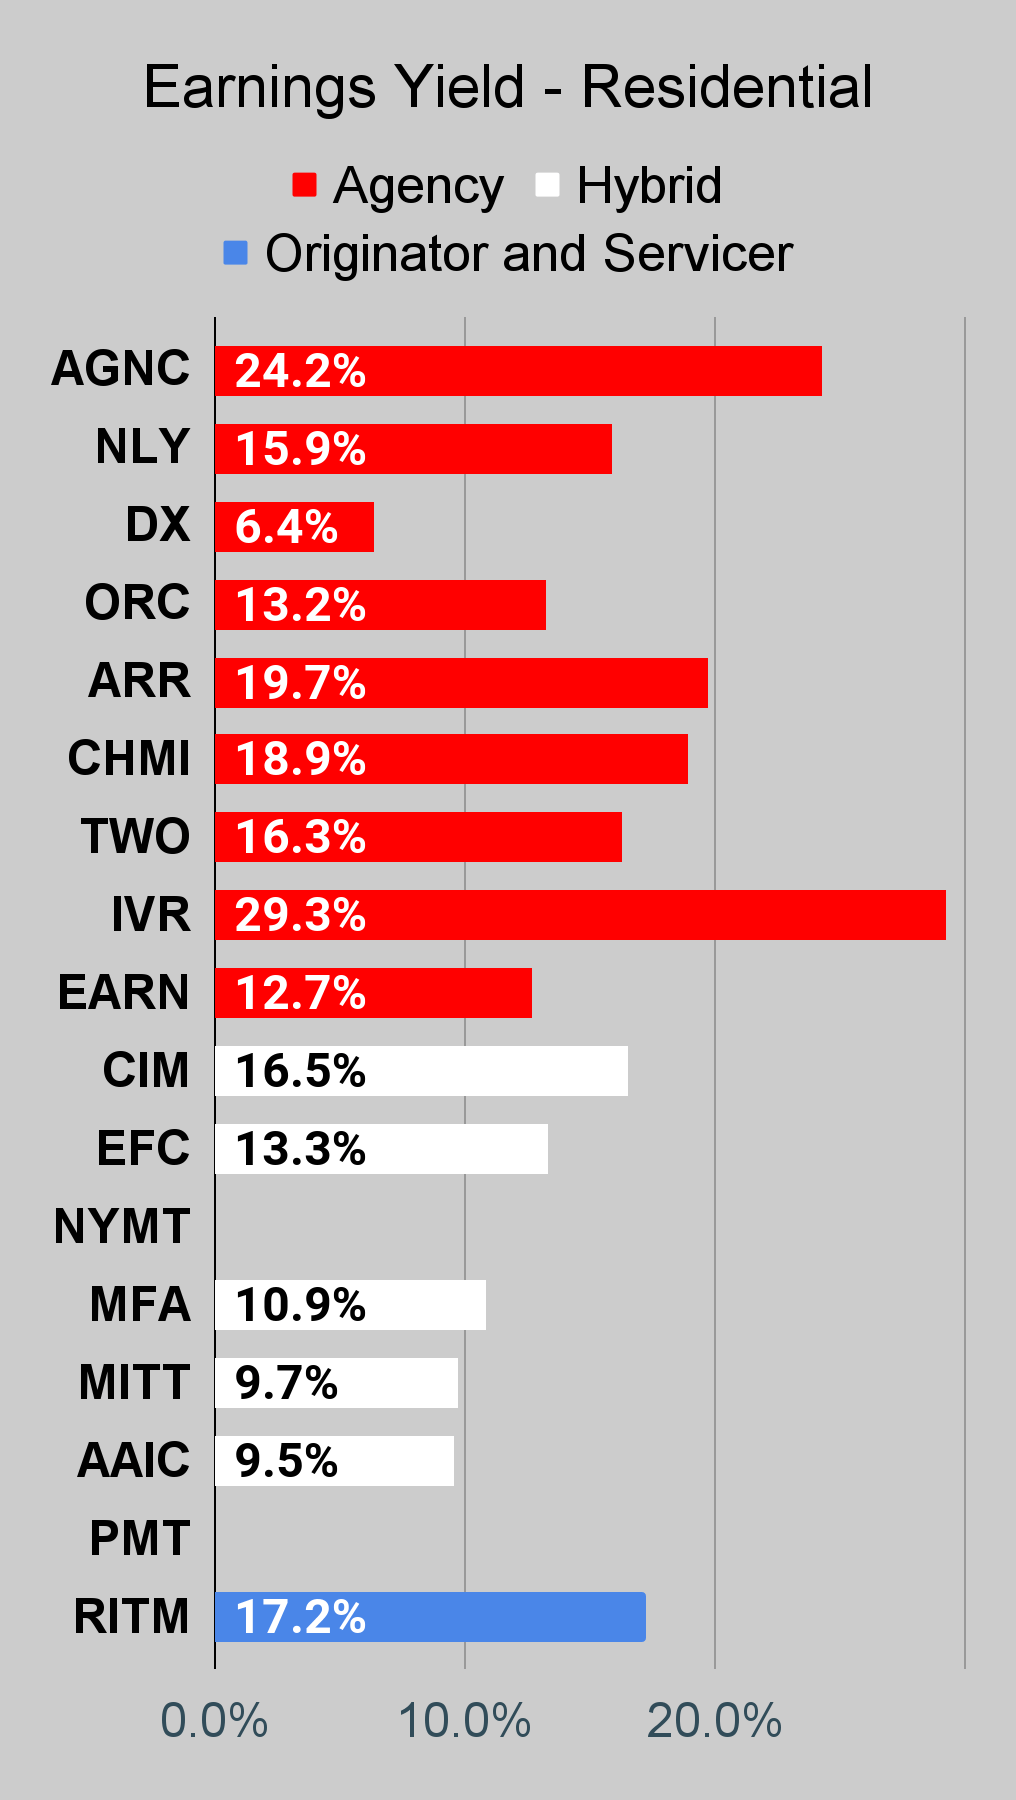
Residential Mortgage REIT Charts
Note: The chart for our public articles uses the book value per share from the latest earnings release. Current estimated book value per share is used in reaching our targets and trading decisions. It is available in our service, but those estimates are not included in the charts below. PMT and NYMT are not showing an earnings yield metric as neither REIT provides a quarterly “Core EPS” metric.
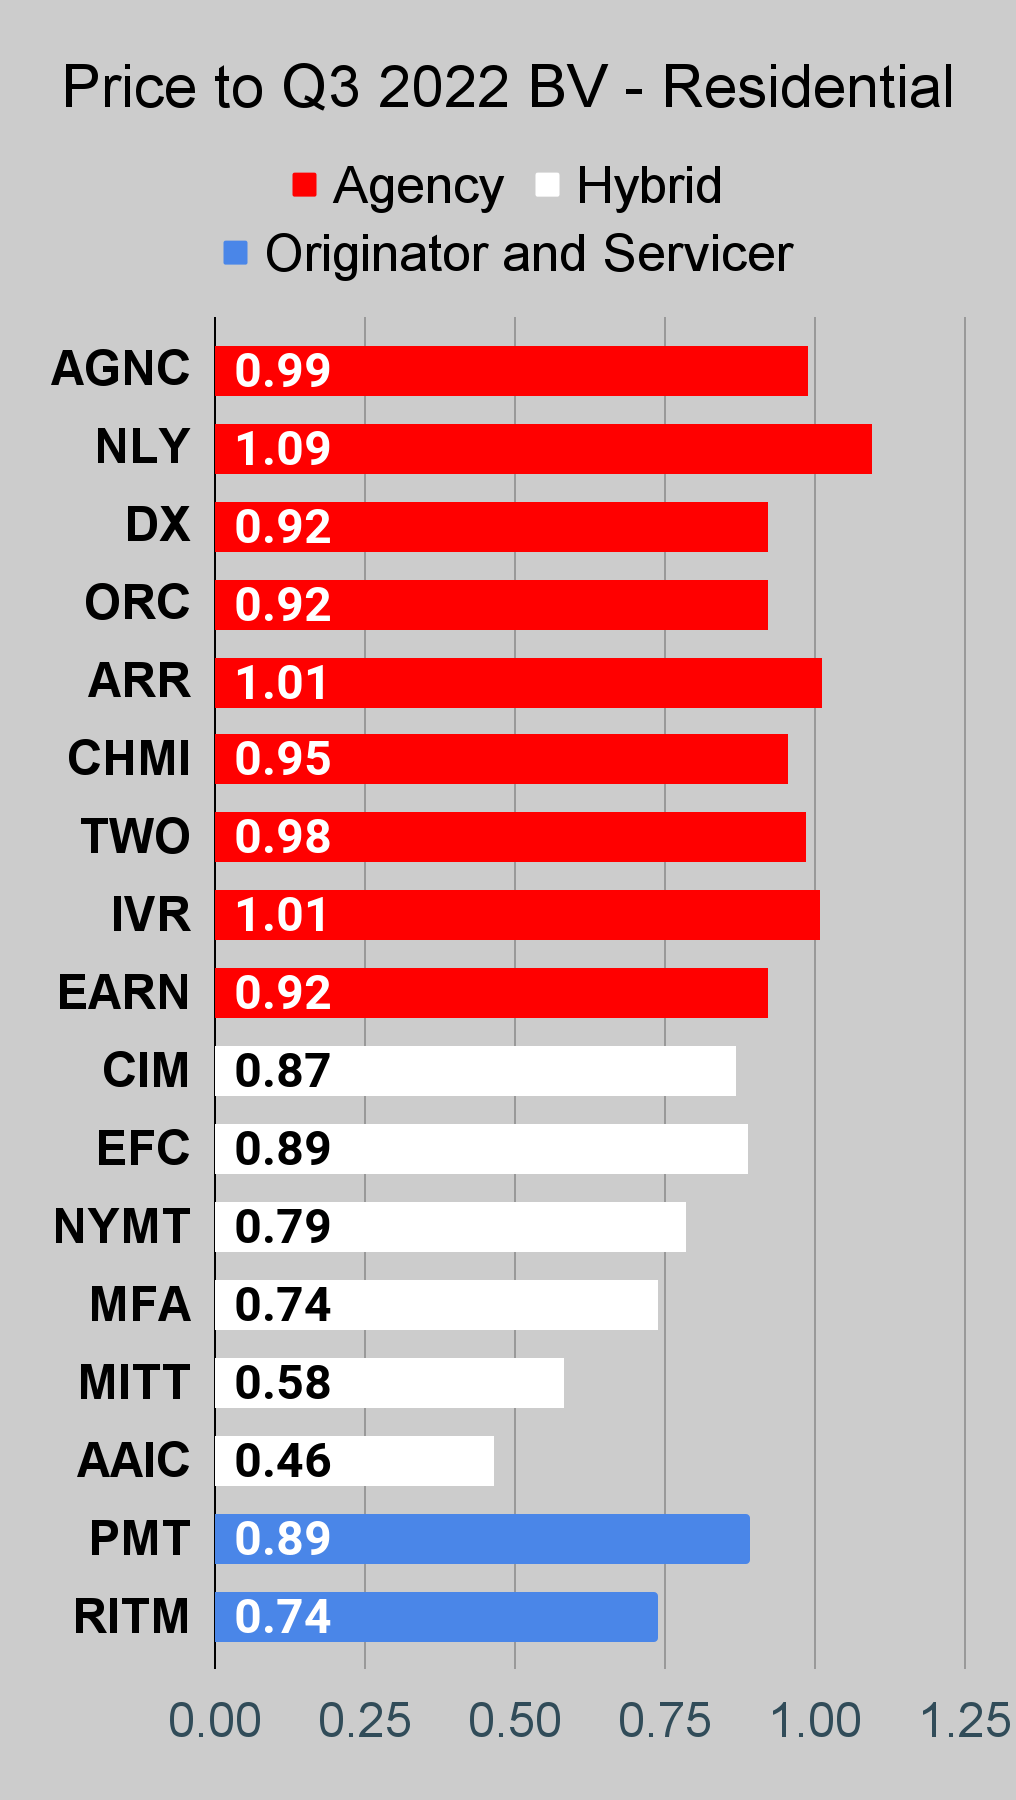 The REIT Forum |
 The REIT Forum |
 The REIT Forum |
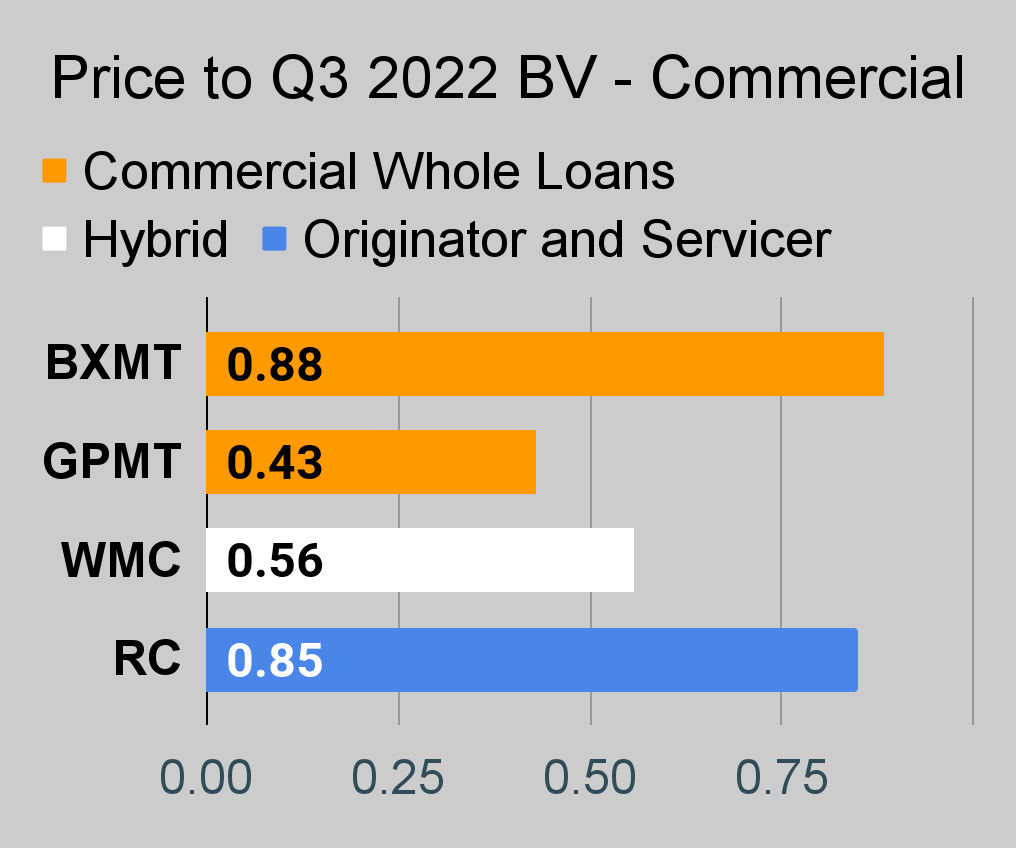
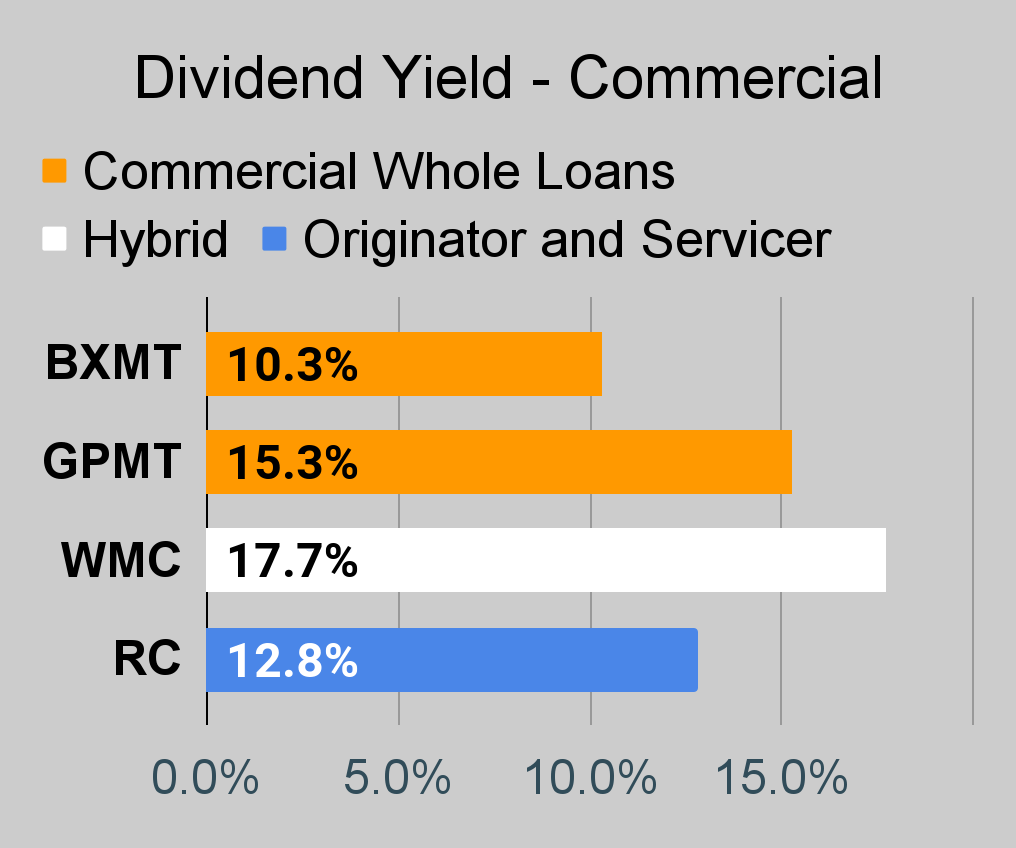
Commercial Mortgage REIT Charts
 The REIT Forum |
 The REIT Forum |
 The REIT Forum |
BDC Charts
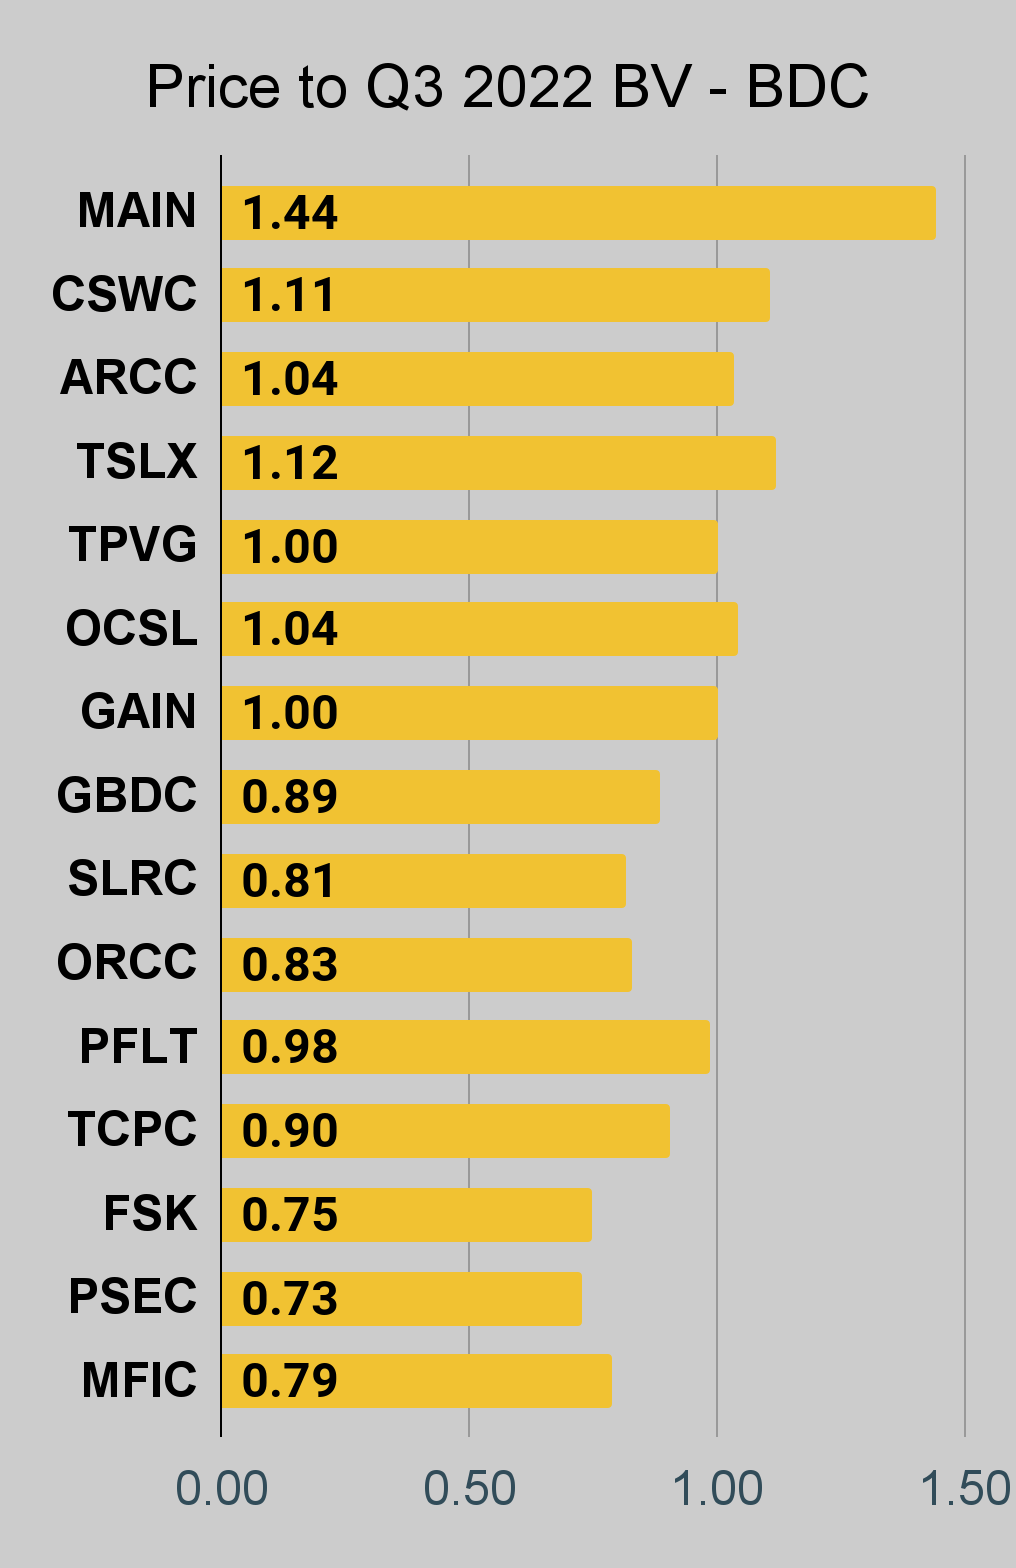 The REIT Forum |
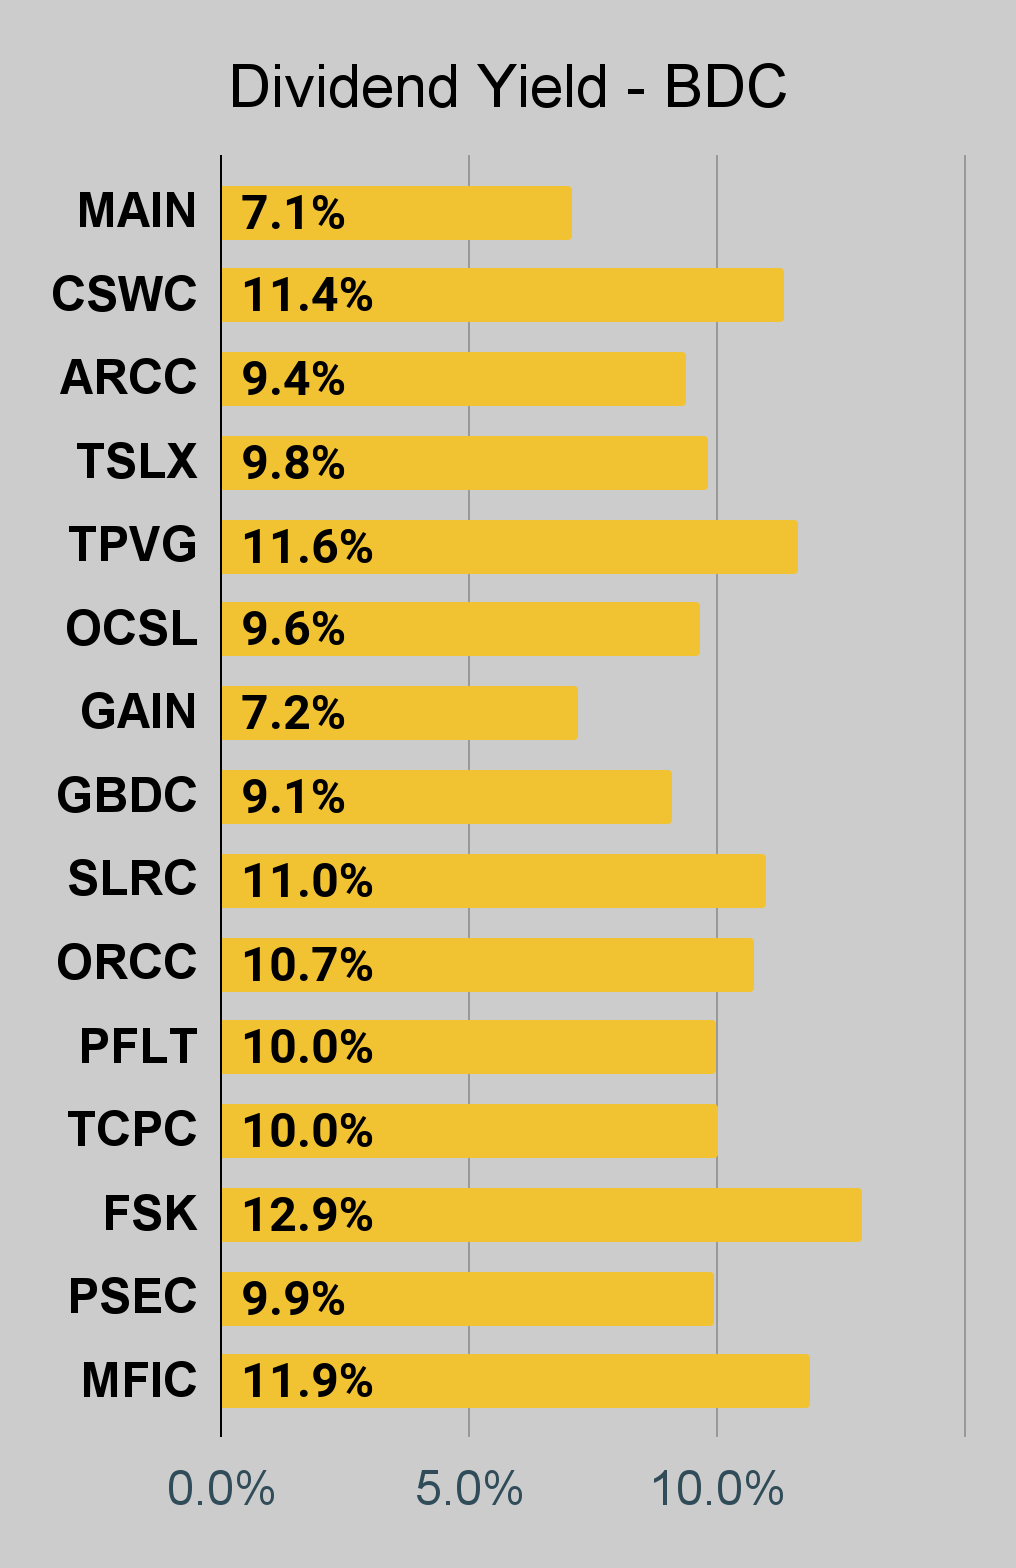 The REIT Forum |
 The REIT Forum |
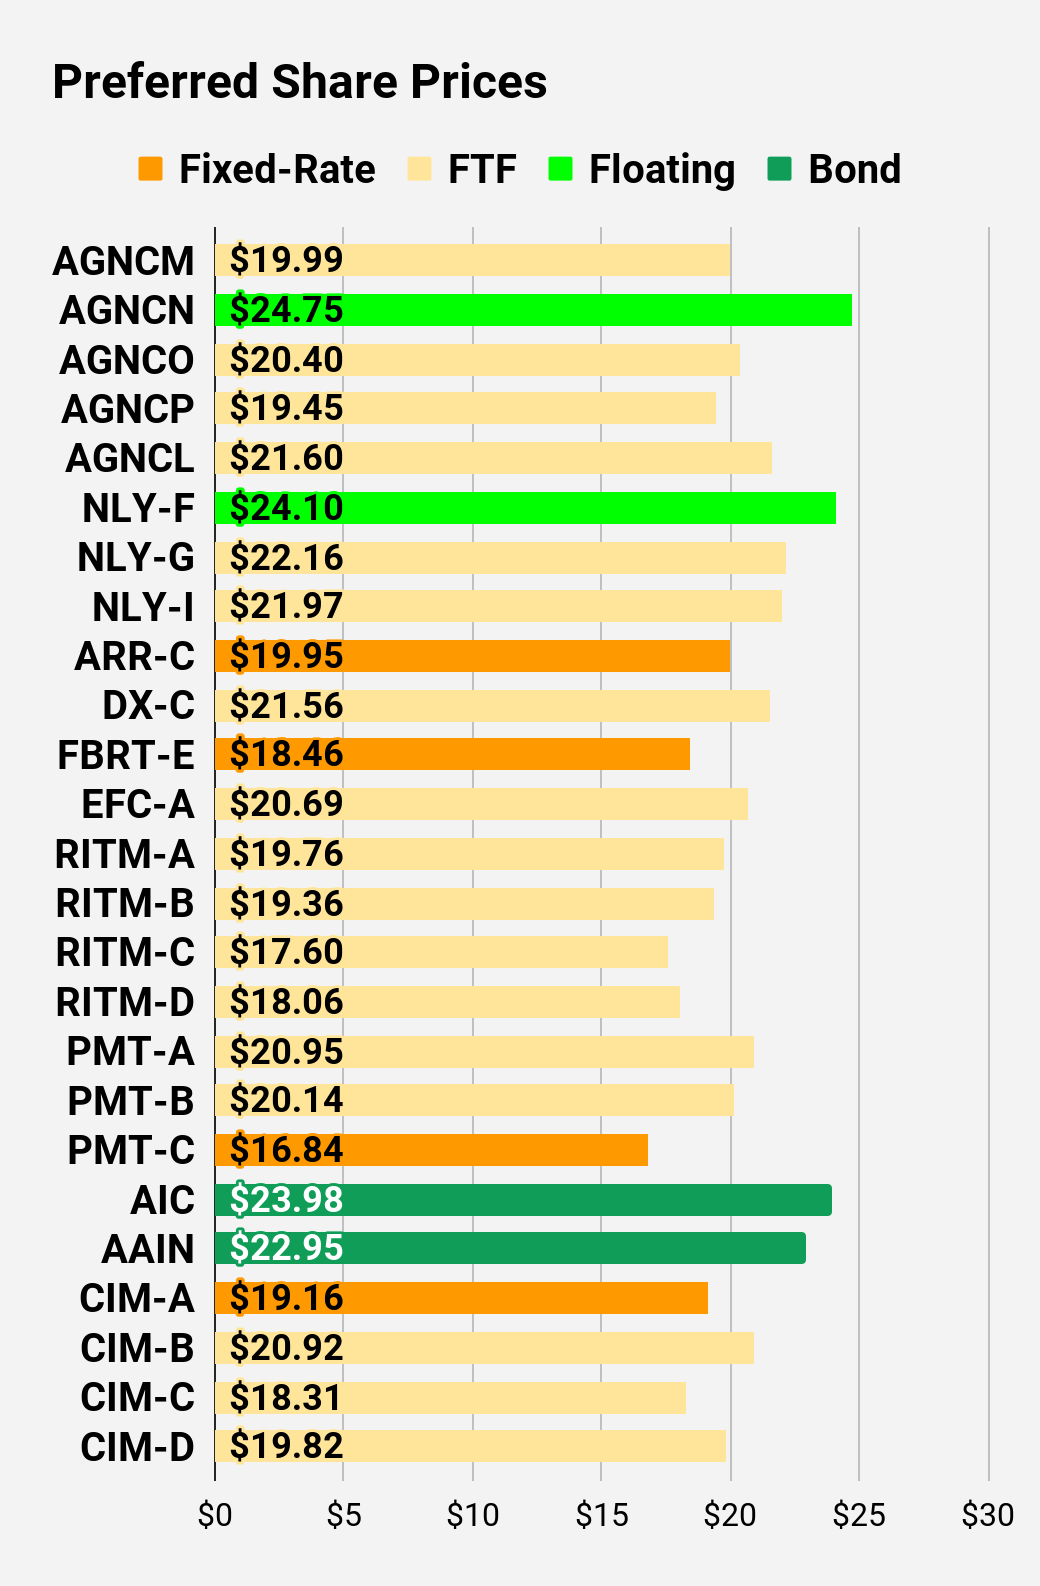
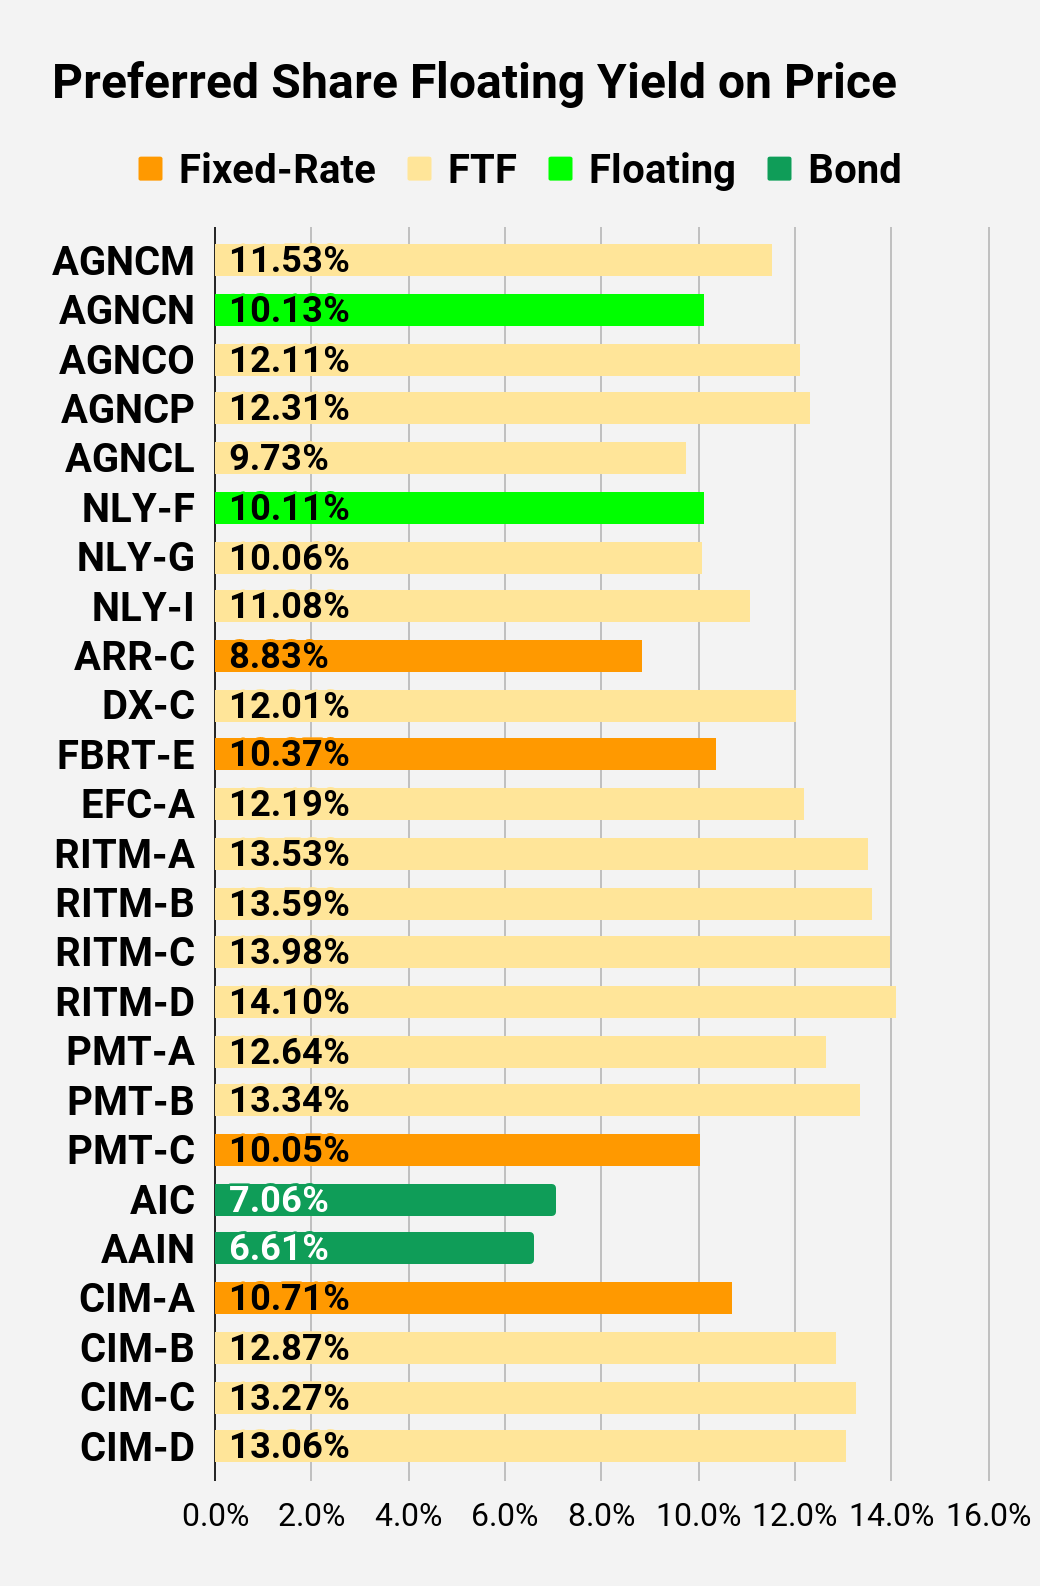
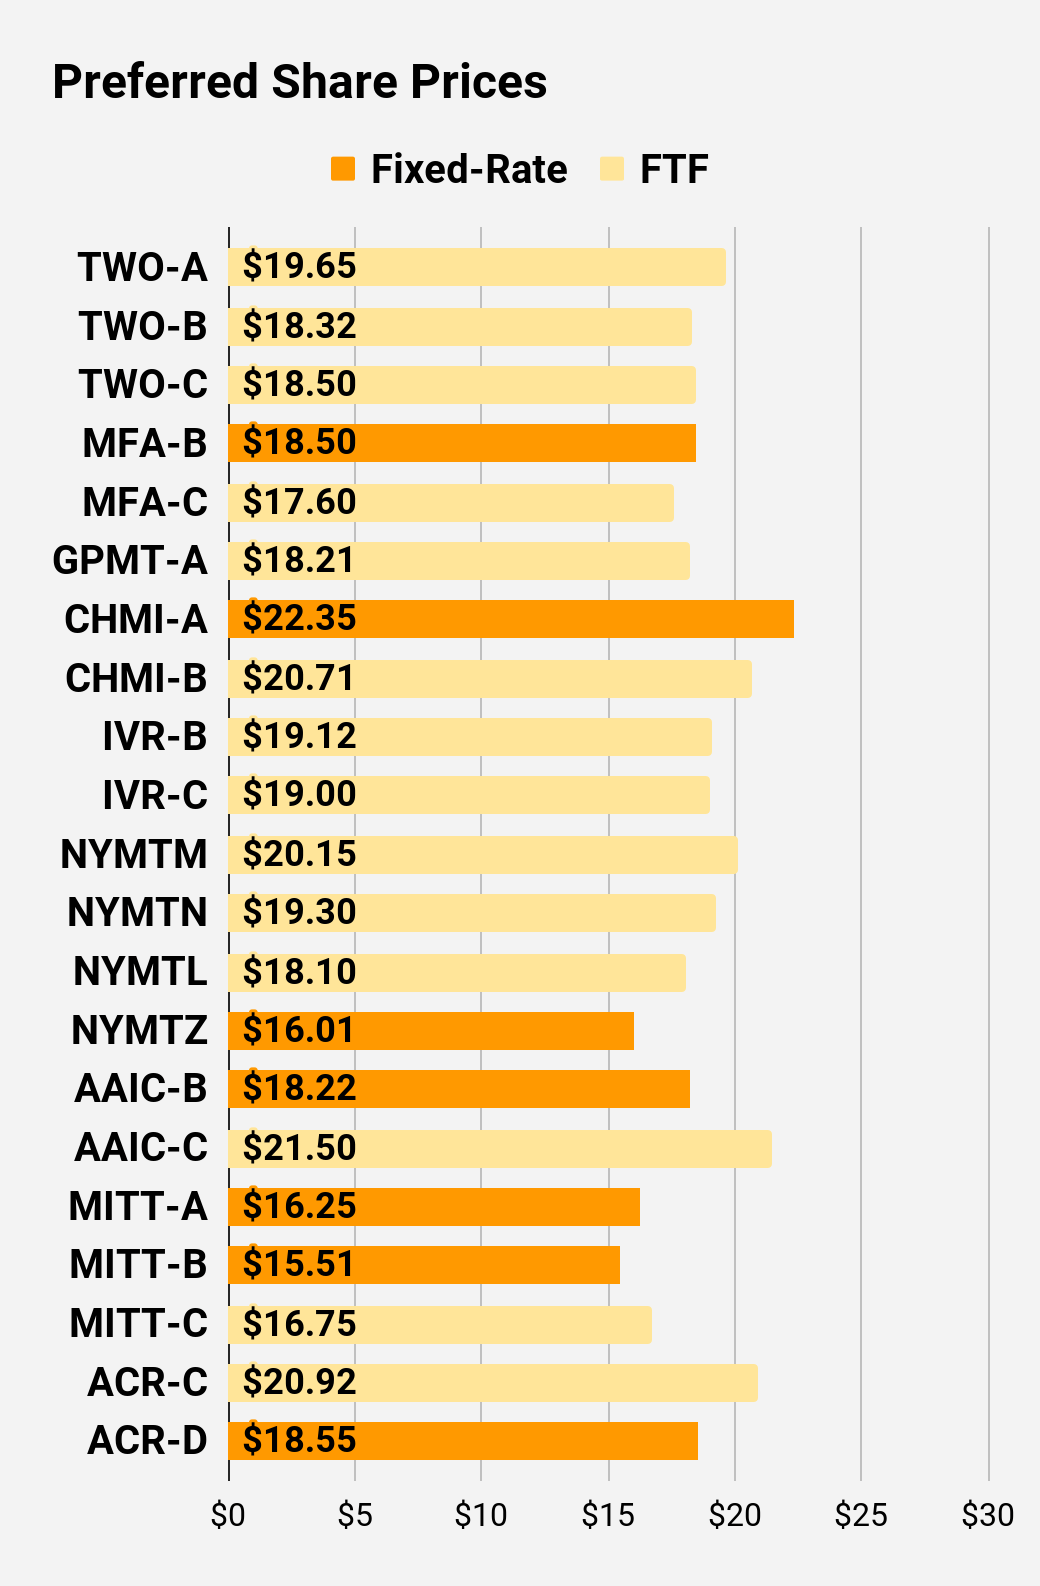
Preferred Share Charts
I changed the coloring a bit. We needed to adjust to include that the first fixed-to-floating shares have transitioned over to floating rates. When a share is already floating, the stripped yield may be different from the “Floating Yield on Price” due to changes in interest rates. For instance, NLY-F already has a floating rate. However, the rate is only reset once per 3 months. The stripped yield is calculated using the upcoming projected dividend payment and the “Floating Yield on Price” is based on where the dividend would be if the rate reset today. In my opinion, for these shares the “Floating Yield on Price” is clearly the more important metric.
 The REIT Forum |
 The REIT Forum |
 The REIT Forum |
 The REIT Forum |
 The REIT Forum |
 The REIT Forum |
Preferred Share Data
Beyond the charts, we’re also providing our readers with access to several other metrics for the preferred shares.
After testing out a series on preferred shares, we decided to try merging it into the series on common shares. After all, we are still talking about positions in mortgage REITs. We don’t have any desire to cover preferred shares without cumulative dividends, so any preferred shares you see in our column will have cumulative dividends. You can verify that by using Quantum Online. We’ve included the links in the table below.
To better organize the table, we needed to abbreviate column names as follows:
- Price = Recent Share Price – Shown in Charts
- BoF = Bond or FTF (Fixed-to-Floating)
- S-Yield = Stripped Yield – Shown in Charts
- Coupon = Initial Fixed-Rate Coupon
- FYoP = Floating Yield on Price – Shown in Charts
- NCD = Next Call Date (the soonest shares could be called)
- Note: For all FTF issues, the floating rate would start on NCD.
- WCC = Worst Cash to Call (lowest net cash return possible from a call)
- QO Link = Link to Quantum Online Page
Second Batch:
Strategy
Our goal is to maximize total returns. We achieve those most effectively by including “trading” strategies. We regularly trade positions in the mortgage REIT common shares and BDCs because:
- Prices are inefficient.
- Long-term, share prices generally revolve around book value.
- Short-term, price-to-book ratios can deviate materially.
- Book value isn’t the only step in analysis, but it is the cornerstone.
We also allocate to preferred shares and equity REITs. We encourage buy-and-hold investors to consider using more preferred shares and equity REITs.
Performance
We compare our performance against 4 ETFs that investors might use for exposure to our sectors:
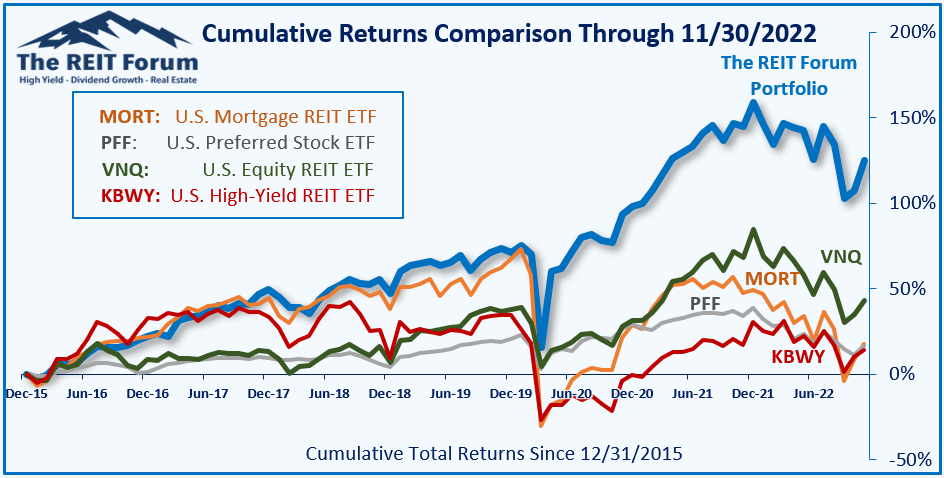
The REIT Forum
The 4 ETFs we use for comparison are:
|
Ticker |
Exposure |
|
One of the largest mortgage REIT ETFs |
|
|
One of the largest preferred share ETFs |
|
|
Largest equity REIT ETF |
|
|
The high-yield equity REIT ETF. Yes, it has been dreadful. |
When investors think it isn’t possible to earn solid returns in preferred shares or mortgage REITs, we politely disagree. The sector has plenty of opportunities, but investors still need to be wary of the risks. We can’t simply reach for yield and hope for the best. When it comes to common shares, we need to be even more vigilant to protect our principal by regularly watching prices and updating estimates for book value and price targets.
Ratings: Bullish on AGNCM, AGNCO, AGNCP, MFA-C, GPMT-A, PMT-C
Be the first to comment