

Liudmila Chernetska
Are you confused by this market? So far in 2022 we’ve seen some of the most extreme market volatility in history, including:
- the 11th worst start to the year ever
- the worst annualized inflation-adjusted returns in 150 years
- the worst bond bear market since 1788
We’ve also seen some of the best months in years.
Daily Shot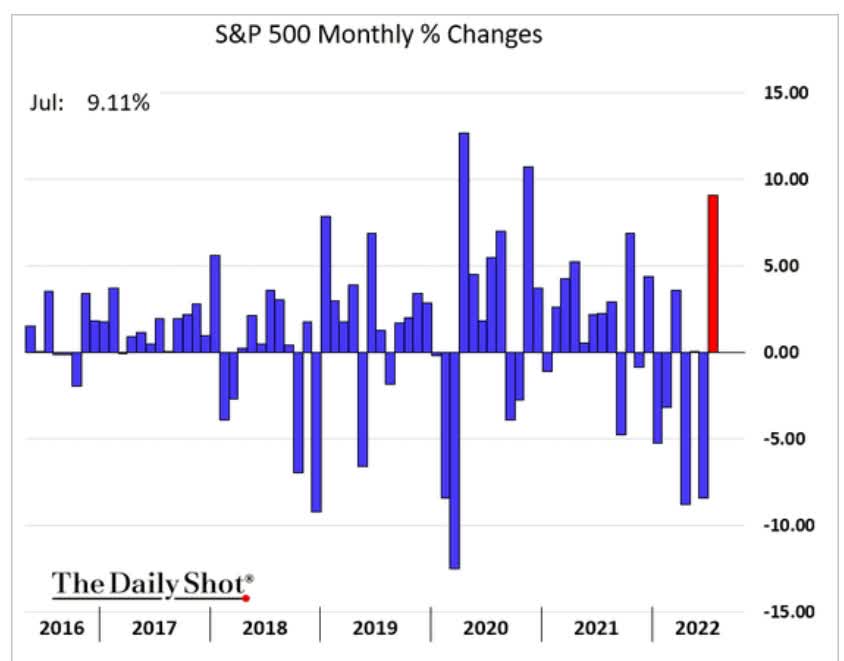
In July, the S&P was up 9%, the best month since November 2020.
Daily Shot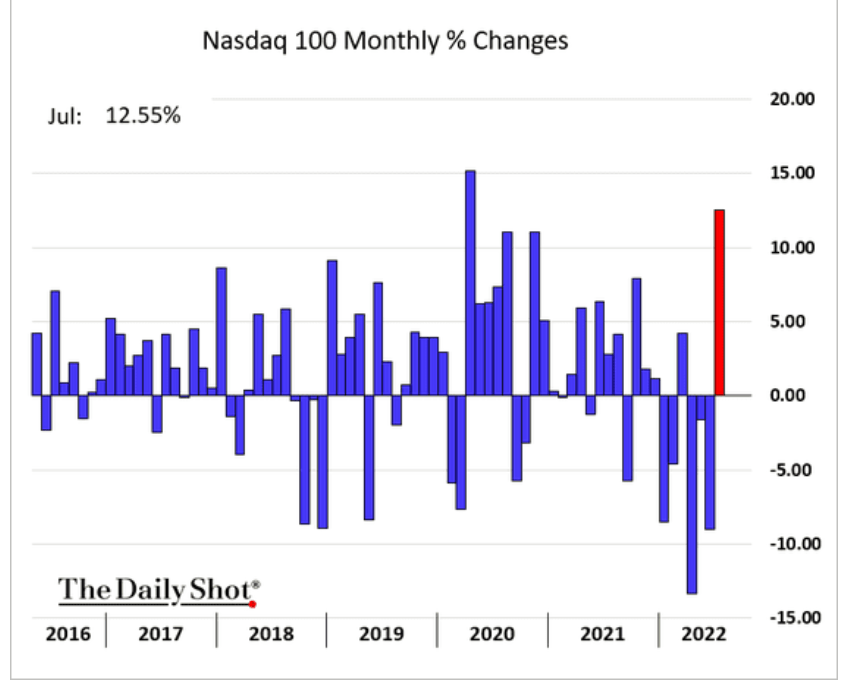
The Nasdaq was up 13%, the best monthly gain since April 2020, right after the Pandemic lows.
Daily Shot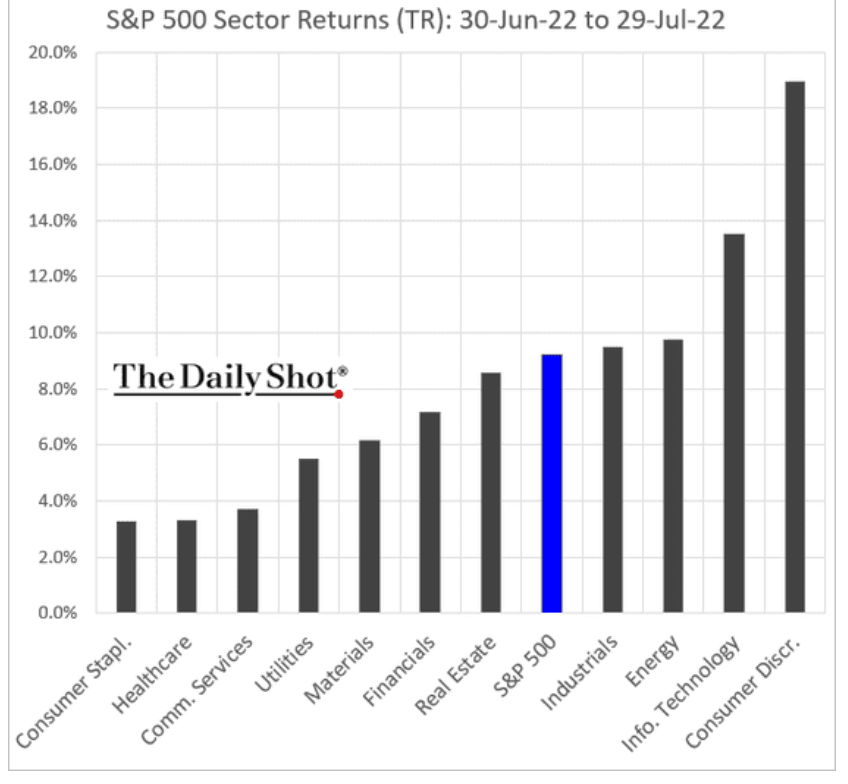
Consumer discretionary was up 19%, despite this being one of the most at-risk sectors in a potential recession that could start in five months.
Daily Shot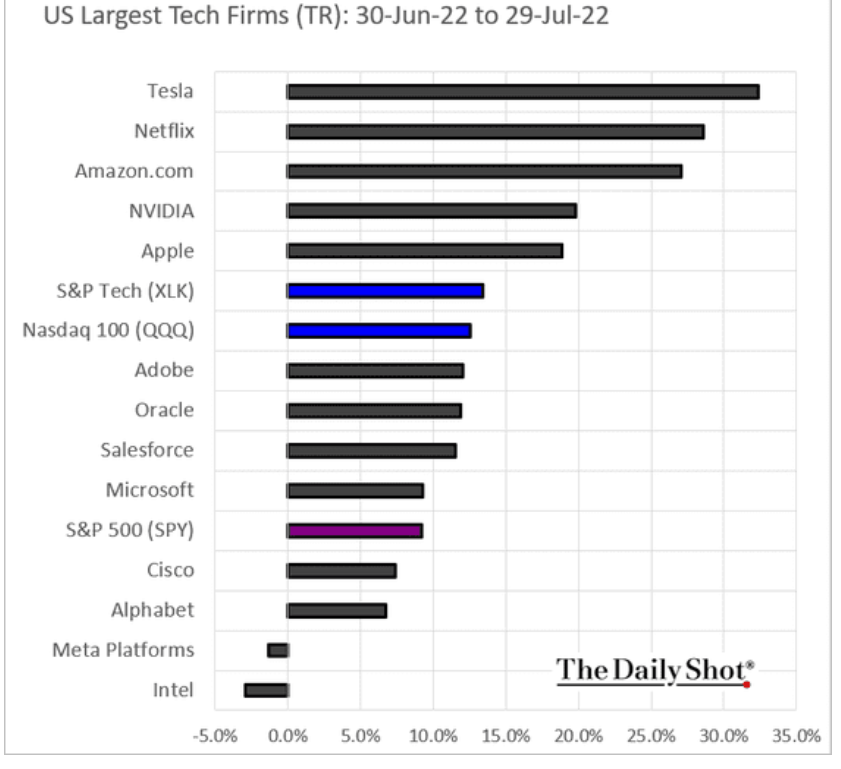
Amazon (AMZN) was up 27%, and Tesla (TSLA), one of the most at-risk companies in a recession, was up 33%.
In this article, I do a deep dive examination of the possible outcomes of this bear market, ranging from June 16th was the bottom (as Goldman (GS) and Citigroup (C) think) to a potential -52% market crash worst case scenario (from UBS (UBS)).
I show how blue-chip economist teams, the most accurate in the world, use fundamental analysis and market history to estimate how bad this bear market can get.
I also showcase the Research Affiliates stagflation hell model, just updated with the latest Cleveland Federal Reserve inflation forecast data.
| Current Month | Research Affiliates CPI Model Estimate |
| July 2022 | 9.4% (8.7% FactSet Consensus, 8.8% Cleveland Fed) |
| August 2022 | 9.7% |
| September 2022 | 10.0% |
| October 2022 | 10.2% |
| November 2022 | 10.3% |
| December 2022 | 10.4% |
| January 2023 | 10.4% |
| February 2023 | 10.4% |
| March 2023 | 10.4% |
| April 2023 | 10.3% |
| May 2023 | 10.2% |
| June 2023 | 10.1% |
| July 2023 | 9.9% |
| August 2023 | 9.7% |
| September 2023 | 9.4% |
| October 2023 | 9.1% (Current Inflation Rate) |
| November 2023 | 8.8% |
| December 2023 | 8.5% |
(Sources: Research Affiliates, Cleveland Fed, Bureau of Labor Statistics)
Are we headed for a recession? The data says one may begin in December 2022.
- Bank of America’s (BAC) base case is a mild recession that begins in Q4 2022
The bond market, via the 2-10 yield curve, is forecasting a recession in late 2022 or early 2023.
Daily Shot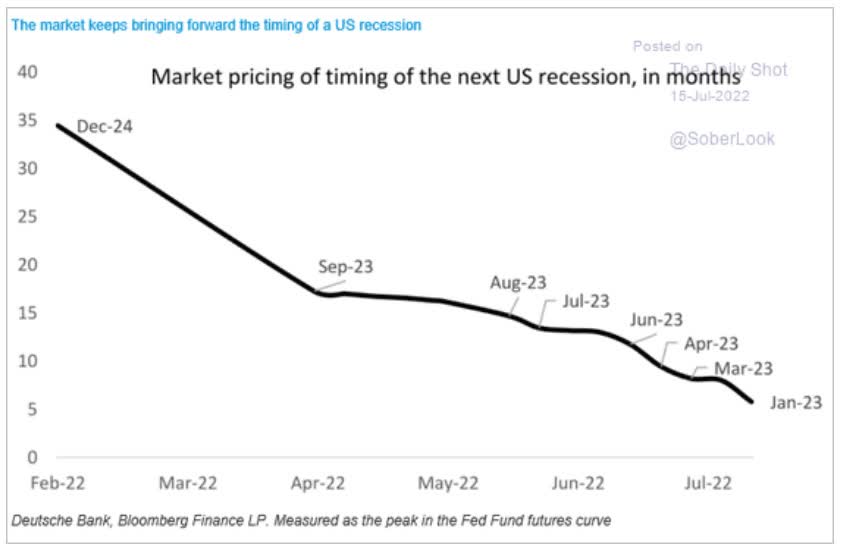
As I write this on August 3rd, the 2-10 yield curve is 34 basis points inverted, the most since 2000.
But wait a second, this sounds like there is nothing but bad news?
- Recession likely
- inflation possibly staying high for another 12+ months
- or even rising to 10.4% by March 2023
- corporate profits will likely fall 10% to 22% in the coming months
- The fed is likely to hike higher than expected (as high as 6% according to Deutsche Bank (DB) and Bridgewater)
- and not cut rates for a long time
Why are stocks roaring higher at the fastest rate since 2020, when the economy was booming coming out of the Pandemic and we had $5 trillion in stimulus and QE?
The main purpose of the stock market is to make fools of as many men as possible.” – Bernard Baruch
Ask 10 investment experts about whether or not any bear market has bottomed, and you’ll get 20 reasonable-sounding answers.
- Both scenarios where we have and scenarios where we haven’t
Bears point to all the risks we’ve already discussed, plus the fact that markets don’t tend to bottom unless the VIX is above 40.
Bulls point to numerous reasons why we might have already seen the bottom.
- Terrible investor sentiment (by some surveys, the worst in history)
- certain technical indicators pointing to a bottom (just 2% of stocks going up on June 16th, for example)
- bullish forecasts about mild earnings declines in the coming recession (Goldman and Citi think -24% is as low as the S&P falls)
Who is right? In the short-term we can’t know whether or not the market bottoms at -24%, -30%, -40%, or -52%.
It’s a wide range of possibilities, but here’s what I do know. To paraphrase Casablanca:
If the market leaves the ground and you haven’t bought some blue-chip bargains, you’ll regret it. Maybe not today, maybe not tomorrow, but soon and for the rest of your life.”
Why is that? Because after the 6 months we just had great stock returns are nearly guaranteed for the next 10 years.
Charlie Bilello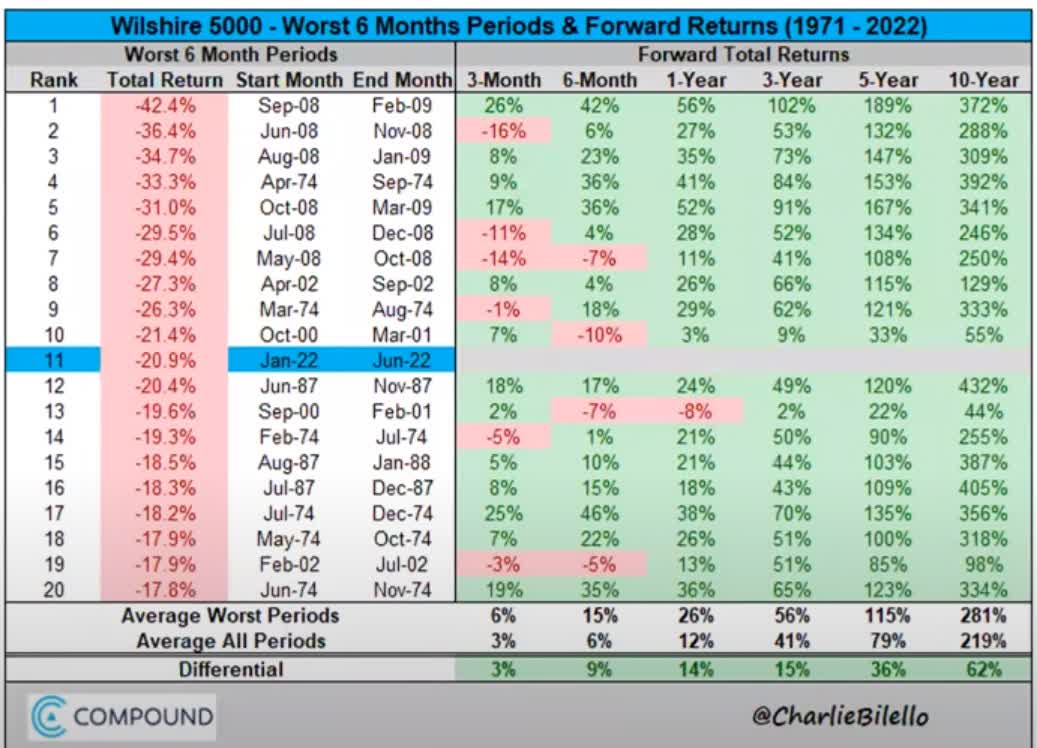
The 20 worst six-month periods in market history were never followed by negative returns over the next 3 years.
Over the next 10 years, the average gain was 281%, a nearly 4X return, or 14.4% CAGR on average.
Individual blue-chips frequently delivered 4X to 9X returns.
But what if we’re headed for stagflation hell as RA thinks? Guess what the market falling to -52% would mean for those historical future returns?
- 4.5X to 6.9X for the S&P over the next 10 years from the eventual bottom
- 9X to 26X for individual blue-chips
In other words, no one can say what will happen over the next two to three years. But over the next 10+ years? That’s fundamental driven destiny.
And that’s why I’m here to tell you to consider buying Broadcom (NASDAQ:AVGO) today.
Not because analysts think it will go up 31% in the next year though that’s true.
Not because it could double over the next five years though that’s true.
But because there are four reasons why Broadcom is a potentially great bear market buy that could change your life and help you retire in safety and splendor.
Reason One: Broadcom Is The Complete High-Yield Dividend Growth Package
Here is the bottom line up front on Broadcom.
Reasons To Potentially Buy AVGO Today
- 83% quality medium-risk 12/13 Super SWAN tech company
- the 179th highest quality company on the Master List (64th percentile)
- 82% dividend safety score
- 11-year dividend growth streak (every year since it began paying one)
- 3.1% very safe yield
- 0.5% average recession dividend cut risk
- 1.8% severe recession dividend cut risk
- 9% historically undervalued (potential reasonable buy, 1% above good buy)
- Fair Value: $581.30 (14.8 PE)
- 13.5X forward earnings vs. 14.5X to 15.5X historical
- 12.4X cash-adjusted earnings = PEG 0.91 growth at a reasonable price
- BBB- positive outlook credit rating = 11% 30-year bankruptcy risk
- 59th industry percentile risk management consensus = above-average, bordering on good, stable trend
- 10% to 26% CAGR margin-of-error growth consensus range
- 10+% CAGR management growth guidance
- 13.6% CAGR median growth consensus
- 5-year consensus total return potential: 11% to 22% CAGR
- base-case 5-year consensus return potential: 14% CAGR (2X more than the S&P consensus)
- consensus 12-month total return forecast: 31%
- Fundamentally Justified 12-Month Returns: 13% CAGR
Broadcom has fallen as much as 30% in this bear market, roughly matching the Nasdaq.
Ycharts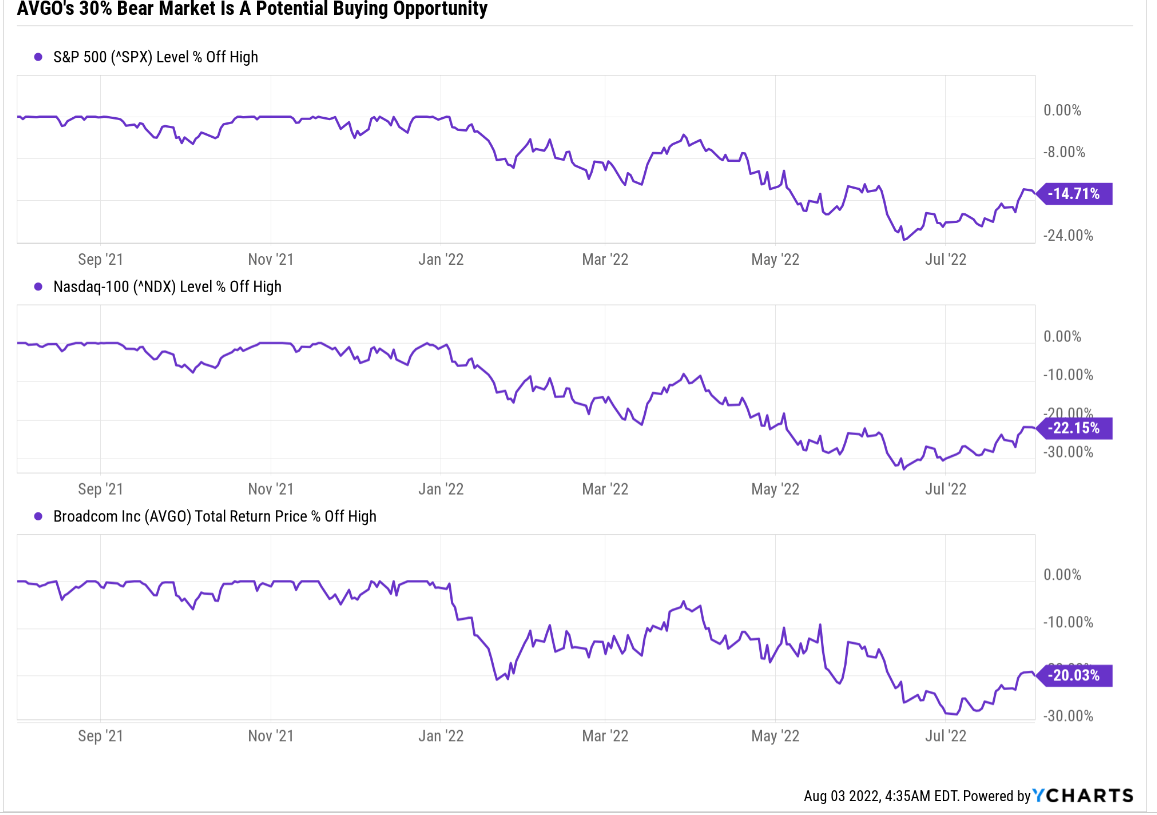
Broadcom’s Growth Outlook Remains Intact
| Metric | 2021 Growth | 2022 Growth Consensus | 2023 Growth Consensus (Potential Recession Year) |
2024 Growth Consensus |
| Sales | 13% | 21% | 6% | 3% |
| Dividend | 11% | 14% (Official) | 12% | NA |
| EPS | 26% | 32% | 9% | 8% |
| Operating Cash Flow | 12% | 26% | 9% | 6% |
| Free Cash Flow | 13% | 26% | 7% | 4% |
| EBITDA | 28% | 41% | 4% | 5% |
| EBIT (operating income) | 96% | 134% | 6% | 2% |
(Source: FAST Graphs, FactSet)
Broadcom’s growth outlook remains solid despite slowing global growth and a potential recession next year.
AVGO Rolling Returns Since September 2009
(Source: Portfolio Visualizer Premium)
Broadcom’s returns from bear markets are the stuff of legend.
- as much as 30X returns over the next 10 years
AVGO 2024 Consensus Total Return Potential
(Source: FAST Graphs, FactSet) (Source: FAST Graphs, FactSet)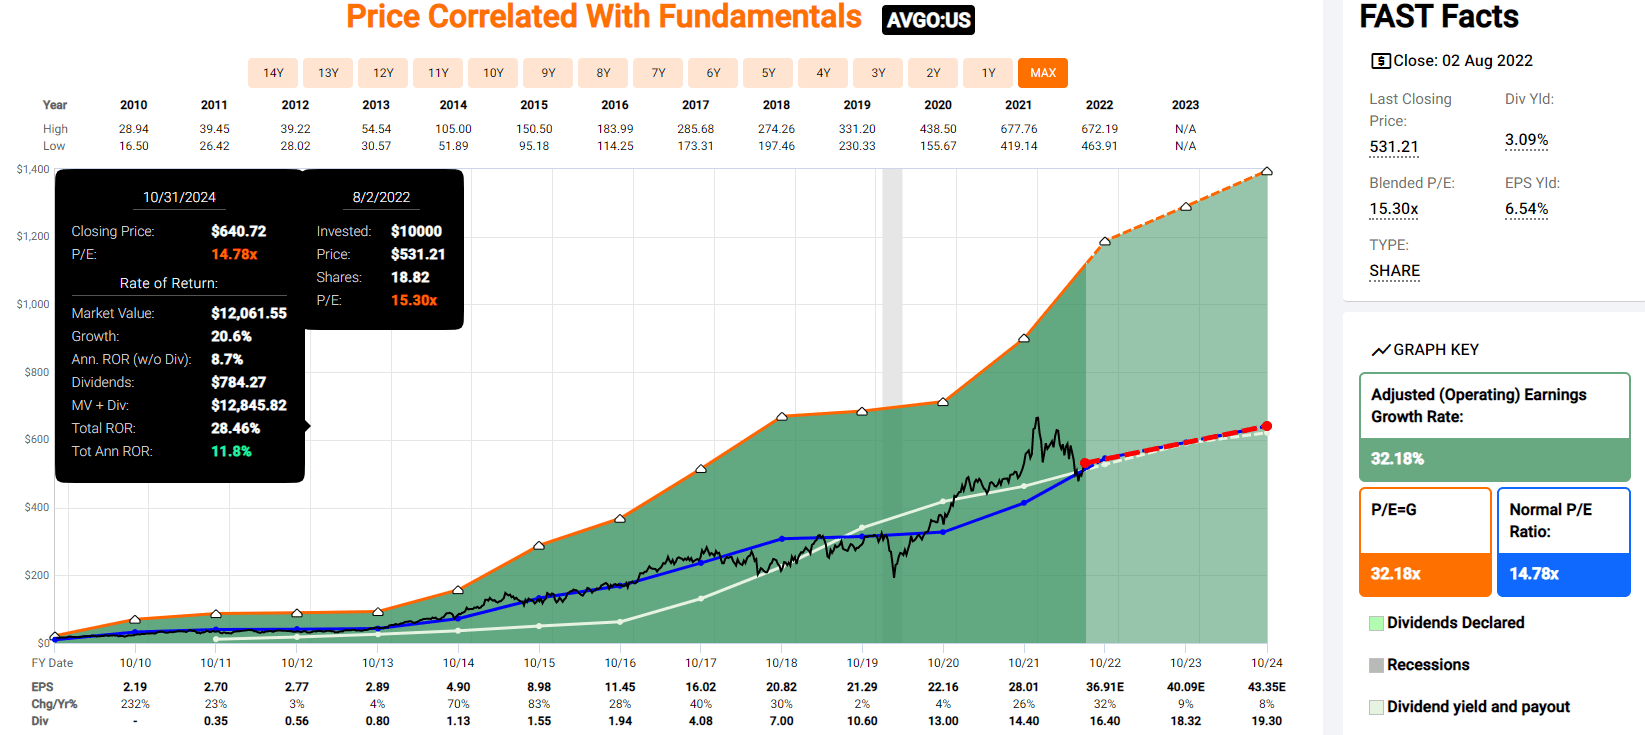
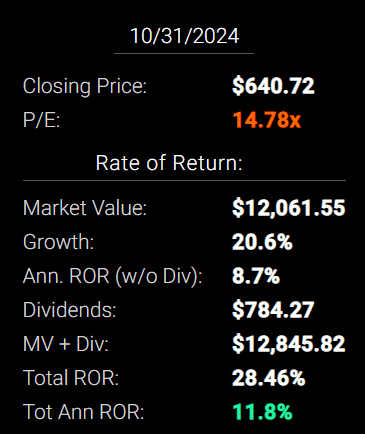
If AVGO grows as analysts expect through 2024 and returns to historical fair value, it could deliver 28% total returns or 12% annually.
- 33% better than the S&P 500
Now compare that to the S&P 500 consensus.
S&P 2024 Consensus Total Return Potential
(Source: FAST Graphs, FactSet)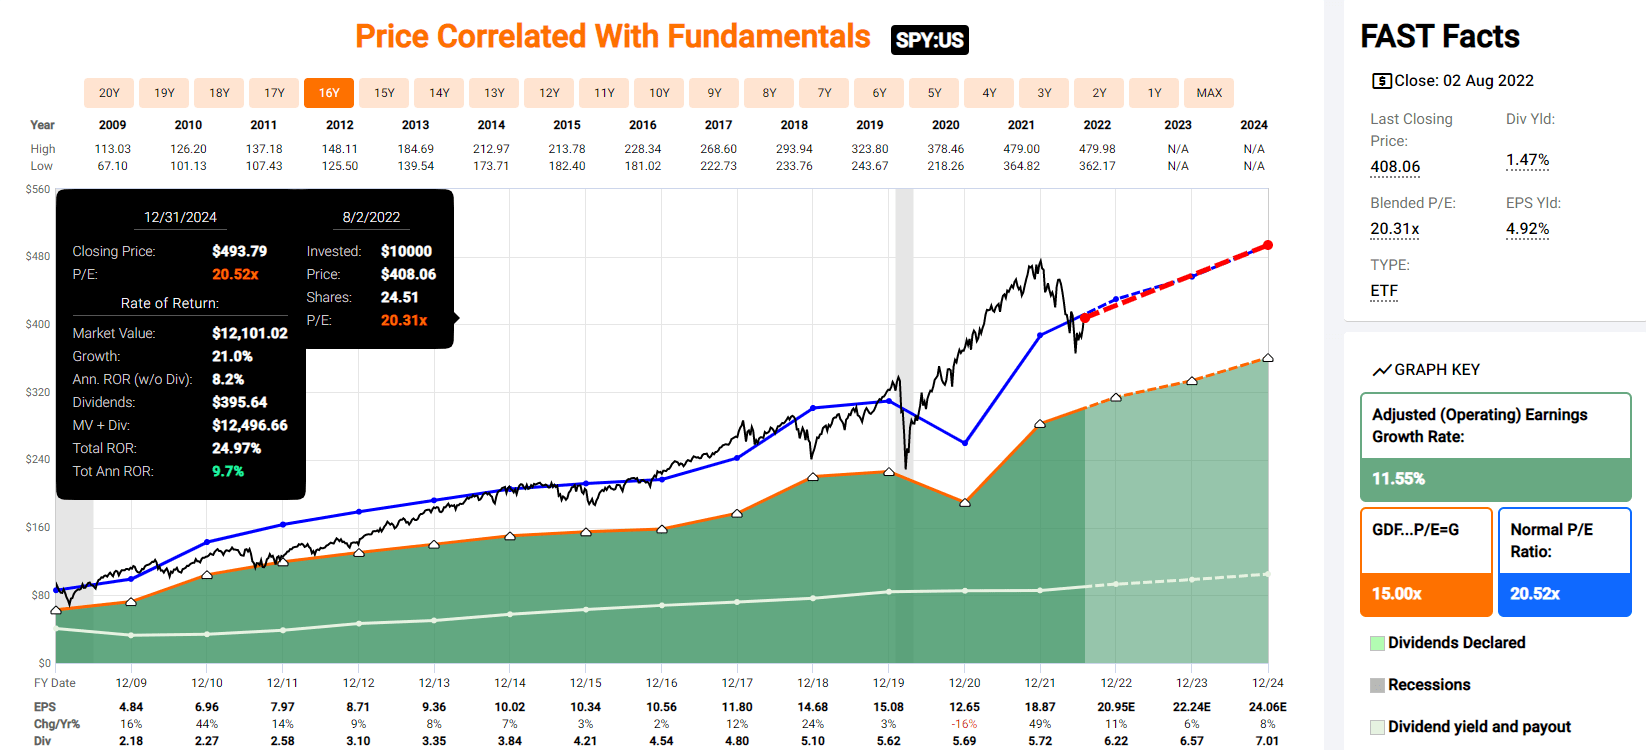
(Source: FAST Graphs, FactSet)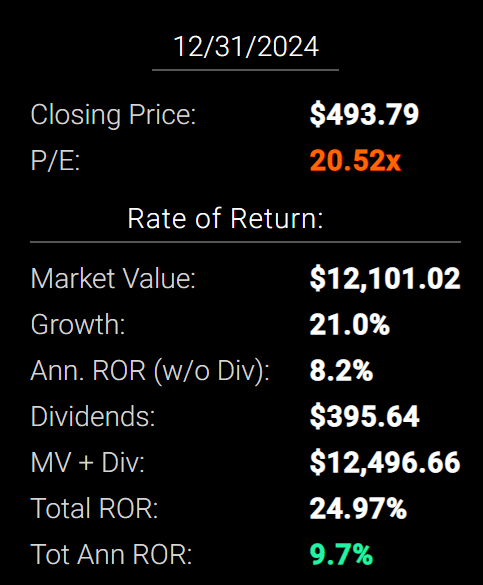
Analysts expect about 25% or 10% annual returns from the S&P 500 over the next 2.5 years.
AVGO 2027 Consensus Total Return Potential
(Source: FAST Graphs, FactSet) (Source: FAST Graphs, FactSet)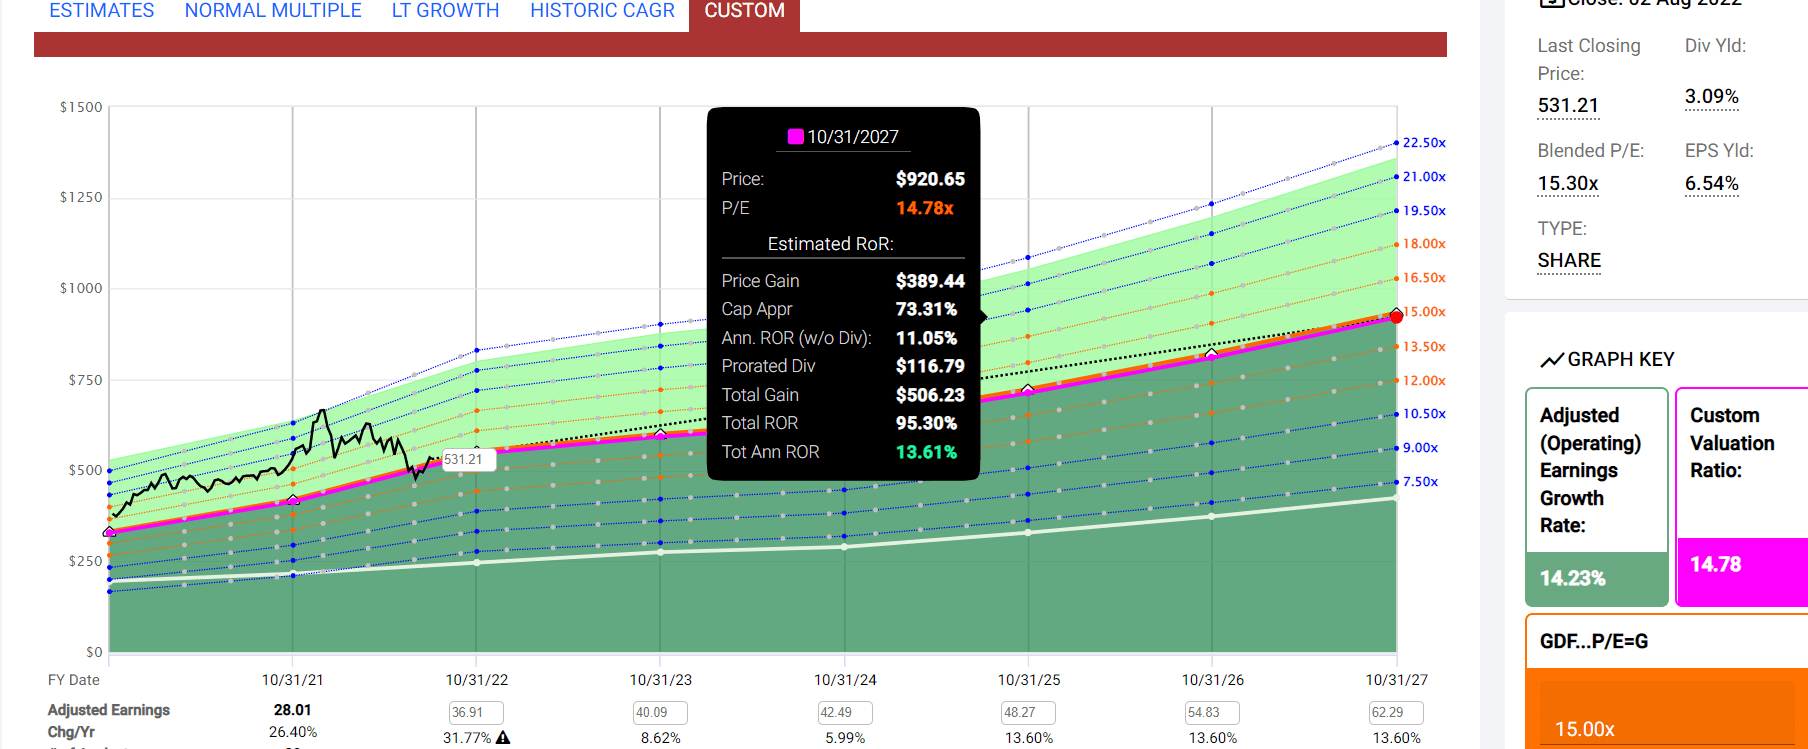
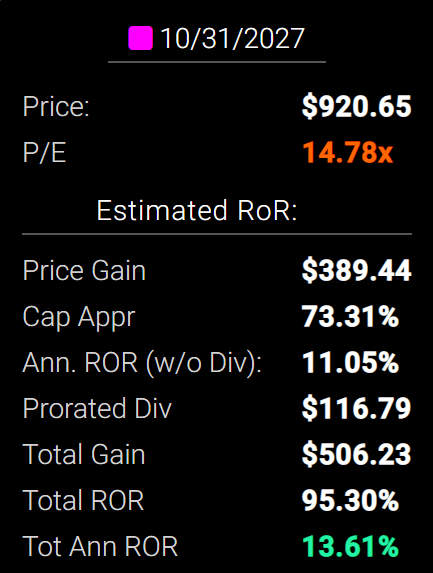
By 2027, if AVGO grows as expected and returns to historical mid-range historical fair value, it could deliver double, delivering 14% annual returns.
- more than 2X more than the S&P 500 consensus
S&P 500 2027 Consensus Return Potential
| Year | Upside Potential By End of That Year | Consensus CAGR Return Potential By End of That Year | Probability-Weighted Return (Annualized) | Inflation And Risk-Adjusted Expected Returns |
Conservative Years To Double |
| 2027 | 49.12% | 8.32% | 6.24% | 4.08% | 17.65 |
(Source: DK S&P 500 Valuation And Total Return Tool)
Over the next five years, analysts expect about 49% total returns.
AVGO Long-Term Consensus Total Return Potential
| Investment Strategy | Yield | LT Consensus Growth | LT Consensus Total Return Potential | Long-Term Risk-Adjusted Expected Return | Long-Term Inflation And Risk-Adjusted Expected Returns | Years To Double Your Inflation & Risk-Adjusted Wealth |
10-Year Inflation And Risk-Adjusted Expected Return |
| Broadcom | 3.1% | 13.6% | 16.7% | 11.7% | 9.2% | 7.8 | 2.42 |
| Dividend Aristocrats | 2.6% | 8.6% | 11.1% | 7.8% | 5.3% | 13.5 | 1.68 |
| S&P 500 | 1.7% | 8.5% | 10.2% | 7.1% | 4.7% | 15.4 | 1.58 |
| Nasdaq | 1.0% | 14.3% | 15.3% | 10.7% | 8.2% | 8.8 | 2.20 |
(Sources: Morningstar, FactSet, Ycharts) – ignores valuation, which cancels out over 30+ years
Analysts think AVGO could outperform almost every popular investment strategy, including the S&P 500, dividend aristocrats, and Nasdaq.
AVGO Total Returns Since September 2009
(Source: Portfolio Visualizer Premium)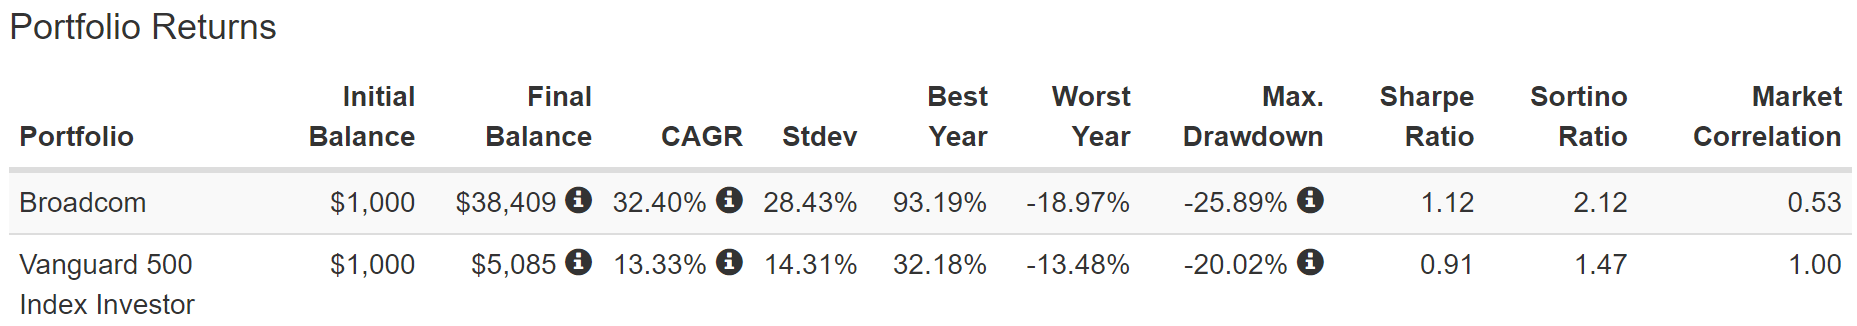
Broadcom is one of the best investments of the last 13 years, delivering 38X returns.
(Source: Portfolio Visualizer Premium)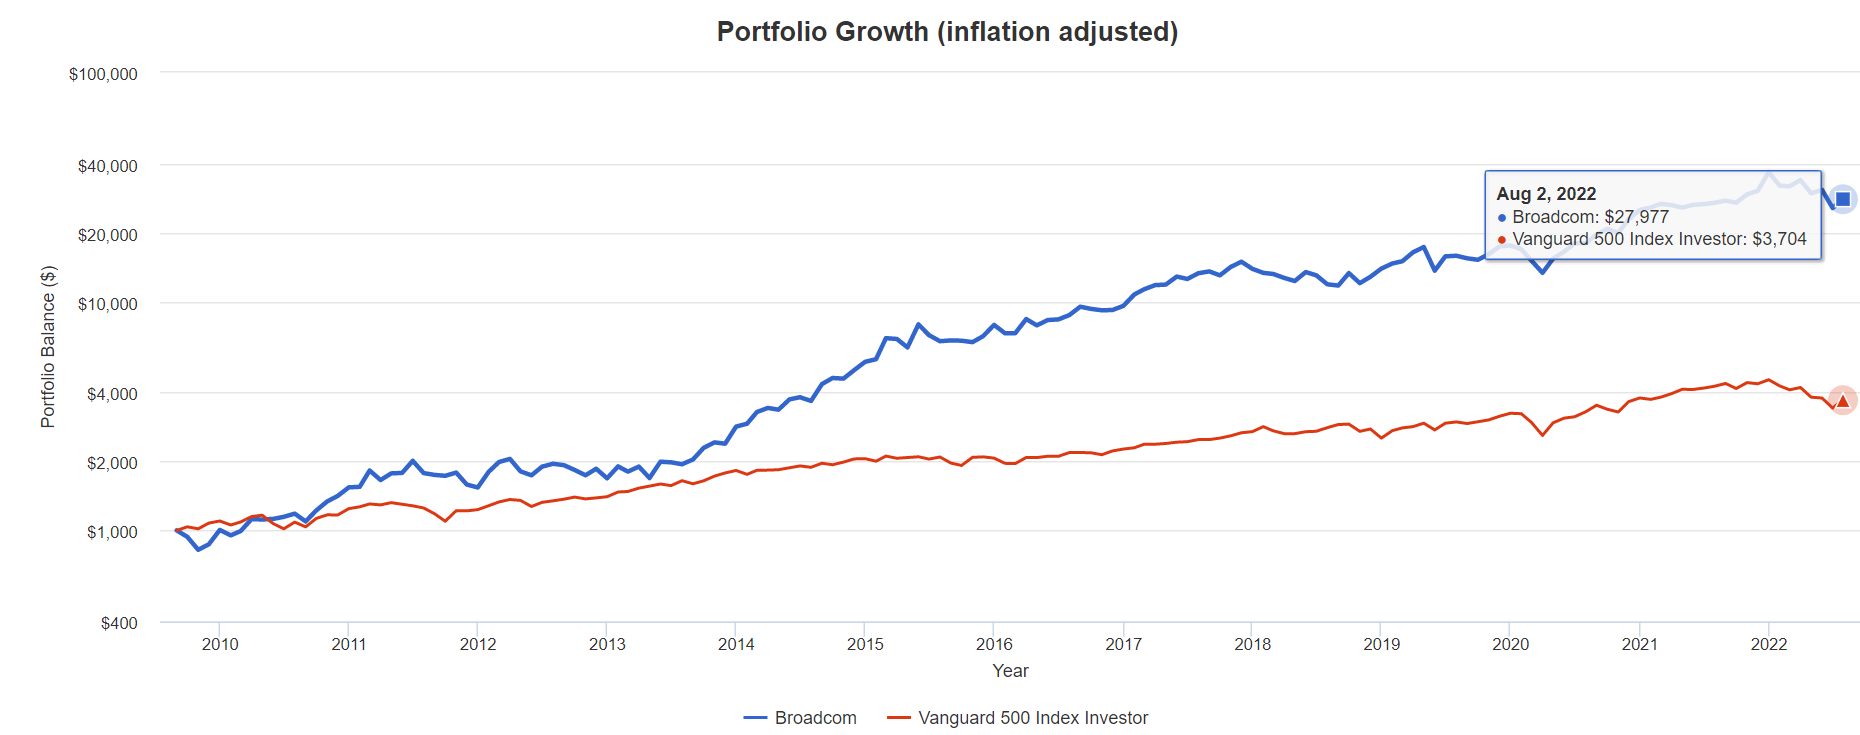
That’s 28X inflation-adjusted returns or nearly 7X more than the S&P 500.
A Dividend Growth Blue-Chip You Can Trust
(Source: Portfolio Visualizer Premium) – includes reinvested dividends in USD
| Portfolio | 2011 Income Per $1000 Investment | 2022 Income Per $1000 Investment | Annual Income Growth | Starting Yield |
2022 Yield On Cost |
| S&P 500 | $26 | $74 | 11.03% | 2.6% | 7.4% |
| Broadcom | $22 | $1,178 | 48.89% | 2.2% | 117.8% |
(Source: Portfolio Visualizer Premium)
AVGO has delivered 50% annual income growth over the last 11 years.
- about 5X faster income growth than the S&P 500
- a yield on cost of 118% today
AVGO Cumulative Dividends Since 2009 On $1,000 Initial Investment
| Total Dividends | $5,063 |
| Annualized Income Growth Rate | 48.89% |
| Total Income/Initial Investment | 5.06 |
| Inflation-Adjusted Income/Initial Investment | 3.70 |
(Source: Portfolio Visualizer Premium, Bureau Of Labor Statistics)
AVGO has recouped investors’ initial investments almost 4X over in just a decade, adjusted for inflation.
AVGO Consensus Future Income Growth Potential
| Analyst Consensus Income Growth Forecast | Risk-Adjusted Expected Income Growth | Risk And Tax-Adjusted Expected Income Growth |
Risk, Inflation, And Tax Adjusted Income Growth Consensus |
| 20.5% | 14.4% | 12.2% | 9.7% |
(Source: DK Research Terminal, FactSet)
Analysts think AVGO could deliver 21% annual income growth in the future, which, adjusted for the risk of the company not growing as expected, inflation, and taxes, is 9.7% real expected income growth.
Now compare that to what they expect from the S&P 500.
| Time Frame | S&P Inflation-Adjusted Dividend Growth | S&P Inflation-Adjusted Earnings Growth |
| 1871-2021 | 1.6% | 2.1% |
| 1945-2021 | 2.4% | 3.5% |
| 1981-2021 (Modern Falling Rate Era) | 2.8% | 3.8% |
| 2008-2021 (Modern Low Rate Era) | 3.5% | 6.2% |
| FactSet Future Consensus | 2.0% | 5.2% |
(Sources: S&P, FactSet, Multipl.com)
- 1.7% post-tax inflation-adjusted income growth from the S&P 500
- S&P 500’s historical post-tax inflation-adjusted income growth rate (current tax code) is 5.8% CAGR
What about a 60/40 retirement portfolio?
- 0.5% consensus inflation, risk, and tax-adjusted income growth.
In other words, AVGO could generate about 6X faster real income growth than the S&P 500 and 20X faster income growth than a 60/40.
- While you enjoy a nearly 2X higher yield growing at double-digits
What inflation-adjusted returns do analysts expect in the future?
Inflation-Adjusted Consensus Return Potential: $1,000 Initial Investment
| Time Frame (Years) | 7.7% CAGR Inflation-Adjusted S&P Consensus | 8.6% Inflation-Adjusted Aristocrat Consensus | 13.6% CAGR Inflation-Adjusted AVGO Consensus | Difference Between Inflation-Adjusted AVGO Consensus And S&P Consensus |
| 5 | $1,451.05 | $1,512.69 | $1,894.37 | $443.32 |
| 10 | $2,105.56 | $2,288.22 | $3,588.64 | $1,483.09 |
| 15 | $3,055.27 | $3,461.36 | $6,798.22 | $3,742.95 |
| 20 | $4,433.36 | $5,235.95 | $12,878.35 | $8,444.99 |
| 25 | $6,433.04 | $7,920.35 | $24,396.37 | $17,963.32 |
| 30 | $9,334.69 | $11,981.01 | $46,215.77 | $36,881.08 |
(Source: DK Research Terminal, FactSet) – ignoring starting valuation, which cancels out over 30+ years
Even if AVGO only grows as analysts expect for a decade, that’s potentially 3.6X inflation-adjusted returns.
| Time Frame (Years) | Ratio Aristocrats/S&P Consensus | Ratio Inflation-Adjusted AVGO Consensus vs. S&P consensus |
| 5 | 1.04 | 1.31 |
| 10 | 1.09 | 1.70 |
| 15 | 1.13 | 2.23 |
| 20 | 1.18 | 2.90 |
| 25 | 1.23 | 3.79 |
| 30 | 1.28 | 4.95 |
(Source: DK Research Terminal, FactSet)
That’s 70% more return potential than the S&P 500 and 60% better than the dividend aristocrats.
AVGO Investment Decision Score
DK
(Source: DK Automated Investment Decision Tool)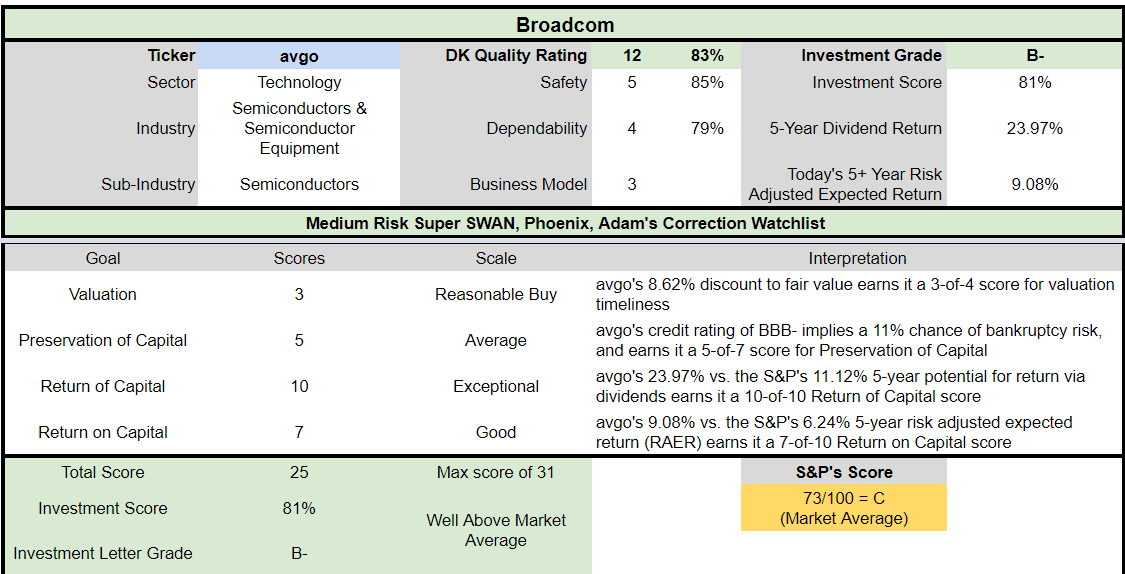
AVGO is a reasonable and prudent fast-growing high-yield tech option for anyone comfortable with its risk profile.
- 9% discount vs. 3% market premium = 12% better valuation
- 3.1% yield vs. 1.7% yield (and a much safer yield at that)
- 70% better consensus long-term return potential
- 33% better risk-adjusted expected return over the next five years
- 2X more consensus income than the S&P 500 over the next 5 years
Reason Two: Broadcom Is One Of The Highest Quality Companies On Earth
There are many ways to measure safety and quality, and I factor in nearly all of them.
The Dividend Kings’ overall quality scores are based on a 257-point model that includes:
-
Dividend safety
-
Balance sheet strength
-
Credit ratings
-
Credit default swap medium-term bankruptcy risk data
-
Short and long-term bankruptcy risk
-
Accounting and corporate fraud risk
-
Profitability and business model
-
Growth consensus estimates
-
Management growth guidance
-
Historical earnings growth rates
-
Historical cash flow growth rates
-
Historical dividend growth rates
-
Historical sales growth rates
-
Cost of capital
-
GF Scores
-
Morningstar business model uncertainty score
-
Long-term risk-management scores from MSCI, Morningstar, FactSet, S&P, Reuters’/Refinitiv, and Just Capital
-
Management quality
-
Dividend-friendly corporate culture/income dependability
-
Long-term total returns (a Ben Graham sign of quality)
-
Analyst consensus long-term return potential
It includes over 1,000 fundamental metrics, including the 12 rating agencies we use to assess fundamental risk.
-
credit and risk management ratings make up 41% of the DK safety, and quality model
-
dividend/balance sheet/risk ratings make up 82% of the DK safety and quality model
How do we know that our safety and quality model works well?
During the two worst recessions in 75 years, our safety model 87% of blue-chip dividend cuts, the ultimate baptism by fire for any dividend safety model.
How does AVGO score on our comprehensive safety and quality models?
AVGO Dividend Safety
| Rating | Dividend Kings Safety Score (165 Point Safety Model) | Approximate Dividend Cut Risk (Average Recession) | Approximate Dividend Cut Risk In Pandemic Level Recession |
| 1 – unsafe | 0% to 20% | over 4% | 16+% |
| 2- below average | 21% to 40% | over 2% | 8% to 16% |
| 3 – average | 41% to 60% | 2% | 4% to 8% |
| 4 – safe | 61% to 80% | 1% | 2% to 4% |
| 5- very safe | 81% to 100% | 0.5% | 1% to 2% |
| AVGO | 85% | 0.5% | 1.80% |
| Risk Rating | Medium-Risk (59th industry percentile risk-management consensus) | BBB- stable outlook credit rating 11% 30-year bankruptcy risk | 15% OR LESS Max Risk Cap Recommendation |
Long-Term Dependability
| Company | DK Long-Term Dependability Score | Interpretation | Points |
| Non-Dependable Companies | 21% or below | Poor Dependability | 1 |
| Low Dependability Companies | 22% to 60% | Below-Average Dependability | 2 |
| S&P 500/Industry Average | 61% (61% to 70% range) | Average Dependability | 3 |
| Above-Average | 71% to 80% | Very Dependable | 4 |
| Very Good | 81% or higher | Exceptional Dependability | 5 |
| AVGO | 79% | Very Dependable | 4 |
Overall Quality
| AVGO | Final Score | Rating |
| Safety | 85% | 5/5 very safe |
| Business Model | 90% | 3/3 wide and stable moat |
| Dependability | 79% | 4/5 very dependable |
| Total | 83% | 12/13 Super SWAN |
| Risk Rating |
3/5 Medium-Risk |
|
| 15% OR LESS Max Risk Cap Rec |
10% Margin of Safety For A Potentially Good Buy |
AVGO is the 179th highest quality company on the DK 500 Masterlist.
How significant is this? The DK 500 Master List is one of the world’s best watchlists, including
- every dividend aristocrat (S&P companies with 25+ year dividend growth streaks)
- every dividend champion (every company, including foreign, with 25+ year dividend growth streaks)
- every dividend king (every company with 50+ year dividend growth streaks)
- every foreign aristocrat (every company with 20+ year dividend growth streaks)
- every Ultra SWAN (wide moat aristocrats, as close to perfect quality companies as exist)
- 40 of the world’s best growth stocks
In other words, even among the world’s best companies, AVGO is higher quality than 64% of them, similar in quality to such aristocrats and Ultra SWANs as:
- British American Tobacco (BTI) – Ultra SWAN global aristocrat
- Brown-Forman (BF.B) – Ultra SWAN dividend aristocrat
- Becton, Dickinson and Company (BDX) – dividend aristocrat
- Canadian National Railway (CNI) – global aristocrat
- Bank of Nova Scotia (BNS)
Why I Trust Broadcom And So Can You
- 4 Reasons I Love Broadcom’s $61 Billion Deal And So Should You
- This article explains why the $61 billion VMware acquisition is likely great new for long-term income investors.
Broadcom traces its roots back to 1961, founded in San Jose, CA.
It’s the creation of Hock Tan, the Warren-Buffett of the chip industry, who has built an empire through aggressive but masterfully well-executed M&A.
(Source: investor presentation)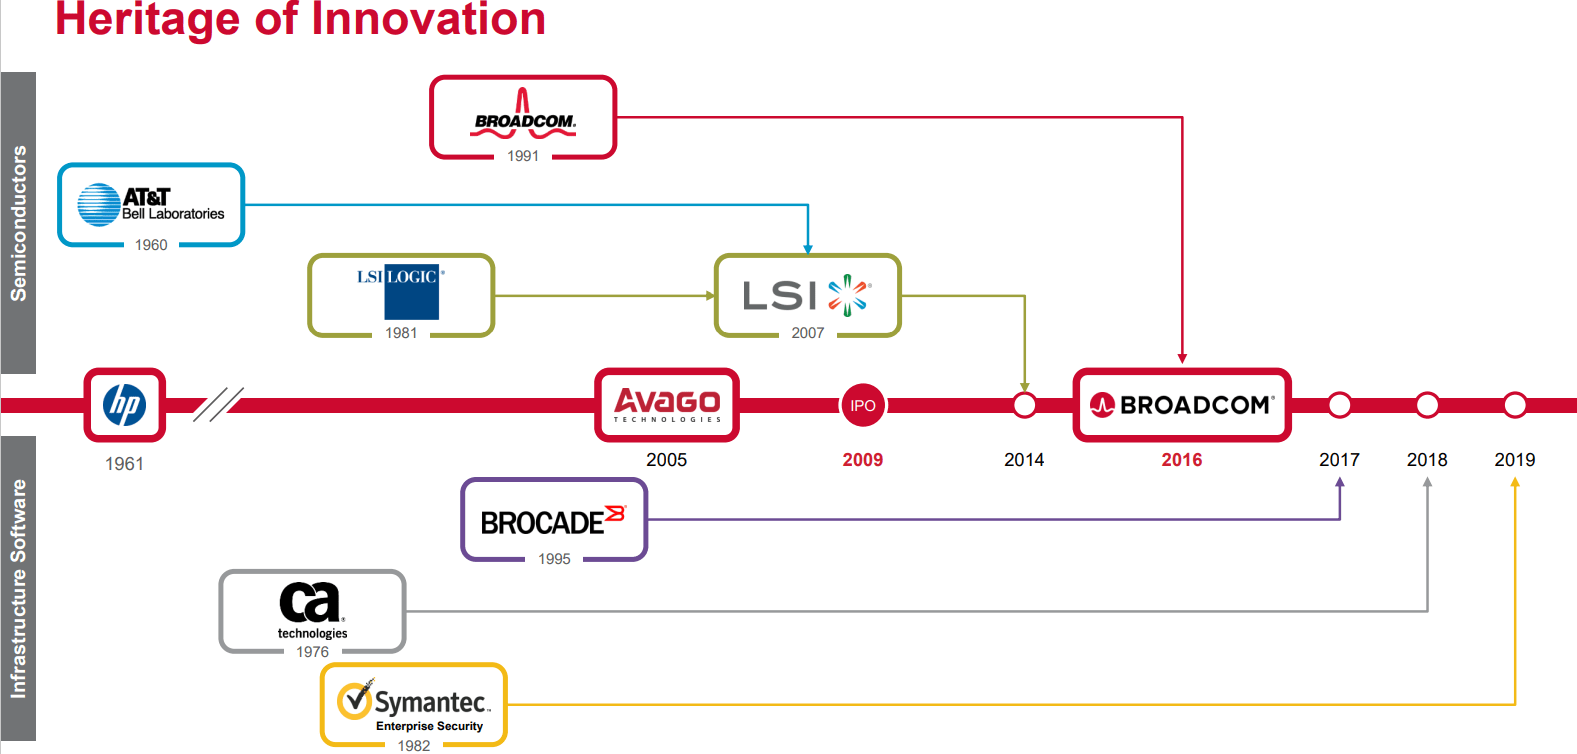
Broadcom has built an empire that includes chips and enterprise software, with a wide and stable moat protected by over 19,000 patents and almost $5 billion in annual R&D spending.
(Source: investor presentation)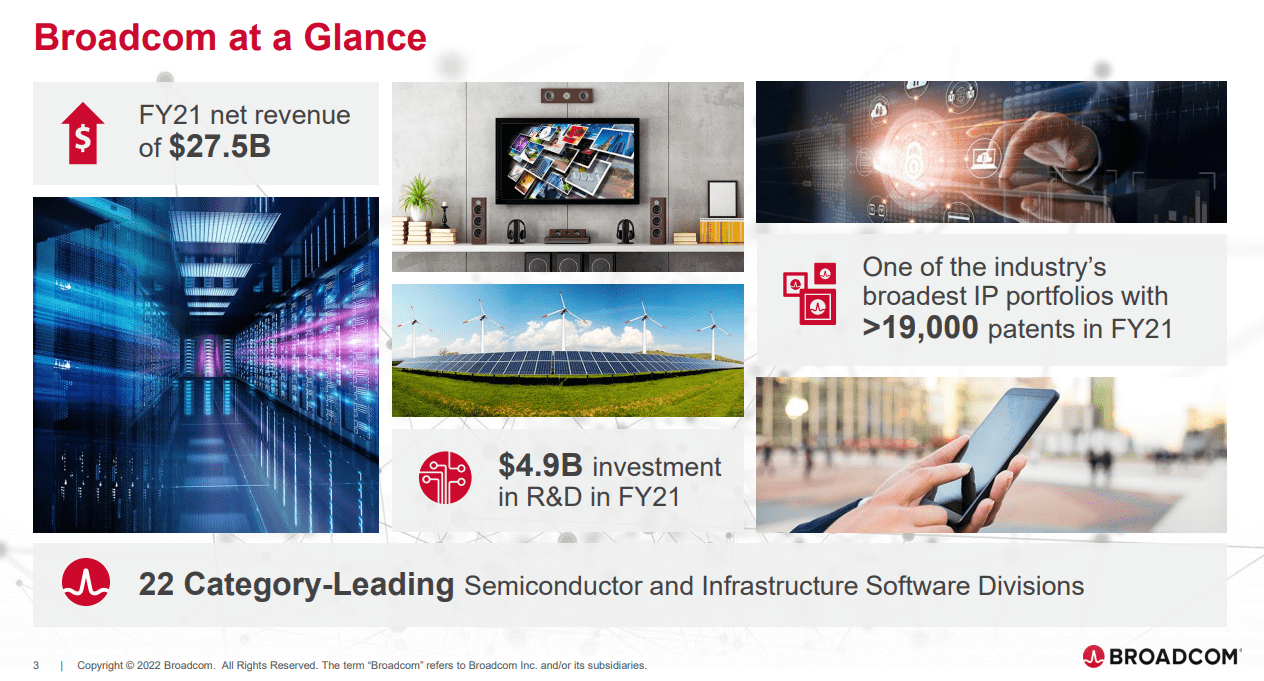
Broadcom is buying VMware to diversify its revenue into recurring software subscriptions and internationally.
Why Broadcom Is Buying VMWare
(Source: investor presentation)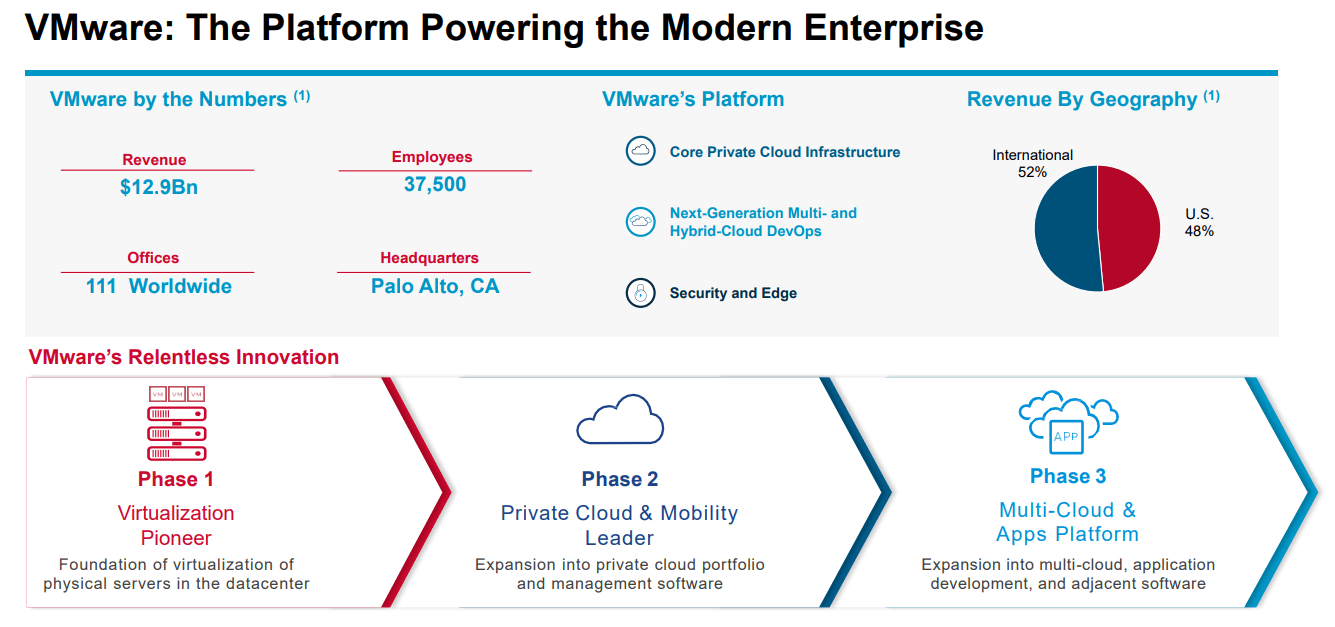
After the deal closes, 49% of sales at AVGO will be from recurring revenue infrastructure software.
- the most stable cash flow in the industry
AVGO gets 25% of sales from smartphones and is trying to diversify into all the best growth opportunities in tech.
- infrastructure software
- cloud computing
- AI
- 5G
- automation
These are the growth opportunities that lead management to guide for 10+% long-term EPS growth.
Broadcom’s policy is to pay out approximately 50% of FCF as dividends and use the remainder to pay down debt (from its many acquisitions) or buy back stock opportunistically.
(Source: investor presentation)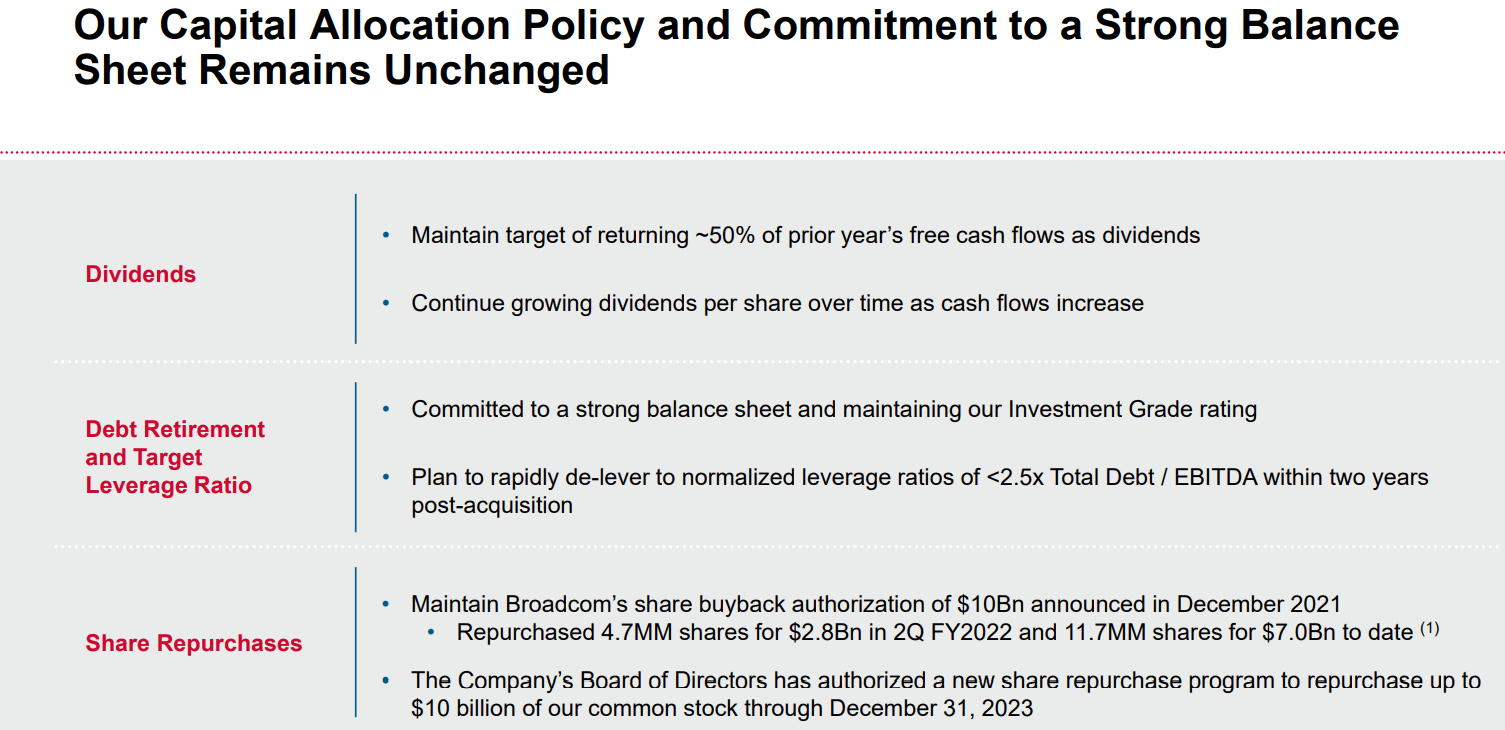
AVGO thinks it can get debt/EBITDA to under 2.5 within two years, similar to the deleveraging it achieved after buying CA Tech and Symantec.
(Source: investor presentation)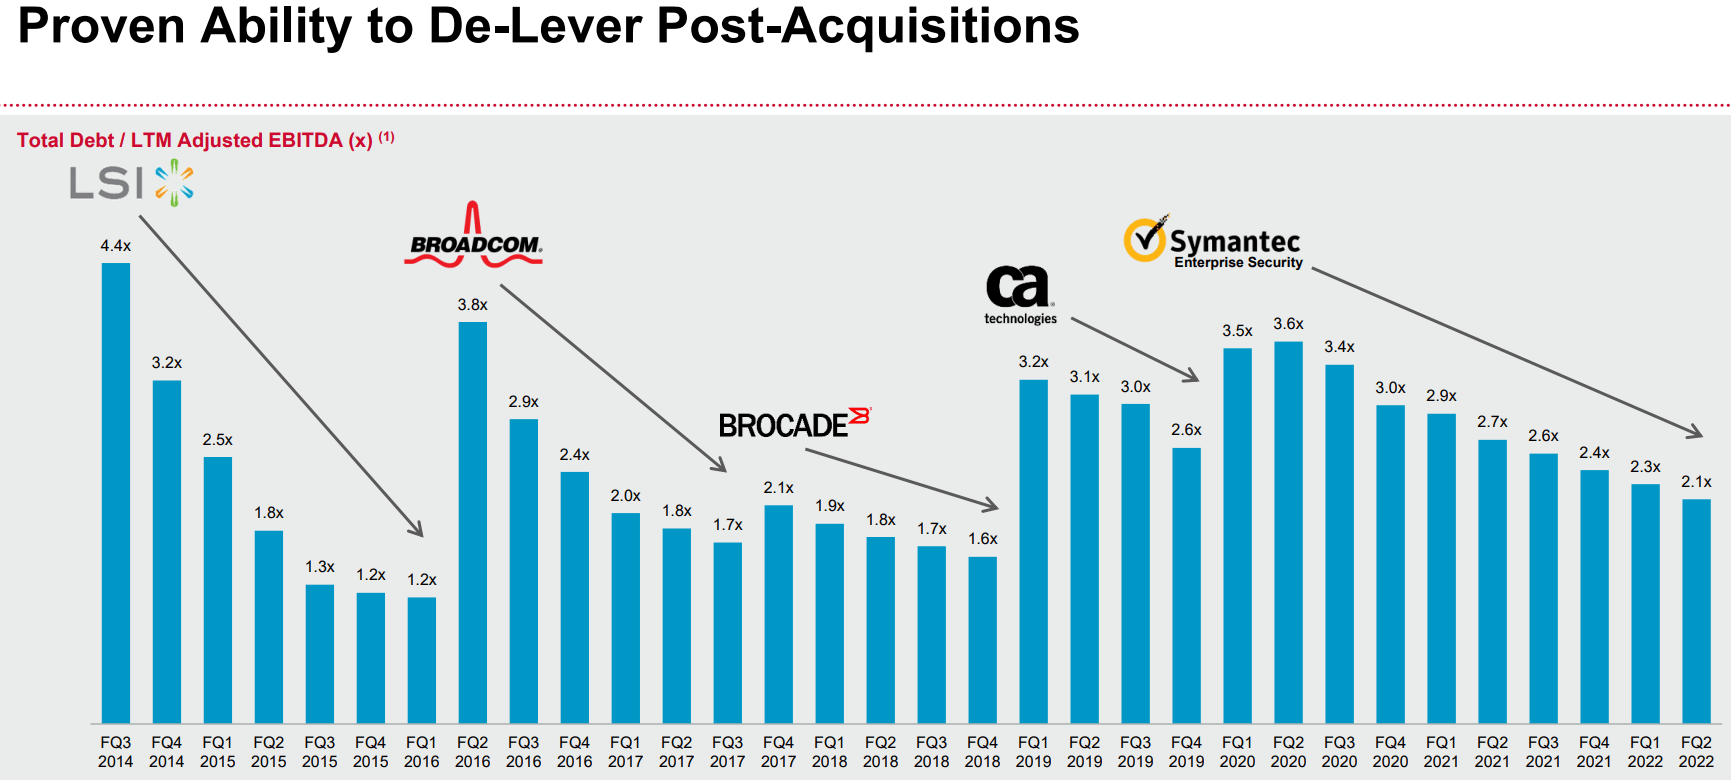
AVGO’s has an excellent track record of delivering on cost savings guidance and de-leveraging.
Quantitative Analysis: The Math Backing Up AVGO’s Investment Thesis
Ben Graham recommended combining qualitative (the story) analysis with quantitative analysis looking at the past, present, and likely future.
AVGO Credit Ratings
| Rating Agency | Credit Rating | 30-Year Default/Bankruptcy Risk | Chance of Losing 100% Of Your Investment 1 In |
| S&P | BBB- Positive Outlook | 11.00% | 9.1 |
| Fitch | BBB- Stable | 11.00% | 9.1 |
| Moody’s | Baa3 (BBB- equivalent) Stable Outlook | 11.00% | 9.1 |
| Consensus | BBB- Stable | 11.00% | 9.1 |
(Sources: S&P, Fitch, Moody’s)
S&P expects AVGO to continue acquiring software companies in the future and will determine whether or not AVGO deserves a BBB credit rating within a few months.
- The fundamental risk would then fall to 7.5%
AVGO Leverage Consensus Forecast (Not Including VMW Acquisition)
| Year | Debt/EBITDA | Net Debt/EBITDA (1.5 Or Less Safe According To Credit Rating Agencies) |
Interest Coverage (8+ Safe) |
| 2020 | 2.98 | 2.45 | 8.05 |
| 2021 | 2.40 | 1.66 | 9.70 |
| 2022 | 1.92 | 1.44 | 12.10 |
| 2023 | 1.76 | 1.16 | 13.08 |
| 2024 | 1.70 | 1.17 | 12.81 |
| Annualized Change | -13.05% | -16.79% | 12.32% |
(Source: FactSet Research Terminal)
Had AVGO not purchased VMW, analysts expect a safe leverage level by the end of fiscal 2022 (just in time to buy VMW).
AVGO Balance Sheet Consensus Forecast
(Not Including VMW Acquisition)
| Year | Total Debt (Millions) | Cash | Net Debt (Millions) | Interest Cost (Millions) | EBITDA (Millions) | Operating Income (Millions) |
| 2020 | $40,649 | $7,618 | $33,444 | $1,608 | $13,643 | $12,939 |
| 2021 | $39,730 | $12,163 | $27,567 | $1,640 | $16,571 | $15,912 |
| 2022 | $38,591 | $10,352 | $28,884 | $1,660 | $20,054 | $20,080 |
| 2023 | $37,041 | $14,534 | $24,448 | $1,637 | $21,062 | $21,414 |
| 2024 | $37,544 | $13,576 | $25,908 | $1,695 | $22,050 | $21,711 |
| Annualized Growth | -1.97% | 15.54% | -6.18% | 1.33% | 12.75% | 13.81% |
(Source: FactSet Research Terminal)
Pre-acquisition AVGO’s debt levels are falling modestly, its cash is rising at 16% per year, and net debt is falling almost 6% annually while cash flow grows at 13% yearly.
AVGO Bond Profile
(Source: FactSet Research Terminal) (Source: FactSet Research Terminal)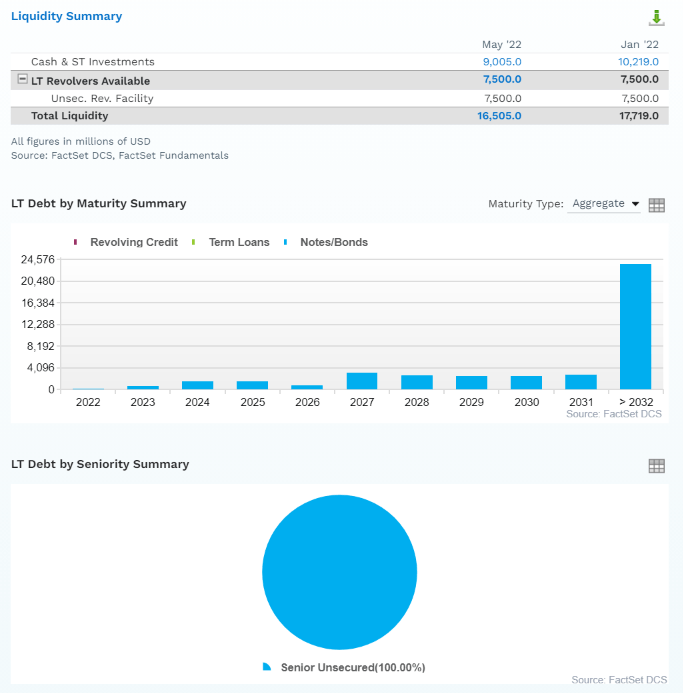
- $16.5 billion in liquidity
- 100% unsecured bonds (maximum financial flexibility)
- well-staggered bond maturities, no trouble refinancing maturing debt
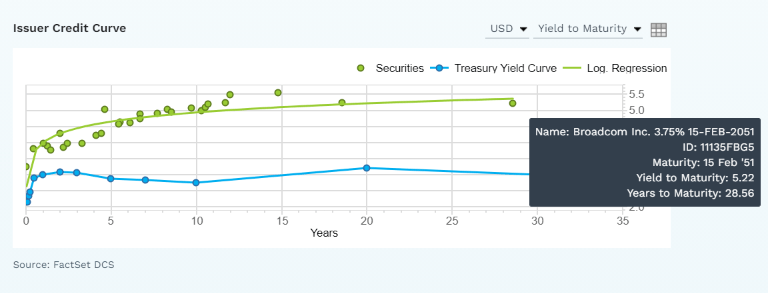
- bond market willing to lend to AVGO for 29 years at 5.2% (3.75% originally)
- 5.25% average borrowing cost vs. bond market’s 2.47% long-term inflation forecast
- AVGO’s effective real interest rate is 2.78% vs. 17% return on invested capital
AVGO Credit Default SWAP Spreads: Bond Market’s Real-Time Fundamental Risk Assessment
(Source: FactSet Research Terminal)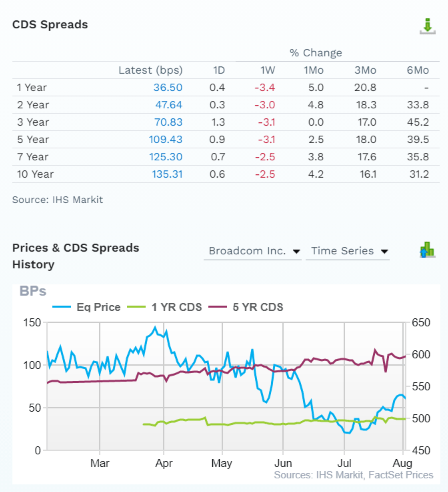
Credit default swaps are insurance against bond defaults and thus represent a real-time bond market estimate of a company’s short and medium-term bankruptcy risk.
AVGO’s CDS has been relatively stable over the last six months.
- even when AVGO’s price collapsed in the bear market
The bond market treats AVGO as if it were already a BBB+ rated company.
- 4.05% 30-year default risk
The bond market agrees with management, analysts, and rating agencies that the investment thesis is intact.
AVGO GF Score: The Newest Addition To The DK Safety And Quality Model
The GF Score is a ranking system that has been found to be closely correlated to the long-term performances of stocks by backtesting from 2006 to 2021.” – Gurufocus
GF Score considers five key aspects. They are:
- Financial Strength
- Profitability
- Growth
- Valuation
- Momentum
(Source: Gurufocus Premium)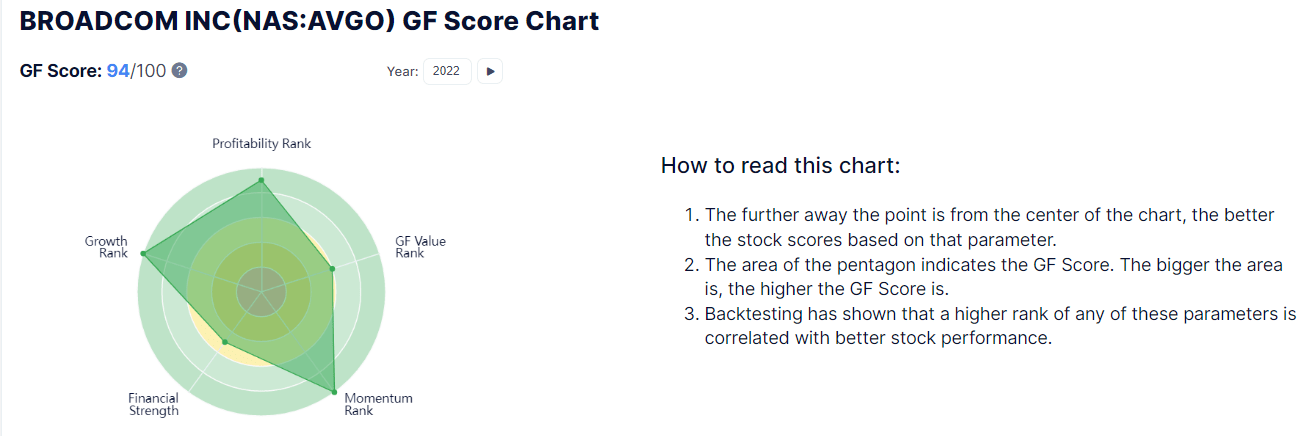
AVGO’s excellent 94/100 GF score confirms its quality and investment thesis.
Profitability: Wall Street’s Favorite Quality Proxy
AVGO Profitability
(Source: Gurufocus Premium)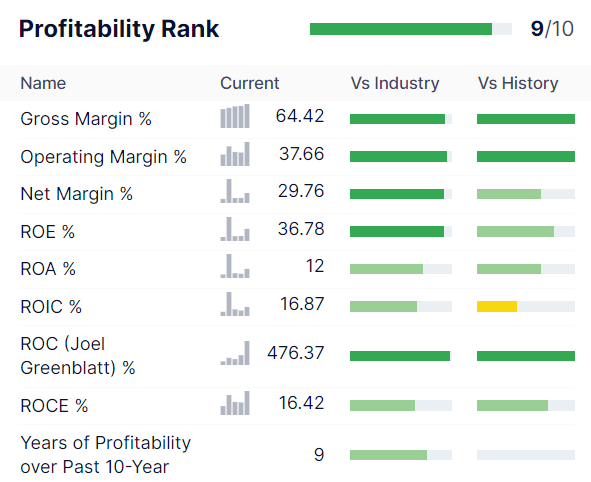
AVGO’s profitability is historically in the top 10% of its peers.
AVGO Trailing 12-Month Profitability Vs. Peers
| Metric | TTM | Industry Percentile | Major Semiconductor Companies providers More Profitable Than AVGO (Out Of 913) |
| Gross Margins | 64.42% | 93.48 | 60 |
| Operating Margin | 37.66% | 95.33 | 43 |
| Net Margin | 29.76% | 92.33 | 70 |
| Return On Equity | 36.78% | 91.84 | 75 |
| Return On Assets | 12.00% | 71.41 | 261 |
| Returns On Invested Capital | 16.87% | 65.13 | 318 |
| Return On Capital (Greenblatt) | 476.37% | 94.46 | 51 |
| Return On Capital Employed | 16.42% | 63.76 | 331 |
| Average | 86.29% | 83.47 | 151 |
(Source: Gurufocus Premium)
Profitability in the last year was in the top 16% of peers.
AVGO Margin Consensus Forecast
| Year | FCF Margin | EBITDA Margin | EBIT (Operating) Margin | Net Margin | Return On Capital Expansion |
Return On Capital Forecast |
| 2020 | 48.6% | 57.1% | 54.2% | 41.8% | 1.05 | |
| 2021 | 48.5% | 60.4% | 58.0% | 45.8% | TTM ROC | 476.37% |
| 2022 | 50.7% | 61.1% | 61.1% | 49.5% | Latest ROC | 430.20% |
| 2023 | 52.5% | 60.6% | 61.6% | 49.9% | 2025 ROC | 500.00% |
| 2024 | 53.4% | 61.8% | 60.8% | 53.0% | 2025 ROC | 451.54% |
| 2025 | NA | NA | NA | NA | Average | 475.77% |
| 2026 | NA | NA | NA | NA | Industry Median | 8.53% |
| 2027 | NA | NA | NA | NA | AVGO/Industry Median | 55.78 |
| Annualized Growth | 2.43% | 1.99% | 2.95% | 6.08% | Vs. S&P | 32.59 |
| Annualized Growth (Post Pandemic) | 3.27% | 0.78% | 1.63% | 4.96% |
(Source: FactSet Research Terminal)
Broadcom is one of the world’s most profitable companies, and margins are expected to keep rising through 2024.
That includes 53% FCF margins and 53% net margins.
Returns on capital are expected to approach 500%.
- 33X more than the S&P 500
- 56X more than the median chip maker
ROC is the annual pre-tax profit/the cost of running the business.
- Joel Greenblatt’s gold standard for quality and moatiness
- confirms AVGO’s wide and stable moat
Reason Three: Strong Growth Prospects As Far As The Eye Can See
Broadcom has delivered incredible growth for a decade, and future growth rates are expected to be lower but still very impressive.
AVGO Medium-Term Growth Consensus Forecast
| Year | Sales | Free Cash Flow | EBITDA | EBIT (Operating Income) | Net Income |
| 2020 | $23,888 | $11,598 | $13,643 | $12,939 | $9,993 |
| 2021 | $27,450 | $13,321 | $16,571 | $15,912 | $12,578 |
| 2022 | $32,848 | $16,647 | $20,054 | $20,080 | $16,244 |
| 2023 | $34,744 | $18,226 | $21,062 | $21,414 | $17,353 |
| 2024 | $35,684 | $19,070 | $22,050 | $21,711 | $18,906 |
| Annualized Growth | 10.55% | 13.24% | 12.75% | 13.81% | 17.28% |
| Annualized Growth (Post Pandemic) | 9.14% | 12.70% | 9.99% | 10.91% | 14.55% |
| Cumulative Next 3 Years | $103,276 | $53,943 | $63,166 | $63,205 | $52,503 |
(Source: FactSet Research Terminal)
AVGO’s growth outside the pandemic is expected to be 9% top line and 10% to 15% bottom line.
- $54 billion in free cash flow over the next three years
- 103% of net income converted to free cash flow
- an excellent cash conversion ratio
- confirming excellent management
- and reduced fraud risk
- and a very safe dividend
AVGO Dividend Growth/Buy Back Potential Consensus Forecast (No VMW Acquisition)
| Year | Dividend Consensus | FCF/Share Consensus | FCF Payout Ratio | Retained (Post-Dividend) Free Cash Flow | Buyback Potential | Debt Repayment Potential |
| 2022 | $16.39 | $37.38 | 43.8% | $8,522 | 3.99% | 22.1% |
| 2023 | $18.32 | $40.77 | 44.9% | $9,115 | 4.26% | 24.6% |
| 2024 | $19.30 | $41.29 | 46.7% | $8,928 | 4.18% | 24.1% |
| Total 2022 Through 2025 | $54.01 | $119.44 | 45.2% | $26,564.58 | 12.43% | 71.72% |
| Annualized Rate | 8.5% | 5.1% | 3.2% | 2.4% | 2.4% | 4.5% |
(Source: FactSet Research Terminal)
For chipmakers’ rating, agencies like to see less than 50% FCF payout ratios, and AVGO’s policy is 50%.
Through 2024 it’s expected to payout 45% of FCF, retaining $27 billion in post dividend free cash flow, enough to pay off 72% of current debt or buyback up to 12% of shares at current valuations.
AVGO Buy Back Consensus Forecast
| Year | Consensus Buybacks ($ Millions) | % Of Shares (At Current Valuations) | Market Cap |
| 2022 | $3,504 | 1.6% | $213,763 |
| 2023 | $1,999 | 0.9% | $213,763 |
| Total 2022 through 2023 | $5,503 | 2.6% | $213,763 |
| Annualized Rate | 1.16% | Average Annual Buybacks | $2,752 |
(Source: FactSet Research Terminal)
AVGO is expected to pull back on buybacks next year as it deleverages from buying VMWare. But it’s now large enough to keep buying back stock even after a major M&A deal.
Ycharts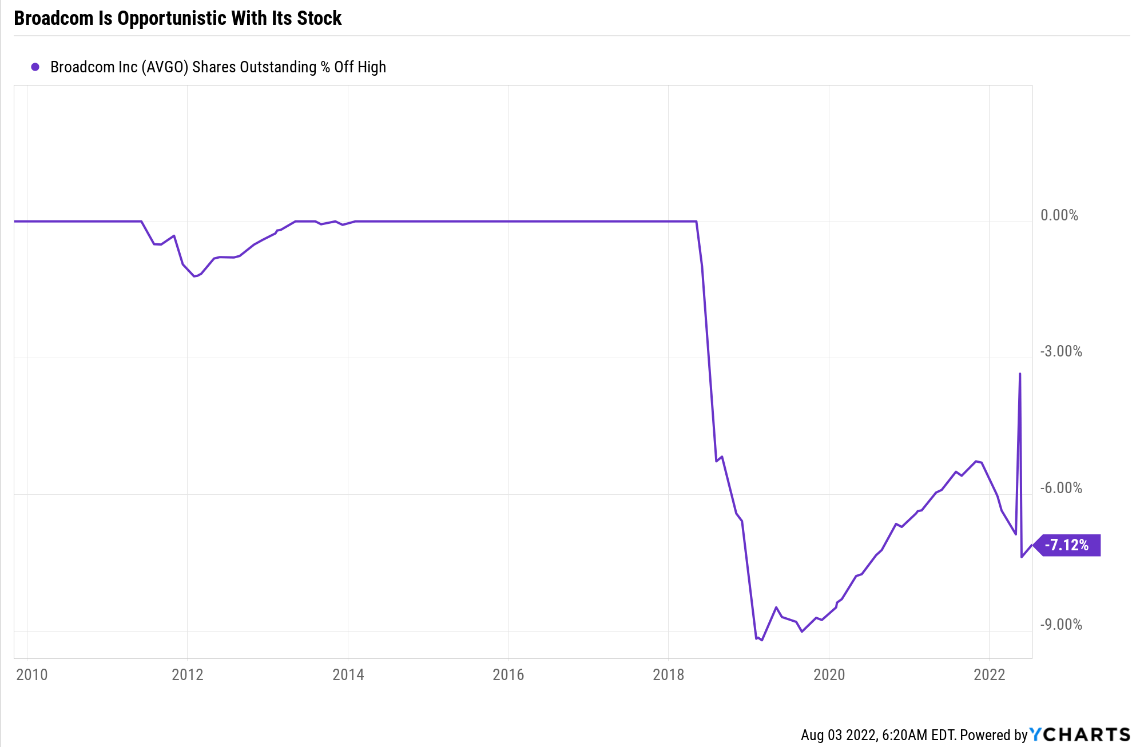
AVGO sometimes will issue many shares (as with VMW) and buy back stock up to 9% per year.
| Time Frame (Years) | Net Buyback Rate | Shares Remaining | Net Shares Repurchased | Each Share You Own Is Worth X Times More (Not Including Future Growth And Dividends) |
| 5 | 1.2% | 94.33% | 5.67% | 1.06 |
| 10 | 1.2% | 88.99% | 11.01% | 1.12 |
| 15 | 1.2% | 83.94% | 16.06% | 1.19 |
| 20 | 1.2% | 79.19% | 20.81% | 1.26 |
| 25 | 1.2% | 74.70% | 25.30% | 1.34 |
| 30 | 1.2% | 70.47% | 29.53% | 1.42 |
(Source: FactSet Research Terminal)
If AVGO buys back stock as analysts expect, it could reduce the unit count by 30% over the next 30 years.
- increasing the intrinsic value of its shares by 42%
- ignoring future dividend and earnings growth
AVGO Long-Term Growth Outlook
(Source: Reuters, Yahoo Finance)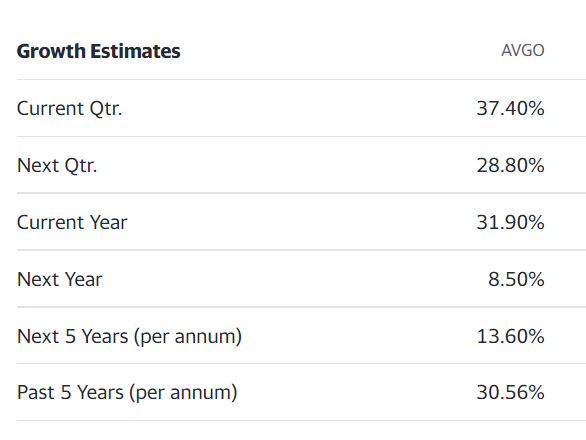
- 12-year growth rate: 36.66% CAGR
- management guidance: 10+%
- Reuters’ consensus from 22/26 analysts: 13.6%
- range: 13.6% to 23.1%
How accurate are analysts at forecasting AVGO’s growth over time?
FAST Graphs, FactSet Research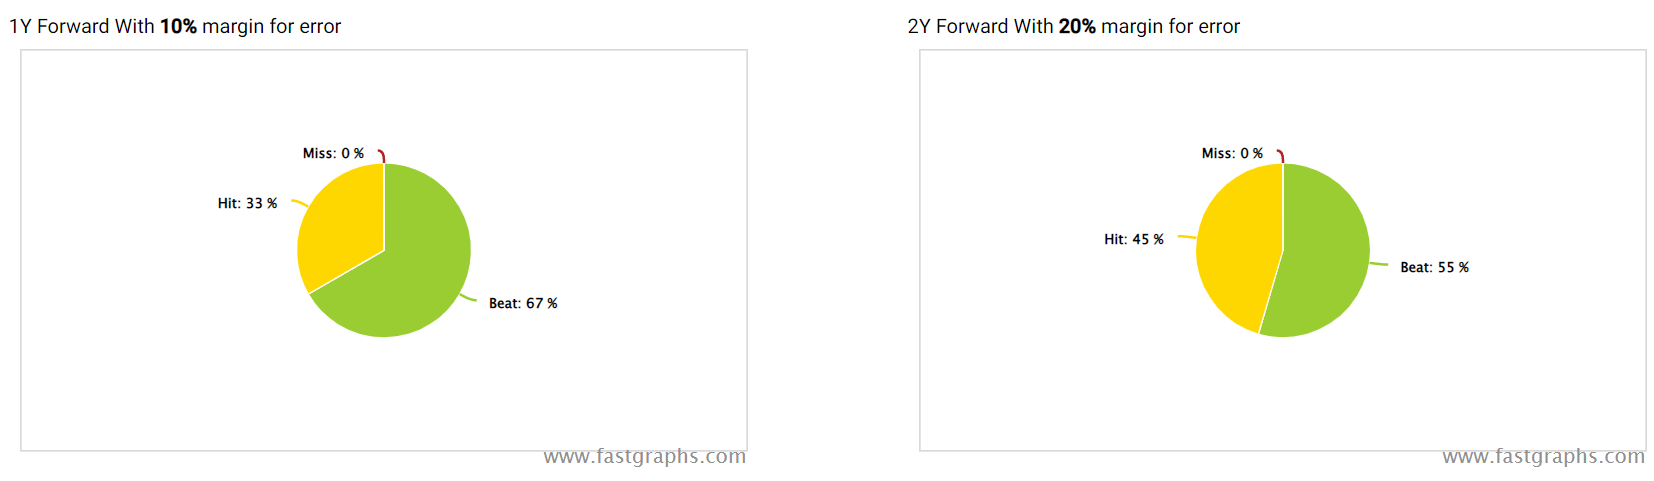
FAST Graphs, FactSet Research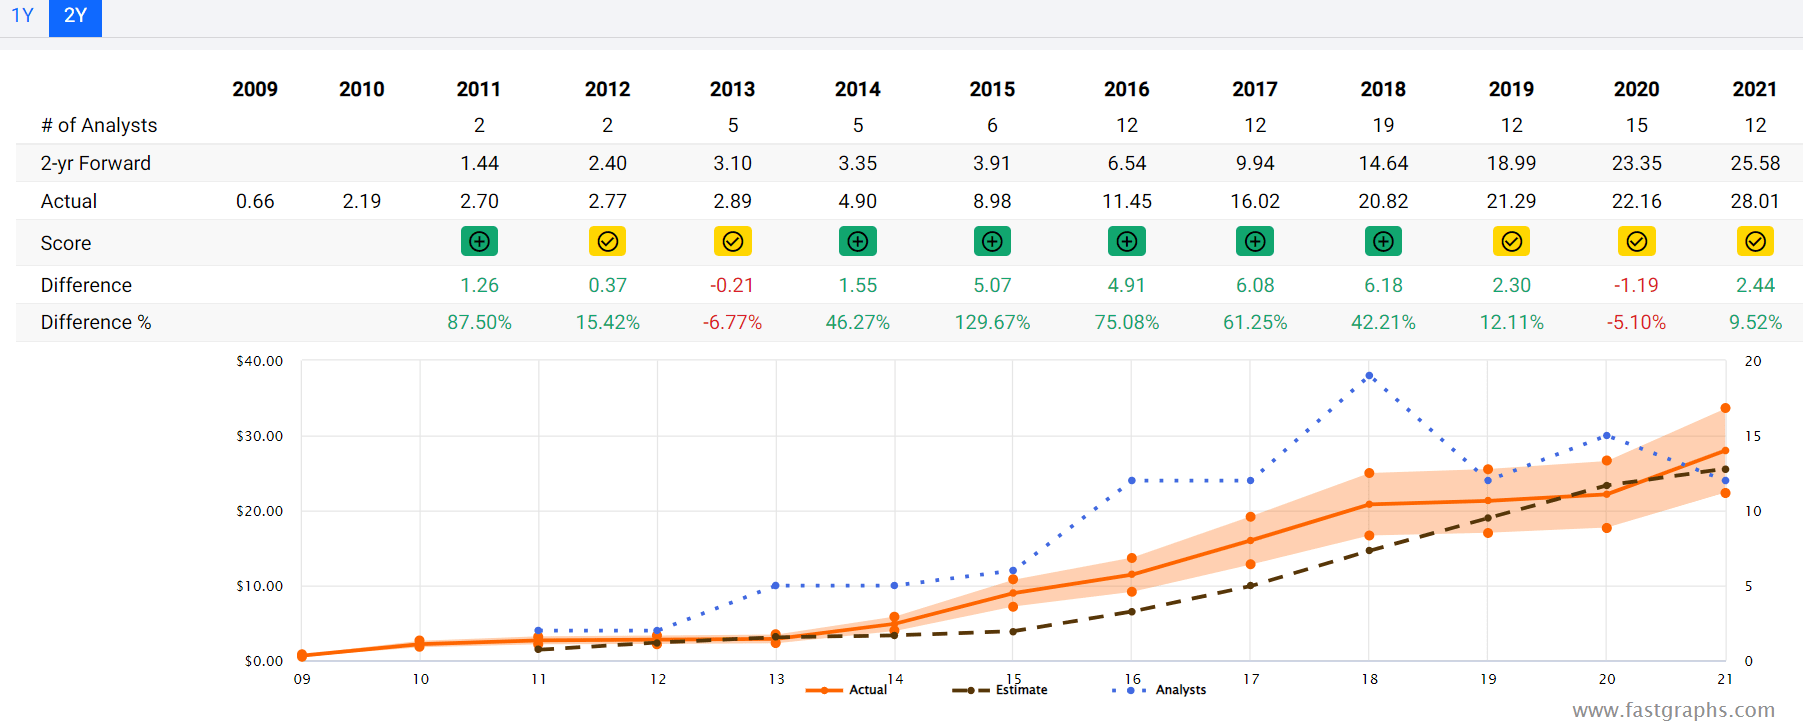
Smoothing for outliers, the historical analyst margins of error are 5% to the downside and 10% to the upside (in recent years).
- historical margin-of-error adjusted growth consensus range of 10% to 26% (including management guidance range)
- 70% statistical probability AVGO grows 10% to 26% over time
FAST Graphs, FactSet Research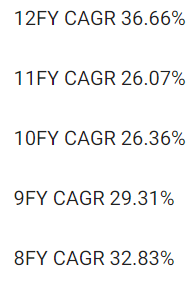
FAST Graphs, FactSet Research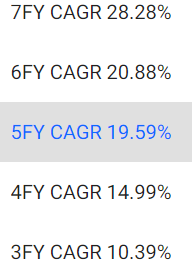
FAST Graphs, FactSet Research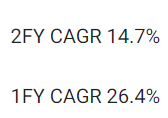
AVGO’s growth rates have ranged from 10% to 36% over the last 12 years, and analysts expect growth over the next few years to be similar to the last four years.
Reason Four: Growth At A Reasonable Price
(Source: FAST Graphs, FactSet)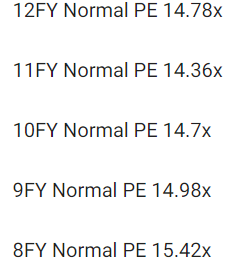
Historically AVGO is worth 14.5X to 15.5X earnings, and its market-determined fair value PE has been rising steadily as software becomes a larger part of the business.
| Metric | Historical Fair Value Multiples (all-year) | 2021 | 2022 | 2023 | 2024 |
12-Month Forward Fair Value |
| Earnings | 14.78 | $436.16 | $554.25 | $599.62 | $631.40 | |
| Average | $436.16 | $554.25 | $599.62 | $631.40 | $581.30 | |
| Current Price | $531.21 | |||||
|
Discount To Fair Value |
-21.79% | 4.16% | 11.41% | 15.87% | 8.62% | |
|
Upside To Fair Value (NOT Including Dividends) |
-17.89% | 4.34% | 12.88% | 18.86% | 9.43% (13% including dividend) | |
| 2022 EPS | 2023 EPS | 2022 Weighted EPS | 2023 Weighted EPS | 12-Month Forward EPS | 12-Month Average Fair Value Forward PE |
Current Forward PE |
| $37.50 | $40.57 | $15.14 | $24.19 | $39.33 | 14.8 | 13.5 |
I estimate AVGO is worth about 15X earnings and today trades at 13.5X.
- 12.5X cash-adjusted earnings
- a PEG of 0.91
- growth at a reasonable price
|
Analyst Median 12-Month Price Target |
Morningstar Fair Value Estimate |
| $678.32 (17.3 PE) | $624.00 (15.7 PE) |
|
Discount To Price Target (Not A Fair Value Estimate) |
Discount To Fair Value |
| 21.69% | 14.87% |
|
Upside To Price Target (Not Including Dividend) |
Upside To Fair Value (Not Including Dividend) |
| 27.69% | 17.47% |
|
12-Month Median Total Return Price (Including Dividend) |
Fair Value + 12-Month Dividend |
| $694.72 | $640.40 |
|
Discount To Total Price Target (Not A Fair Value Estimate) |
Discount To Fair Value + 12-Month Dividend |
| 23.54% | 17.05% |
|
Upside To Price Target ( Including Dividend) |
Upside To Fair Value + Dividend |
| 30.78% | 20.55% |
As AVGO’s revenue becomes majority recurring software sales, its multiple is likely to expand. Thus Morningstar’s fair value estimate of 15.7X earnings isn’t outlandish.
Analysts expecting 17.3X earnings within a year is likely a tad bullish but also not crazy.
AVGO’s fundamentally justified 12-month total return potential is 13%.
- What you’d make if AVGO grows as expected and returns to its historical fair value within 12 months
I don’t recommend companies based on 12-month forecasts but on the margin of safety and whether or not it sufficiently compensates you for a company’s risk profile.
Margin Of Safety Not 12-Month Price Targets Are How I Make Investment Decisions
| Rating | Margin Of Safety For Medium-Risk 12/13 Quality Super SWANs | 2022 Fair Value Price | 2023 Fair Value Price |
12-Month Forward Fair Value |
| Potentially Reasonable Buy | 0% | $554.25 | $599.62 | $581.30 |
| Potentially Good Buy | 10% | $498.83 | $539.66 | $523.17 |
| Potentially Strong Buy | 20% | $443.40 | $479.70 | $465.04 |
| Potentially Very Strong Buy | 30% | $349.18 | $419.74 | $406.91 |
| Potentially Ultra-Value Buy | 40% | $332.55 | $359.77 | $348.78 |
| Currently | $531.21 | 4.16% | 11.41% | 8.62% |
| Upside To Fair Value (Not Including Dividends) | 4.34% | 12.88% | 9.43% |
For anyone comfortable with its risk profile AVGO are a potentially reasonable buy and just 1% above its potential good buy price.
Risk Profile: Why Broadcom Isn’t Right For Everyone
There are no risk-free companies, and no company is right for everyone. You have to be comfortable with the fundamental risk profile.
What Could Cause AVGO’s Investment Thesis To Break
- safety falls to 40% or less
- balance sheet collapses (approximately 11% or less probability according rating agencies)
- a major botched acquisition
- growth outlook falls to less than 6.9% for six years
- AVGO’s role in my portfolio is to deliver long-term 10+% returns with minimal fundamental risk
- 8+% total return requirement for defensive sectors (including healthcare)
- 10+% for non-defensive (cyclical) sectors
How long it takes for a company’s investment thesis to break depends on the quality of the company.
| Quality |
Years For The Thesis To Break Entirely |
| Below-Average | 1 |
| Average | 2 |
| Above-Average | 3 |
| Blue-Chip | 4 |
| SWAN | 5 |
| Super SWAN | 6 |
| Ultra SWAN | 7 |
| 100% Quality Companies (MSFT, LOW, and MA) | 8 |
These are my rule of thumb for when to sell a stock if the investment thesis has broken. AVGO is highly unlikely to suffer such catastrophic declines in fundamentals.
AVGO Risk Profile Summary
- chip industry cyclicality (economically sensitive)
- regulatory/political risk (in terms of future M&A deal approvals)
- customer concentration risk: 20% of sales from Apple pre-VMW acquisition
- M&A risk: VMware is the largest deal so far (and not the last)
- M&A execution risk: cost-cutting could go too far
- labor retention risk (tightest job market in over 50 years)
- supply chain risk: disruptions during the last year
- currency risk: 81% of sales outside the US
How do we quantify, monitor, and track such a complex risk profile? By doing what big institutions do.
Long-Term Risk Analysis: How Large Institutions Measure Total Risk
- see the risk section of this video to get an in-depth view (and link to two reports) of how DK and big institutions measure long-term risk management by companies
AVGO Long-Term Risk-Management Consensus
| Rating Agency | Industry Percentile |
Rating Agency Classification |
| MSCI 37 Metric Model | 69.0% |
BBB Average, Positive Trend |
| Morningstar/Sustainalytics 20 Metric Model | 75.2% |
22.4/100 Medium Risk |
| Reuters’/Refinitiv 500+ Metric Model | 93.1% | Excellent |
| S&P 1,000+ Metric Model | 21.0% |
Poor, Stable Trend |
| Just Capital 19 Metric Model | 58.1% | Average |
| FactSet | 10.0% |
Industry Laggard, Stable Trend |
| Morningstar Global Percentile (All 15,000 Rated Companies) | 66.9% | Above-Average |
| Just Capital Global Percentile (All 954 Rated US Companies) | 75.5% | Good |
| Consensus | 59% |
Medium-Risk, Above-Average Risk-Management, Stable Trend |
(Sources: MSCI, Morningstar, FactSet, S&P, Reuters, Just Capital)
AVGO’s Long-Term Risk Management Is The 299st Best In The Master List (40th Percentile)
| Classification | Average Consensus LT Risk-Management Industry Percentile |
Risk-Management Rating |
| S&P Global (SPGI) #1 Risk Management In The Master List | 94 | Exceptional |
| Strong ESG Stocks | 78 |
Good – Bordering On Very Good |
| Foreign Dividend Stocks | 75 | Good |
| Ultra SWANs | 71 | Good |
| Low Volatility Stocks | 68 | Above-Average |
| Dividend Aristocrats | 67 | Above-Average |
| Dividend Kings | 63 | Above-Average |
| Master List average | 62 | Above-Average |
| Hyper-Growth stocks | 61 | Above-Average |
| Monthly Dividend Stocks | 60 | Above-Average |
| Broadcom | 59 | Average bordering on above-average |
| Dividend Champions | 57 | Average bordering on above-average |
(Source: DK Research Terminal)
AVGO’s risk-management consensus is in the bottom 40% of the world’s highest quality companies and similar to that of such other blue-chips as
- Raytheon (RTX) – dividend champion
- Church & Dwight (CHD) – dividend aristocrat
- Carlisle Companies (CSL) – dividend champion
- Polaris (PII) – dividend champion
- Altria (MO) – dividend king
- Costco (COST)
The bottom line is that all companies have risks, and AVGO is average, bordering on above-average at managing theirs.
How We Monitor AVGO’s Risk Profile
- 26 analysts
- 3 credit rating agencies
- 7 total risk rating agencies
- 33 experts who collectively know this business better than anyone other than management
- and the bond market for real-time fundamental risk-assessment when news breaks
When the facts change, I change my mind. What do you do, sir?” – John Maynard Keynes
There are no sacred cows at iREIT or Dividend Kings. Wherever the fundamentals lead, we always follow. That’s the essence of disciplined financial science, the math behind retiring rich and staying rich in retirement.
Bottom Line: Buy Broadcom Today And Your Retirement Will Thank You
My goal isn’t to make you 30% in a year or double your money in five years, though Broadcom could potentially do both, according to analysts.
My goal is to help you learn how to invest better, so you can potentially earn 10X, 20X, or even 30X inflation-adjusted returns over a 30-year retirement time frame.
Let the speculators and gamblers take extreme risks to potentially earn a 2X or 5X return quickly. I’m trying to teach you to retire rich and get steadily richer in retirement, no matter how long you live.
While I can’t predict the market in the short-term here’s what I can tell you about AVGO:
- AVGO is one of the world’s safest, most dependable, and highest quality companies on earth
- top 36% of the world’s best companies
- 3.1% very safe yield and about 9% dividend growth through 2024
- 16.7% CAGR long-term total return potential, better than the Nasdaq, aristocrats, or S&P 500
- 9% historically undervalued, a potentially reasonable buy, growth at a reasonable price
- 12.5X cash-adjusted earnings, a PEG of 0.91
- 95% consensus return potential over the next five years, 14% CAGR, 2X more than the S&P 500
- 30% better risk-adjusted expected returns of the S&P 500 over the next five years.
- 2X higher consensus income over the next five years
Within a diversified and prudently risk-managed portfolio, Broadcom could change your life.
This is one of the planet’s highest quality high-yield tech dividend growth stocks. It’s run by the Warren Buffett of the chip industry, Hock Tan, a mad genius whose ability to put together and execute smart deals has made investors fabulously rich.
Today management says anyone buying AVGO for the long-term can expect 13.1+% long-term returns. Analysts think 16.7% returns are likely.
Even the more conservative forecast is significantly better than the S&P 500 or dividend aristocrats.
Broadcom’s addressable market is massive and growing rapidly. It’s a dividend growth dynamo powered by some of the most important megatrends in human history.
5G, Automation, cloud computing, artificial intelligence, and infrastructure will all potentially make investors rich in the coming years and decades.
And in Broadcom, you have a high-yield way to profit from all of it, with your hard-earned savings managed by one of the most brilliant CEOs in tech history.
Do you want to own one of the world’s best tech companies? Then consider Broadcom.
Do you want to earn a very safe 3.1% yield today that’s likely to double every six years (or faster) according to management? Then Broadcom might be for you.
Do you want to potentially earn life-changing returns for years or even decades to come? With minimal fundamental risk? Then Broadcom might be what you’re looking for.
Broadcom is exactly the kind of rich retirement dream stock that can help you retire in safety and splendor.
Be the first to comment