


lucadp/iStock via Getty Images
Dividend aristocrats are famous for outperforming the market over time, and with lower volatility to boot.
Many income investors consider the bluest of blue-chips, and quite possibly the world’s best dividend-paying companies.
| Year | Aristocrats Returns | Aristocrats Cumulative Returns | S&P 500 Total Returns |
S&P Cumulative Returns |
| 1990 | 5.70% | 105.70% | -3.2% | 96.8% |
| 1991 | 38.50% | 146.4% | 30.4% | 126.2% |
| 1992 | 10.10% | 161.2% | 7.6% | 135.8% |
| 1993 | 4.30% | 168.1% | 10.1% | 149.5% |
| 1994 | 0.90% | 169.6% | 1.3% | 151.5% |
| 1995 | 34.60% | 228.3% | 37.6% | 208.4% |
| 1996 | 20.90% | 276.0% | 22.9% | 256.2% |
| 1997 | 34.50% | 371.3% | 33.3% | 341.5% |
| 1998 | 16.80% | 433.6% | 28.6% | 439.1% |
| 1999 | -5.40% | 410.2% | 21.0% | 531.4% |
| 2000 | 10.10% | 451.7% | -9.1% | 483.0% |
| 2001 | 10.80% | 500.4% | -11.9% | 425.5% |
| 2002 | -9.90% | 450.9% | -22.1% | 331.5% |
| 2003 | 25.40% | 565.4% | 28.7% | 426.6% |
| 2004 | 15.50% | 653.1% | 10.9% | 473.1% |
| 2005 | 3.70% | 677.2% | 4.9% | 496.3% |
| 2006 | 17.30% | 794.4% | 15.8% | 574.7% |
| 2007 | -2.10% | 777.7% | 5.6% | 606.9% |
| 2008 | -21.90% | 607.4% | -37.0% | 382.4% |
| 2009 | 26.60% | 768.9% | 26.4% | 483.3% |
| 2010 | 19.40% | 918.1% | 15.1% | 556.3% |
| 2011 | 8.30% | 994.3% | 2.1% | 568.0% |
| 2012 | 16.90% | 1162.4% | 16.0% | 658.8% |
| 2013 | 32.30% | 1537.8% | 32.4% | 872.3% |
| 2014 | 15.80% | 1780.8% | 13.7% | 991.8% |
| 2015 | 0.90% | 1796.8% | 1.4% | 1005.7% |
| 2016 | 11.80% | 2008.8% | 12.0% | 1126.4% |
| 2017 | 21.70% | 2444.7% | 21.8% | 1371.9% |
| 2018 | -2.70% | 2378.7% | -4.4% | 1311.5% |
| 2019 | 28% | 3044.8% | 31.5% | 1724.7% |
| 2020 | 8.70% | 3309.7% | 18.4% | 2042.0% |
| 2021 | 25.47% | 4152.6% | 28.7% | 2628.3% |
| 2022 | -2.98% | 4028.9% | -4.2% | 2518.4% |
| Aristocrat’s Median Return Since 1990 | Average Return Since 1990 | Annualized Returns Since 1990 | S&P 500 Annual Returns Since 1990 |
Annual Outperformance |
| 13.65% | 13.2% | 12.42% | 10.90% | 1.52% |
(Sources: YCharts, Ploutos)
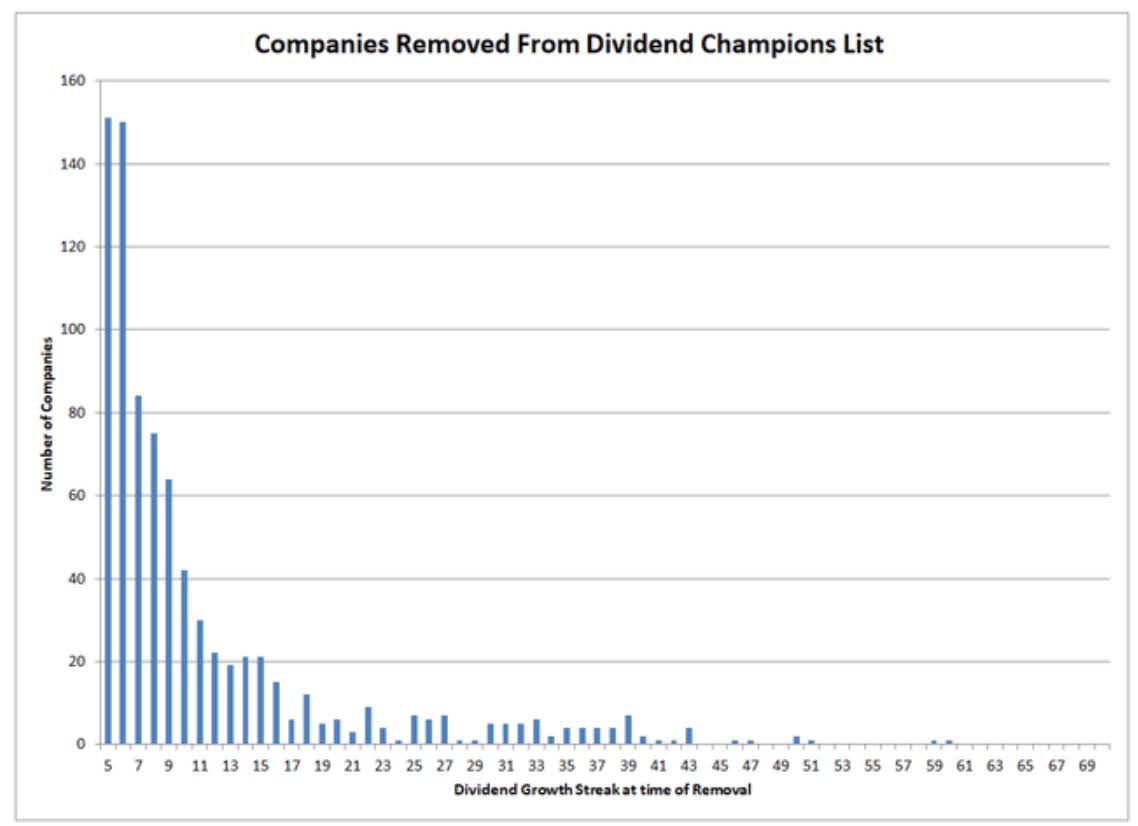
However, just because a company is an aristocrat, or a dividend champion (25+ year dividend growth streak but too small to be in the S&P 500) doesn’t make it an automatically great company.
Today I want to highlight why Telephone and Data Systems (TDS) is a value trap dividend champion to avoid like the plague.
- 80% likely to become a failed dividend champion in the future
But also why Lowe’s (LOW), Stanley Black & Decker (SWK), Altria (MO), and Enbridge (ENB), are four Ultra SWAN aristocrats that are potentially set to soar.
Not just in 2022, but more importantly, in the years and decades to come.
So let’s explore the right… and wrong way, to invest in dividend aristocrats, so you can learn how to buy right, hold on, and retire in safety and splendor.
Fortunes are made by buying right and holding on.” – Tom Phelps, 100 to 1 In The Stock Market
Why Telephone and Data Systems Is An Aristocrat To Avoid At All Costs
S&P uses up to 1,000 fundamental metrics to determine its credit ratings for companies. That might surprise you since most people didn’t realize that even that many fundamental metrics existed.
The point is that companies are highly complex financial creatures and to truly understand a company’s safety, dependability, and quality requires a holistic and comprehensive approach.
- Ben Graham recommended combining qualitative with quantitative analysis
- About a company’s past, present, and likely future
The Dividend King’s overall quality scores are based on a 241-point model that includes:
-
Dividend safety
-
Balance sheet strength
-
Credit ratings
-
Credit default swap medium-term bankruptcy risk data
-
Short and long-term bankruptcy risk
-
Accounting and corporate fraud risk
-
Profitability and business model
-
Growth consensus estimates
-
Management growth guidance
-
Historical earnings growth rates
-
Historical cash flow growth rates
-
Historical dividend growth rates
-
Historical sales growth rates
-
Cost of capital
-
Long-term risk-management scores from MSCI, Morningstar, FactSet, S&P, Reuters’/Refinitiv, and Just Capital
-
Management quality
-
Dividend friendly corporate culture/income dependability
-
Long-term total returns (a Ben Graham sign of quality)
-
Analyst consensus long-term return potential
In fact, it includes over 1,000 fundamental metrics including the 12 rating agencies we use to assess fundamental risk.
How do we know that our safety and quality model works well?
During the two worst recessions in 75 years, our safety model 87% of blue-chip dividend cuts, the ultimate baptism by fire for any dividend safety model.
And then there’s the confirmation that our quality ratings are very accurate.
DK Zen Phoenix: Superior Fundamentals Lead To Superior Long-Term Results
| Metric | US Stocks | 189 Real Money DK Phoenix Recs |
| Great Recession Dividend Growth | -25% | 0% |
| Pandemic Dividend Growth | -1% | 6% |
| Positive Total Returns Over The Last 10 Years | 42% | 99.5% (Greatest Investors In History 60% to 80% Over Time) |
| Lost Money/Went Bankrupt Over The Last 10 Years | 47% | 0.5% |
| Outperformed Market Over The Last Decade (299%) | 36% | 51% |
| Bankruptcies Over The Last 10 Years | 11% | 0% |
| Permanent 70+% Catastrophic Decline Since 1980 | 44% | 0.5% |
| 100+% Total Return Over The Past 10 Years | NA | 88% |
| Sources: Morningstar, JPMorgan, Seeking Alpha |
Basically, historical market data confirms that the DK safety and quality model is one of the most comprehensive and accurate in the world.
This is why I entrust 100% of my life savings to this model and the DK Phoenix blue-chip strategy.
So how does TDS score on one of the world’s most comprehensive and accurate safety and quality models?
TDS Dividend Safety
| Rating | Dividend Kings Safety Score (151 Point Safety Model) | Approximate Dividend Cut Risk (Average Recession) |
Approximate Dividend Cut Risk In Pandemic Level Recession |
| 1 – unsafe | 0% to 20% | over 4% | 16+% |
| 2- below average | 21% to 40% | over 2% | 8% to 16% |
| 3 – average | 41% to 60% | 2% | 4% to 8% |
| 4 – safe | 61% to 80% | 1% | 2% to 4% |
| 5- very safe | 81% to 100% | 0.5% | 1% to 2% |
| TDS | 45% | 2.0% | 7.0% |
| Risk Rating | Very High Risk (21st industry percentile risk-management consensus) | BB stable outlook credit rating 17% 30-year bankruptcy risk |
1% OR LESS Max Risk Cap Recommendation – highly speculative |
Long-Term Dependability
| Company | DK Long-Term Dependability Score | Interpretation | Points |
| Non-Dependable Companies | 21% or below | Poor Dependability | 1 |
| Low Dependability Companies | 22% to 60% | Below-Average Dependability | 2 |
| S&P 500/Industry Average | 61% (58% to 70% range) | Average Dependability | 3 |
| Above-Average | 71% to 80% | Very Dependable | 4 |
| Very Good | 81% or higher | Exceptional Dependability | 5 |
| TDS | 40% | Below-Average Dependability | 2 |
Overall Quality
| TDS | Final Score | Rating |
| Safety | 45% | 3/3 safe (for now) |
| Business Model | 60% | 2/3 above-average |
| Dependability | 40% | 2/5 below-average |
| Total | 44% | 7/13 Below-Average, Highly Speculative, Fallen Angel |
| Risk Rating |
0/3 Very High Risk |
|
| 1% OR LESS Max Risk Cap Rec – highly speculative |
45% Margin of Safety For A Potentially Good Buy |
How low-quality is TDS? It’s the worst company on the Master List.
The DK 500 Master List includes the world’s highest quality companies including:
-
All dividend champions
-
All dividend aristocrats
-
All dividend kings
-
All global aristocrats (such as BTI, ENB, and NVS)
-
All 13/13 Ultra Swans (as close to perfect quality as exists on Wall Street)
- 48 of the world’s best growth stocks
Why is that? Dozens of reasons.
Telephone and Data Systems Inc is a diversified telecommunications operator that provides mobile, telephone, and broadband services to more than 7 million customers. The firm’s mobile operations are conducted by its 81%-owned subsidiary, U.S. Cellular, which serves nearly 5 million wireless customers. The firm’s wireline operations are conducted by its wholly-owned subsidiary, TDS Telecom, which services nearly 1 million phone and Internet access lines in predominantly rural and suburban areas.” – Morningstar
The biggest is that telecom is a capital-intensive industry where rating agencies want to see 70% or lower free cash flow payout ratios.
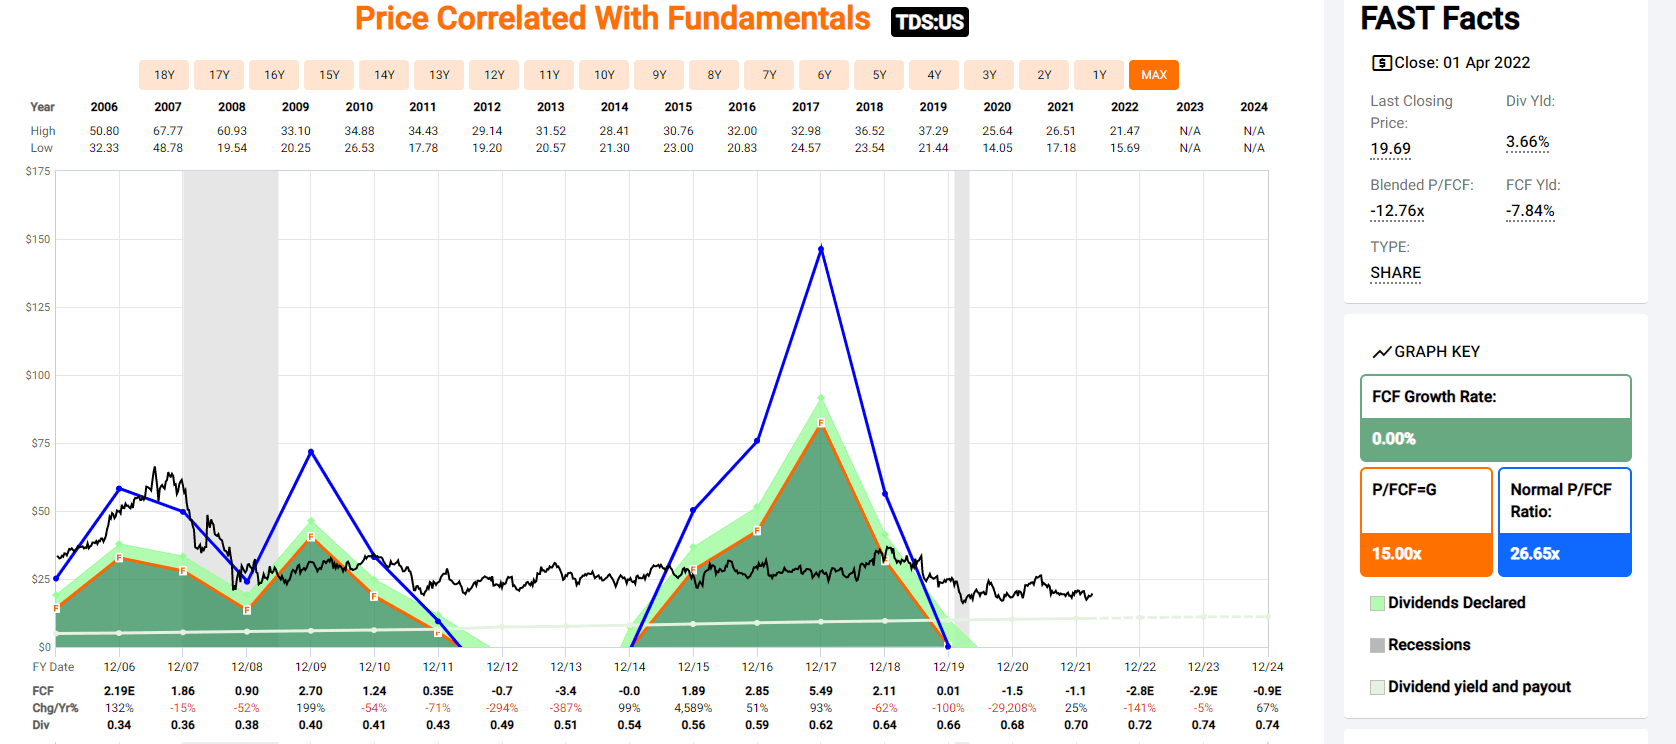
FAST Graphs, FactSet
TDS hasn’t had a safe payout ratio since 2018 and is expected to generate accelerating negative FCF for the foreseeable future.
Is the dividend expected to be cut? No, it’s expected to rise at a token rate each year to maintain the 47-year dividend growth streak.
But rest assured that TDS is most assuredly a value trap, and the dividend is 80% likely to be cut eventually.
- TDS is taking on debt to fund the dividend
- Which is why S&P rates it BB junk bond status, a 17% long-term bankruptcy risk
The only reason it’s still on the Master List is the Dividend Kings’ founding mandate to cover every aristocrat, king, and champion.
- If only to warn members about low quality “fallen angels” to avoid buying at any price
Virtually No Redeeming Qualities
The ultimate proof that a company is a value trap to avoid like the plague is its long-term growth and total returns.
TDS’s growth history is absolutely abysmal.
- -3.8% CAGR growth over the last 20 years
Telecom is a slow-growing business but TDS’ growth over the decades makes AT&T look like a world-class company by comparison.
Ben Graham famously said that over the long-term the market was a weighing machine, correctly “weighing the substance of a company”.
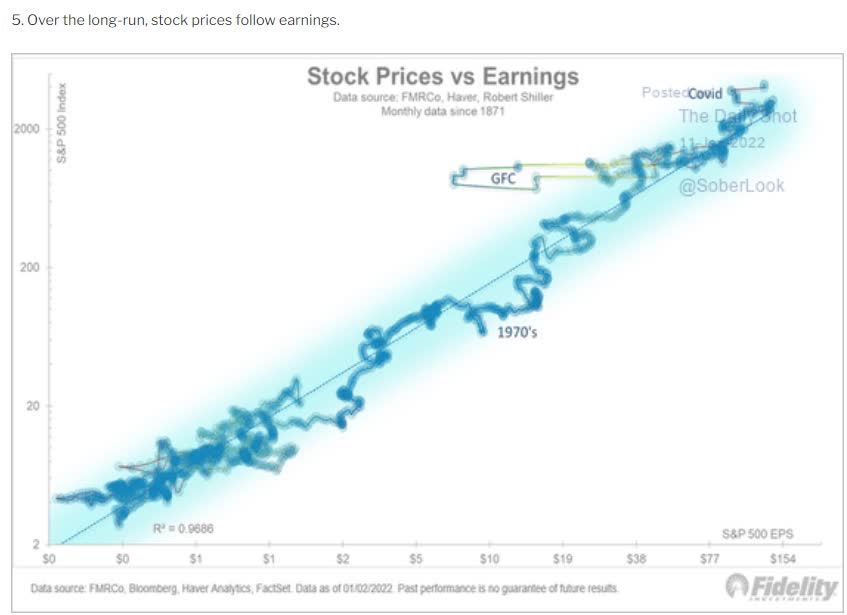
Fidelity
And over 30+ years a company’s stock returns are 97% determined by growth in fundamentals, or in this case, a lack of growth.
Total Returns Since 1991
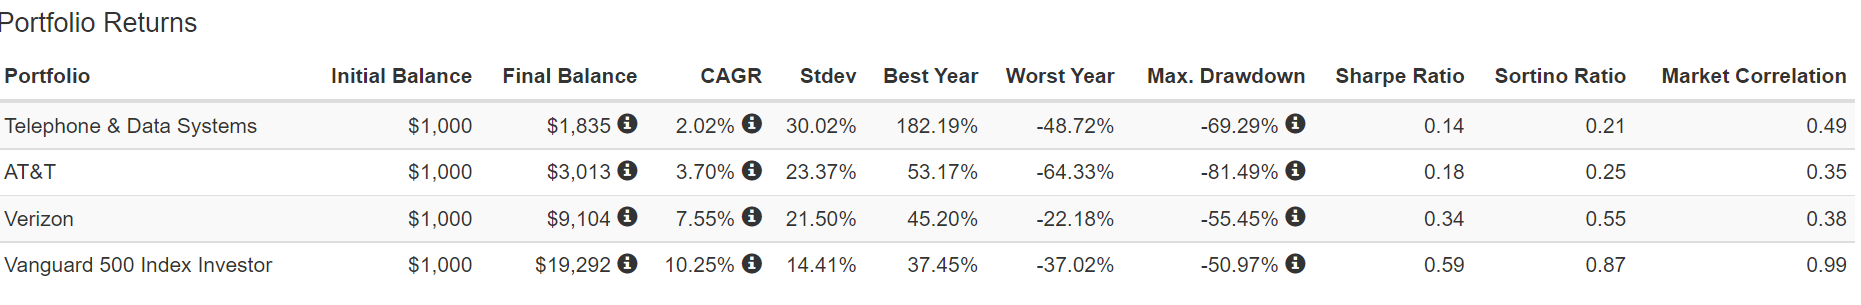
Portfolio Visualizer Premium
Over the past 31 years, a period of time where 97% of returns are pure fundamentals, not luck, TDS has delivered 2% annual returns, 73% less than Verizon (VZ).
And it suffered far higher volatility, of 30% per year, compared to Verizon’s 21.5%.
But wait, it gets worse.
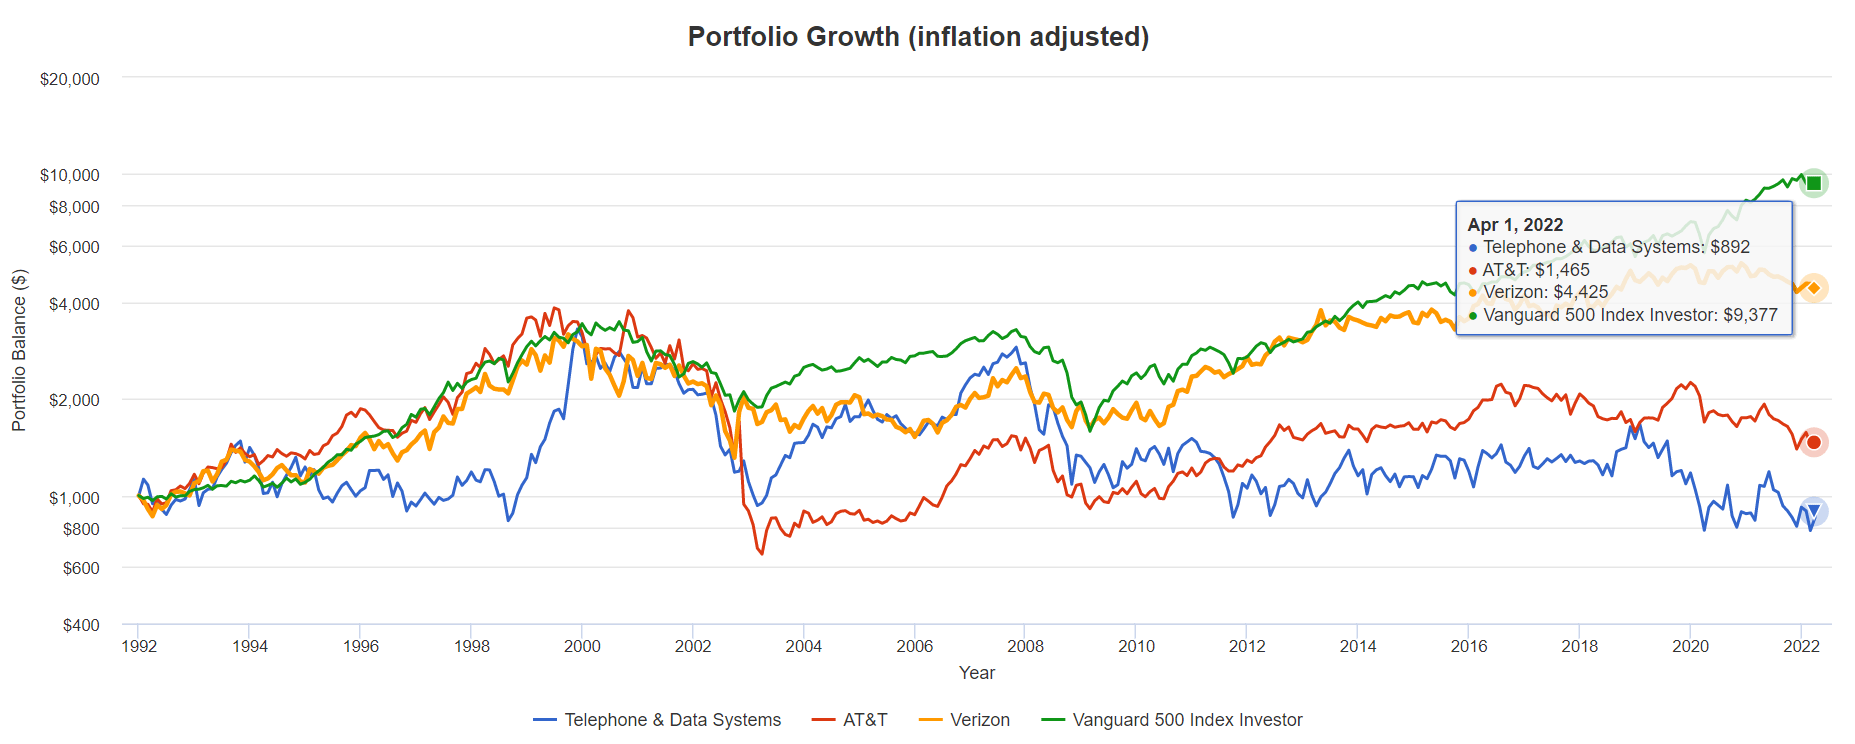
Portfolio Visualizer Premium
Adjusted for inflation, TDS investors are down 11% over the past 31 years.
How hard do you have to look to find a worse investment than TDS?
Rolling Returns Since 2001
Portfolio Visualizer Premium
Only John Hussman has delivered worse long-term returns for investors, by constantly predicting, and investing as if the US market was going to crash for decades.
- it actually did crash three times
- yet inflation-adjusted returns of -2.2%
- a 38.5% inflation-adjusted loss over 21 years
What about the future? Well, five analysts cover TDS on Wall Street, and here’s what they expect.
- long-term growth consensus: -7.8% CAGR
There is no redeeming quality to TDS, except maybe one.
FactSet Research Terminal
Its forward PE is a sky-high 33X due to a collapse in fundamentals.
But its cash-adjusted earnings (EV/EBITDA) is an attractive 6.1X.
That’s a screaming bargain by even private equity valuations.
But do you know who else has an EV/EBITDA that’s almost as low?
FactSet Research Terminal
Polaris (PII) is an Ultra SWAN quality dividend champion growing at double-digits and trading at 7.3X cash-adjusted earnings.
TDS is a below-average quality, highly speculative dividend champion that is shrinking at nearly the same rate as PII is growing.
Total Returns Since 1992
(Source: Portfolio Visualizer Premium)
Which of these anti-bubble dividend champions would you rather own?
As they say in the Army, “where’s the question drill sergeant?”
4 Dividend Aristocrats Potentially Set To Soar In 2022 And Beyond
(Source: DK Research Terminal)
You’ll recognize MO and ENB for my most recent article
They are such high amazing high-quality company, that I’m recommending them again. Let’s take a closer look to see why.
Why choose these four aristocrats in particular? For one thing, they represent four different sectors and thus offer good diversification.
But just take a look at their fundamentals.
World-Class Safety And Quality You Can Trust In Any Economy
| Company | Quality Rating (out Of 13) | Quality Score (Out Of 100) | Dividend/Balance Sheet Safety Rating (out of 5) | Safety Score (Out Of 100) | Dependability Rating (Out Of 5) | Dependability Score (out Of 100) |
| Stanley Black & Decker | 13 | 92% | 5 | 94% | 5 | 89% |
| Lowe’s | 13 | 100% | 5 | 100% | 5 | 100% |
| Altria | 13 | 88% | 5 | 91% | 5 | 83% |
| Enbridge | 13 | 84% | 5 | 87% | 5 | 85% |
| Average | 13.0 Ultra SWAN | 91.0% | 5.0 Very Safe | 93.0% | 5.0 Exceptional | 89.3% |
(Source: DK Research Terminal)
For context:
- Average aristocrat is 85% quality
- 11.8/12 Super SWAN
- 88% safety
- 84% dependability
These are some of the safest and most dependable dividends on earth. Just how safe?
| Rating | Dividend Kings Safety Score (151 Point Safety Model) | Approximate Dividend Cut Risk (Average Recession) |
Approximate Dividend Cut Risk In Pandemic Level Recession |
| 1 – unsafe | 0% to 20% | over 4% | 16+% |
| 2- below average | 21% to 40% | over 2% | 8% to 16% |
| 3 – average | 41% to 60% | 2% | 4% to 8% |
| 4 – safe | 61% to 80% | 1% | 2% to 4% |
| 5- very safe | 81% to 100% | 0.5% | 1% to 2% |
| 4 Aristocrats Set To Soar | 93% | 0.5% | 1.4% |
| Risk Rating | Low Risk (79th industry percentile risk-management consensus) | BBB+ stable outlook credit rating 4.2% 30-year bankruptcy risk |
20% OR LESS Max Risk Cap Recommendation (Each) |
(Source: DK Research Terminal)
During the average historical recession since WWII, the risk of a dividend cut from these Ultra SWAN aristocrats was about 1 in 200.
Even in the most severe recessions of the last 75 years, it was about 1.4%.
| Company | Payout Ratio | Industry Safe Payout Ratio Guideline | Debt/Capital | Industry Safe Debt/Capital Guideline |
| Stanley Black & Decker | 26% | 60% | 25% | 40% |
| Lowe’s | 24% | 60% | 113% | 40% |
| Altria | 80% | 85% | 101% | 60% |
| Enbridge | 68% | 83% | 48% | 60% |
| Average | 49.5% | 72.0% | 71.8% | 50.00% |
(Source: DK Research Terminal)
The payout ratio for these aristocrats is 22.5% below the rating agency safety guideline.
Elevated debt/capital is primarily a result of stock buybacks for Altria, and Lowe’s.
When a company buys back stock above book value, it reduces shareholder equity and pushes up debt/capital.
Shares that are repurchased sit on the balance sheet as treasury stock which is primarily used for stock option compensation for employees. It’s treated as a liability. In fact, it’s an asset that can be sold to raise cash.
Rating agencies adjust for this accounting artifact when determining credit ratings.
| Company | Long-Term Risk Management Consensus Industry Percentile | Risk-Rating | Risk-Management Rating | S&P Credit Rating | Credit Rating Outlook | 30-Year Bankruptcy Risk |
| Stanley Black & Decker | 74% | Low | Good | A | Stable | 0.66% |
| Lowe’s | 87% | Low | Very Good | BBB+ | Stable | 5.00% |
| Altria | 69% | Low | Above-Average | BBB | Stable | 7.50% |
| Enbridge | 87% | Low | Very Good | BBB+ | Stable | 5.00% |
| Average | 79.3% | Low | Good, Bordering On Very Good | BBB+ | Stable | 4.5% |
(Source: DK Research Terminal)
S&P estimates an average risk of default (bankruptcy) over the next 30 years at 4.5%.
And six rating agencies estimate long-term risk-management in the top 21% of their respective industries.
For context,
- Telephone and Data Systems: 21st percentile – poor, bordering on very poor
- Dividend Champions: 57th percentile – average
- Monthly Dividend Stocks: 60th percentile – above-average
- Hyper-Growth stocks: 61st percentile – above-average
- Master List average: 62nd percentile -above-average
- Dividend Kings: 63rd percentile -above-average
- Blue-Chip Quality Companies: 64th percentile – above-average
- Dividend Aristocrats: 67th percentile -above-average
- Low Volatility Stocks: 68th percentile – above-average
- Ultra SWANs: 71st percentile – good
- Foreign Dividend Stocks: 75th percentile – good
- Strong ESG Stocks: 78th percentile – good bordering on very good
- 4 Dividend Aristocrats Set To Soar: 79th percentile – good bordering on very good
- S&P Global (SPGI) #1 risk-management company, 94th industry percentile – exceptional
| Company | Dividend Growth Streak (Years) | ROC (Greenblatt) | ROC Industry Percentile | 13-Year Median ROC |
| Stanley Black & Decker | 54 | 17% | 93% | 64% |
| Lowe’s | 59 | 32% | 87% | 26% |
| Altria | 52 | 712% | 85% | 416% |
| Enbridge | 26 | NA | NA | NA |
| Average | 47.8 | 254% | 88% | 169% |
(Source: DK Research Terminal)
Ben Graham considered a 20+ year dividend growth streak to be a sign of excellent quality.
Justin Law
If a company has grown its dividends for 20+ years, there is very little risk that it will cut its dividend or even fail to keep raising it in all economic and industry conditions.
The average dividend growth streak for these aristocrats is 48 years, 2.5X the Graham standard of excellence.
- Just a few more years for this portfolio to become a dividend king portfolio
Return on capital is pre-tax profit/operating capital (the money it takes to run the business).
- Joel Greenblatt’s gold standard proxy for quality and moatiness
The S&P 500’s 2021 ROC was 14.6%.
- On average, it takes the typical S&P company about 7 years to recoup investments they make
The average return on capital for these aristocrats is 254%.
- Average investment recouped in 4.7 months
- 17X higher quality than the average S&P 500 company according to one of the greatest investors in history
These aristocrats’ ROC is in the top 12% of their industries, confirming a wide moat.
ROC is up almost 100% compared to their 13-year median, confirming a stable or improving moat.
Ok, so we can see that these are some of the world’s best companies.
And here’s why you might want to buy them today.
Wonderful Companies At Wonderful Prices
For context, here’s the valuation profile of the S&P 500.
S&P 500 Valuation Profile
| Year | EPS Consensus | YOY Growth | Forward PE | Blended PE | Overvaluation (Forward PE) |
Overvaluation (Blended PE) |
| 2021 | $206.25 | 50.34% | 20.7 | 21.9 | 20% | 25% |
| 2022 | $225.56 | 9.36% | 20.2 | 20.4 | 17% | 16% |
| 2023 | $248.01 | 9.95% | 18.3 | 19.2 | 7% | 9% |
| 2024 | $275.55 | 11.10% | 16.5 | 17.4 | -4% | -1% |
| 12-Month forward EPS | 12-Month Forward PE | Historical Overvaluation | PEG | 25-Year Average PEG | S&P 500 Dividend Yield |
25-Year Average Dividend Yield |
| $227.46 | 19.985 | 18.61% | 2.35 | 3.62 | 1.41% | 2.01% |
(Source: DK S&P 500 Valuation And Total Return Tool)
Stocks have already priced in 96% EPS growth from 2020 through 2024 and are trading at 20X forward earnings.
- 16.85 is the 25-year average
- 16.9 is the 10-year average (low rate era)
- 16.9 is the 45-year average
- 91% probability that stocks are intrinsically worth about 17X forward earnings
- A 14.5% correction needed to get back to the historical market fair value
S&P 500 2027 Consensus Return Potential
| Year | Upside Potential By End of That Year | Consensus CAGR Return Potential By End of That Year | Probability-Weighted Return (Annualized) | Inflation And Risk-Adjusted Expected Returns |
Expected Market Return Vs Historical Inflation-Adjusted Return |
| 2027 | 33.15% | 5.89% | 4.42% | 1.01% | 15.78% |
(Source: DK S&P 500 Valuation And Total Return Tool)
Adjusted for inflation, the risk-expected returns of the S&P 500 are about 1% for the next five years.
- 1/6th of the S&P’s historical inflation-adjusted returns of 6.4% CAGR
| S&P Earnings Yield | 10-Year US Treasury Yield | Earning Yield Risk-Premium (3.7% 10 and 20-year average) |
| 5.00% | 2.40% | 2.60% |
| Theoretical Interest Rate Justified Market Fair Value Forward PE | Current PE |
Theoretically Interest Rate Justified Market Decline |
| 16.39 | 19.99 | 18.00% |
(Source: DK S&P 500 Valuation And Total Return Tool)
And if you factor in interest rates, stocks are slightly more, not less historically overvalued.
And now take a look at the valuation of these aristocrats.
| Company | Discount To Fair Value | PE/EBITDA/FFO 2022 | Earnings Yield 2022 | PEG 2022 | 12-Month Consensus Total Return Potential | 12-Month Fundamentally Justified Upside Total Return Potential |
| Stanley Black & Decker | 28.4% | 11.7 | 8.5% | 1.07 | 46.2% | 41.9% |
| Lowe’s | 25.8% | 15.3 | 6.6% | 0.78 | 36.6% | 36.3% |
| Altria | 15.9% | 10.9 | 9.2% | 2.05 | 8.7% | 25.8% |
| Enbridge | 2.6% | 9.5 | 10.5% | 1.59 | 4.0% | 8.6% |
| Average | 18.2% | 11.9 | 8.7% | 1.37 | 23.9% | 28.2% |
(Source: DK Research Terminal)
While the S&P trades at 20X earnings and the aristocrats 22X, these aristocrats trade at just 11.9.
- The last time the S&P traded this low was September 2011
The S&P’s PEG ratio is 2.35 while these aristocrats trade at 1.37.
That’s basically Peter Lynch’s “growth at a reasonable price”.
Analysts expect 24% total returns in the next 12-months alone and 28% 12-month total returns are justified if they grow as expected and return to historical fair value.
Long-Term Return Fundamentals That Are Simply Outstanding
| Company | Yield | FactSet Long-Term Consensus Growth Rate | LT Consensus Total Return Potential | LT Risk-Adjusted Expected Return |
| Stanley Black & Decker | 2.2% | 11.0% | 13.2% | 9.3% |
| Lowe’s | 1.6% | 19.6% | 21.2% | 14.8% |
| Altria | 6.8% | 5.3% | 12.1% | 8.5% |
| Enbridge | 5.9% | 6.0% | 11.9% | 8.3% |
| Average | 4.1% | 10.5% | 14.6% | 10.2% |
(Source: DK Research Terminal, FactSet)
For context
- S&P yields 1.4%
- Aristocrats yield 2.3%
- Vanguard’s high-yield ETF: 2.7%
- Junk bonds: 4.2%
Junk bonds have an average credit rating of “B” while these aristocrats are BBB+.
- 37% default risk vs 4.5%
- Basically the same yield as junk bonds with 88% less fundamental risk
Analysts expect 10.5% long-term dividend growth and 14.6% long-term total returns.
How impressive is that?
| Investment Strategy | Yield | LT Consensus Growth | LT Consensus Total Return Potential | Long-Term Risk-Adjusted Expected Return | Long-Term Inflation And Risk-Adjusted Expected Returns | Years To Double Your Inflation & Risk-Adjusted Wealth |
10 Year Inflation And Risk-Adjusted Return |
| Europe | 2.6% | 12.8% | 15.4% | 10.7% | 8.6% | 8.4 | 2.27 |
| 4 Aristocrats Set To Soar | 4.1% | 10.5% | 14.6% | 10.2% | 8.0% | 9.0 | 2.17 |
| Value | 2.1% | 12.1% | 14.1% | 9.9% | 7.7% | 9.3 | 2.10 |
| High-Yield | 2.7% | 11.3% | 14.0% | 9.9% | 7.7% | 9.4 | 2.10 |
| Top 50 Megacaps | 1.0% | 12.10% | 13.1% | 9.2% | 7.0% | 10.3 | 1.97 |
| High-Yield + Growth | 1.7% | 11.0% | 12.7% | 8.9% | 6.7% | 10.8 | 1.91 |
| Safe Midstream + Growth | 3.3% | 8.5% | 11.8% | 8.3% | 6.1% | 11.8 | 1.80 |
| Nasdaq (Growth) | 0.8% | 10.7% | 11.5% | 8.1% | 5.9% | 12.3 | 1.77 |
| Safe Midstream | 5.1% | 6.0% | 11.1% | 7.8% | 5.6% | 12.9 | 1.72 |
| Dividend Aristocrats | 2.2% | 8.9% | 11.1% | 7.8% | 5.6% | 12.9 | 1.72 |
| REITs + Growth | 1.8% | 8.9% | 10.6% | 7.4% | 5.2% | 13.7 | 1.67 |
| S&P 500 | 1.4% | 8.5% | 9.9% | 7.0% | 4.8% | 15.1 | 1.59 |
| Dividend Growth | 1.6% | 8.0% | 9.6% | 6.7% | 4.5% | 15.9 | 1.56 |
| REITs | 2.9% | 6.5% | 9.4% | 6.6% | 4.4% | 16.4 | 1.54 |
| 60/40 Retirement Portfolio | 2.1% | 5.1% | 7.2% | 5.1% | 2.9% | 24.9 | 1.33 |
| 10-Year US Treasury | 2.4% | 0.0% | 2.4% | 1.7% | -0.5% | -142.0 | 0.95 |
(Sources: Morningstar, FactSet, YCharts)
While there are several popular investing strategies that analysts expect to deliver 14% to 15% long-term returns, none yield a very safe 4.1%.
Inflation-Adjusted Consensus Total Return Potential: $1,000 Initial Investment
| Time Frame (Years) | 7.7% CAGR Inflation-Adjusted S&P Consensus | 9.0% Inflation-Adjusted Aristocrat Consensus | 12.4% CAGR Inflation-Adjusted 4 Aristocrat Consensus | Difference Between Inflation Adjusted 4 Aristocrat Consensus And S&P 500 |
| 5 | $1,449.03 | $1,540.04 | $1,795.63 | $346.60 |
| 10 | $2,099.70 | $2,371.71 | $3,224.30 | $1,124.60 |
| 15 | $3,042.53 | $3,652.52 | $5,789.67 | $2,747.13 |
| 20 | $4,408.74 | $5,625.01 | $10,396.13 | $5,987.39 |
| 25 | $6,388.41 | $8,662.72 | $18,667.64 | $12,279.24 |
| 30 | $9,257.02 | $13,340.91 | $33,520.26 | $24,263.25 |
(Source: DK Research Terminal, FactSet)
Even a modest investment today could eventually turn into a small fortune that could change your financial destiny.
| Time Frame (Years) | Ratio Aristocrats/S&P | Ratio Inflation-Adjusted 4 Aristocrat Consensus Vs. S&P 500 |
| 5 | 1.06 | 1.24 |
| 10 | 1.13 | 1.54 |
| 15 | 1.20 | 1.90 |
| 20 | 1.28 | 2.36 |
| 25 | 1.36 | 2.92 |
| 30 | 1.44 | 3.62 |
(Source: DK Research Terminal, FactSet)
And potentially beat the S&P 500 by almost 4X over the coming decades.
OK, this is all amazing, but what evidence is there that these four aristocrats can deliver anything like 14% to 15% long-term returns?
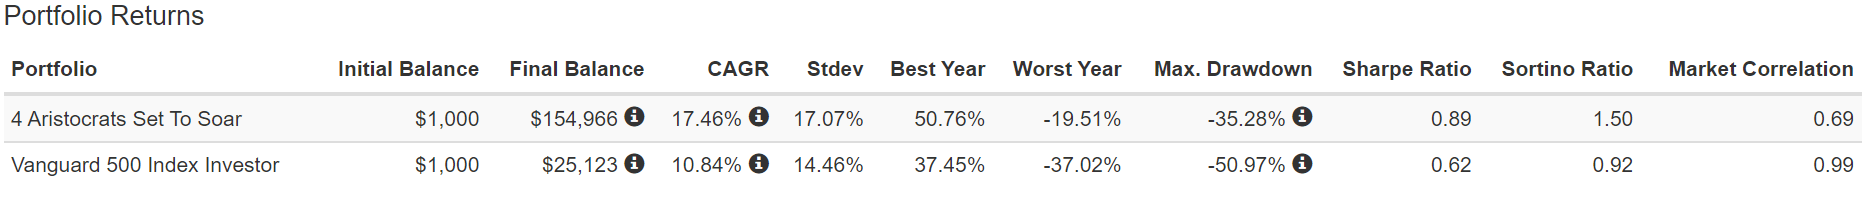
Historical Total Returns Since 1991 (Annual Rebalancing)
The future doesn’t repeat, but it often rhymes.” – Mark Twain
Past performance is no guarantee of future results, but studies show that blue-chips with relatively stable fundamentals over time offer predictable returns based on yield, growth, and valuation mean reversion.

Bank of America
Portfolio Visualizer
These aristocrats have delivered an impressive 17.5% annually compared to 14.6% that analysts expect in the future.
Those returns smashed the market, and for 31 years no less. How much does 7% better returns for three decades matter?
- $1 turned into $73 adjusted for inflation
- vs. S&P 500 $12
- Over 5X the market’s inflation-adjusted returns over 31 years
The average 15-year rolling return of 16.5% more than doubled the market’s 15-year rolling average of 7.5%.
The worst 5-year return was 13% vs the market’s -26%
The worst 10-year return was 183% vs the S&P 500’s -30%.
And what about dividend income growth, the entire reason for owning aristocrats?
| Portfolio | 1991 | 2021 Income Per $1,000 Investment | Annual Income Growth | Starting Yield | 2021 Yield On Cost |
| 4 Aristocrats | $41 | $6,344 | 17.66% | 4.1% | 634.4% |
(Source: Portfolio Visualizer Premium)
Back in 1991, these aristocrats yielded 4.1%, the same as today. But after 32 years of 18% annual income growth, that yield on cost has grown to 634%.
What about future income growth? Here’s what analysts expect.
| Analyst Consensus Income Growth Forecast | Risk-Adjusted Expected Income Growth | Risk And Tax-Adjusted Expected Income Growth |
Risk, Inflation, And Tax Adjusted Income Growth Consensus |
| 14.8% | 10.3% | 8.8% | 6.6% |
(Source: DK Research Terminal, Portfolio Visualizer)
Analysts expect close to 15% annual income growth in the future.
Adjusting for the risk of these companies now growing as expected, inflation, and taxes real income growth of 6.6% annually is likely.
- S&P 500’s historical inflation- and tax-adjusted income growth rate is 3%
- These four aristocrats offer more than 2X the S&P’s historical income growth
- FactSet consensus for a 60/40’s inflation and tax-adjusted income growth rate is 0.5%
- These four aristocrats offer 13X the 60/40’s consensus income growth potential
Bottom Line: Avoid Trash And Buy Undervalued Dividend Aristocrat Treasure If You Want To Retire Rich
Dividend aristocrats can make wonderful long-term investments, as they represent some of the world’s best companies.
However, not all aristocrats and dividend champions are created equal, not by a long shot.
TDS represents the lowest quality aristocrat and champion on Wall Street, a company that makes almost every other company look good by comparison.
You have to try really hard to deliver negative real returns over 32 years and that’s what TDS has done. And with -7.8% long-term growth consensus expected from analysts, this is almost certainly a value trap future failed dividend champion to avoid like the plague.
In contrast, SWK, LOW, ENB, and MO represent four aristocrats that are potentially set to soar in 2022 and beyond.
- 4.1% very safe yield
- 10.5% CAGR long-term growth consensus
- 14.6% CAGR long-term return potential similar to the returns of the last 32 years
- 18% discount to fair value (11.9X earnings)
As part of a diversified and prudently risk-managed portfolio, these four aristocrats could help you retire in safety and splendor.
In fact, with three low-cost ETFs, you can turn these aristocrats into growth and low-volatility versions of the Ultimate Sleep Well At Night Retirement Portfolio that can potentially help the typical retired couple
- generate an extra $3 million in inflation-adjusted retirement income over 30 years compared to a 60/40 retirement portfolio
- deliver $6.3 million more inflation-adjusted wealth over 30 years
- turn $555,000 in median retirement savings into $8.8 million inflation-adjusted wealth after 30 years
- the low-volatility version of this portfolio fell just 10% in 2008 vs 22% for a 60/40
- the low-volatility version of this portfolio experienced a peak decline of just 22% during the Great Recession vs 31% for a 60/40
Whatever your investing goals, risk profile, or time horizon, there is a right and wrong way to invest in dividend aristocrats.
Buying low-quality trash is the wrong way.
Buying Ultra SWAN quality aristocrats and kings is the right way.
Fretting over the Fed, interest rates, the war, and trying to time the market’s unpredictable short-term swings is most definitely the wrong way to build long-term wealth and rich retirement income.
The right asset allocation and prudent risk-management for your needs, combined with the world’s best aristocrats, bought at reasonable to attractive valuations, is most assuredly the right way.
Fortunes are made by buying right and holding on.” – Tom Phelps, 100 to 1 In the Stock Market
When you entrust your hard-earned savings to the world’s best companies and most skilled management teams and risk-managers, you never have to pray for luck on Wall Street.
Because the world’s best companies will help you make your own luck, with an army of employees that work hard for you, so that eventually you won’t have to.
Be the first to comment