

jetcityimage/iStock Editorial via Getty Images
We expect 3M Company (NYSE:MMM) to be snapped up quickly at its present valuation. The company is a proven dividend aristocrat boasting 60+ years of cumulative annual dividend increases. As the technical chart demonstrates below, shares may have already bottomed here as the MACD indicator looks poised to give a buy signal any week now. Followers of our work will know that we give plenty of credence to these signals when they present themselves on long-term charts and when their respective crossovers take place well below the “zero” level (Which we have at present).
Technical Chart of 3M (Stockcharts.com)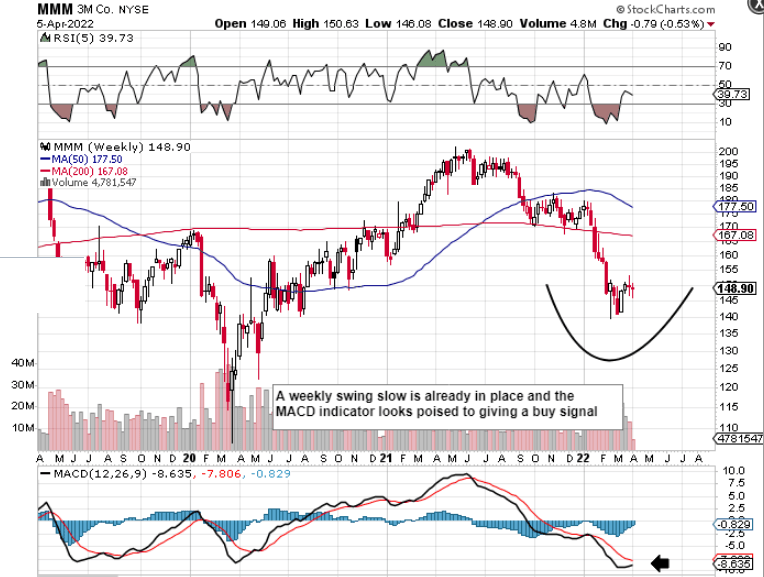
The sizable drop in the share price of MMM over the past 10 months or so has spiked the dividend yield to approximately the 4% mark which is well above the company’s 5-year average of approximately 3%. Many investors view the dividend yield as a proxy for a stock’s valuation, so it is no surprise to see MMM’s yield being elevated at present given the technical chart above.
Given that MMM shares are trading with a below-average sales multiple of 2.45 and a return on capital of almost 15%, we would expect shares to trade back towards their averages both in terms of valuation and profitability (Bullish move). Suffice it to say, the “capital gain” side of a long investment in MMM at present looks favorable due to these reasons. The income side (despite the present 4% yield) needs to be investigated more by investors for the following reason.
Although MMM’s 5-year average annual dividend growth rate comes in at 5.65%, the 12-month rate comes in at 0.675%. With inflation rates increasing significantly in many countries and most likely higher than published percentages, protecting one’s future purchasing power has never been as important as it is now for the long-term investor.
Investors essentially put money to work now in order to recoup more in the future. The problem is that it is very easy to overlook how inflation can adversely affect future cash flows because investors tend to focus more on the prevailing dividend yield (today) instead of dividend growth rates (future). We will put some numbers on this to give our argument some context.
For example, 3M’s latest quarterly dividend payment came in at $1.49 per share, which means the forward annual amount comes in at $5.96 per share. So 100 shares of 3M stock today, all things remaining equal, would yield $596 in dividend income over the next 12 months for the 3M investor. Now if inflation were to run at 5% on average per year over the next 20 years, our above-mentioned investor would need to be earning at least $1,581 from his initial 100 shares in 2042 to have the same purchasing power in 2022.
Suffice it to say from an income standpoint & taking 3M’s present dividend growth rates into account, investors are actually losing purchasing power at present. However, this is the situation right now. We want to know how 3M’s dividend growth will pan out over the next 20 years. How do we do this? We do this to the best of our ability by monitoring trends in the most important components of dividend growth investing, which are earnings growth, free cash flow growth as well as the payout ratio.
- With respect to earnings growth, 3M’s 10-year average annual earnings growth rate comes in at approximately 5.5% but the firm is just off the back of a strong fiscal 2021 (9.41% EPS growth). Although fiscal 2022 is expected to be slow (2.3% EPS growth), analysts who follow 3M expect the company to bounce back strongly in fiscal 2023 & fiscal 2024.
- 3M’s average annual free cash flow growth over the same time frame comes in at 5.33%. Suffice it to say, if profits and cash flow are increasing, dividend growth given 3M’s 60+ year record will undoubtedly follow. Furthermore, the float has declined close to 2% on average per year over the past decade, which is another tailwind for sustained growth if this trend continues.
- The payout ratio illustrates how much flexibility 3M has with its payout. 3M’s payout ratio currently comes in at 58.6%, whereas its 10-year average is slightly above 54%. Although trending slightly higher, the ratio is still trading under that 60 to 65% area which is vital. As long as the payout ratio continues around these levels, 3M should be able to continue to boost the payout going forward.
Therefore, to sum up, although recent dividend growth rates have been somewhat discouraging in 3M, this does not mean that this trend will continue. In fact, if we look at 3M from a “Total Return” standpoint, the company’s valuation, profitability, technicals, and cash flow all point to a rising share price (and dividend) in due course. Just remember that the technical chart has fully digested the company’s fundamentals at this stage from lawsuits to litigations and everything in between. There are far more plusses here than drawbacks. Wait for that buy signal. We look forward to continued coverage.
Be the first to comment