

Andranik Hakobyan/iStock via Getty Images
Thesis
Recent market corrections have provided attractive opportunities for high-quality funds such as the Schwab U.S. Dividend Equity ETF (NYSEARCA:SCHD) and Vanguard High Dividend Yield ETF (NYSEARCA:VYM). Let’s provide a broader perspective of value-dividend investing first before diving into these funds themselves.
As you can see from the following chart, the S&P 500 suffered a total loss of more than 18.3% YTD. In contrast, the value space (represented by SPVY) suffered “only” about 10.8% correction, about 8% better than the overall market. Do not overlook the 8% difference – it translates into a LOT less stress both financially and emotionally for many investors.
Against this broader backdrop, you can see that both VYM and SCHD fared even better than the overall value stocks. VYM suffered a total loss of 7.7% YTD and SCHD was slightly higher at 9.7%. Such correction also brought their valuation and dividends into very attractive ranges, as you will see later. And in case you are having a hard time deciding which one of these top funds fits your portfolio better, I will provide my 2 cents and explain why I prefer SCHD better. As a value-centric investor, I like SCHD’s more concentrated holdings and the indexing approach, its larger valuation discount compared to its historical records, and also its record level yield spread measured against VYM.
Seeking Alpha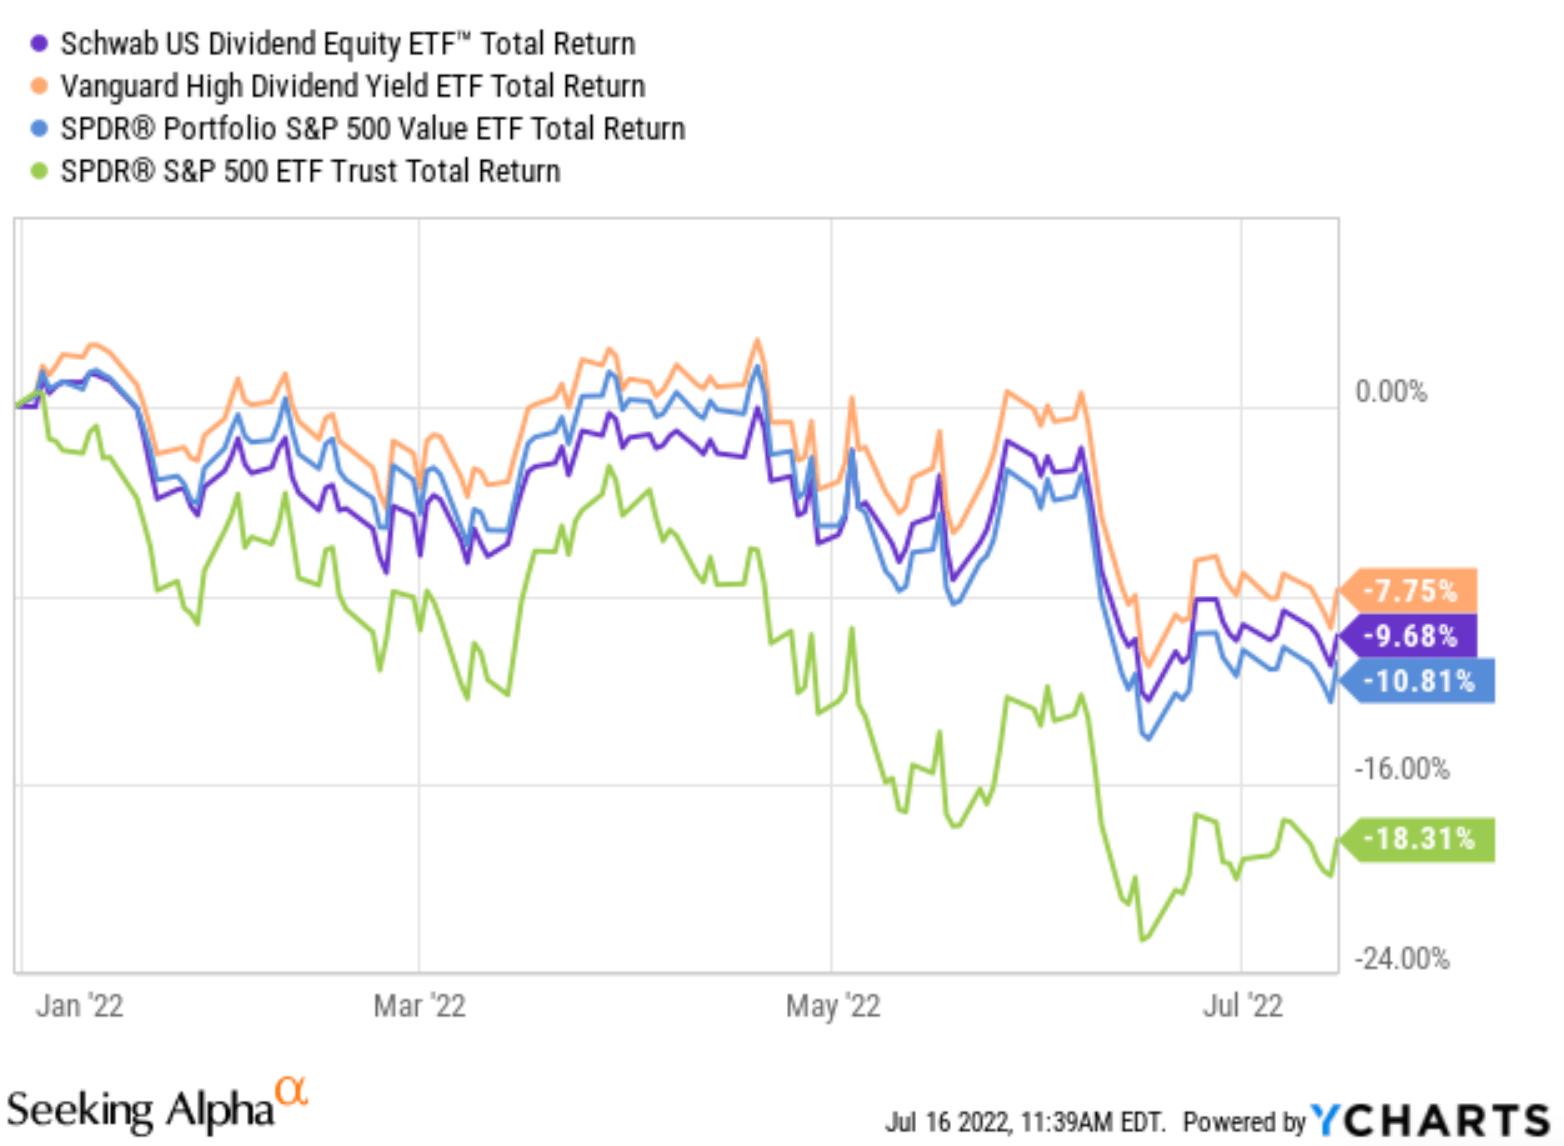
SCHD And VYM: Basic Information
Both are popular and large funds for dividend investors, and I assume most readers are familiar with them already. Just a few details that I think are worth mentioning. First, both feature rock-bottom expense ratios. Both charge a 0.06% expense ratio. Secondly, both funds are very similarly valued at 14.1x and 14.5x PE, a valuation that is substantially below the overall market. Lastly, both funds are also projected to grow at very similar rates (11% vs 11.2%).
The main differences are in their indexing methods, which is the deciding factor for me. The indexing strategy of VYM is primarily based on yield. As commented by the following fund description (and the emphases were added by me), the funds focus on stocks forecasted to provide above-average dividend yields.
- Seeks to track the performance of the FTSE® High Dividend Yield Index, which measures the investment return of common stocks of companies characterized by high dividend yields.
- Provides a convenient way to track the performance of stocks that are forecasted to have above-average dividend yields.
In contrast, SCHD focuses on both the quality and sustainability of dividends based on fundamental financial ratios, as commented by the following fund description (and the emphases were again added by me):
- The fund’s goal is to track as closely as possible, before fees and expenses, the total return of the Dow Jones U.S. Dividend 100™ Index.
- Tracks an index focused on the quality and sustainability of dividends
- Invests in stocks selected for fundamental strength relative to their peers, based on financial ratios.
Source: Vanguard.com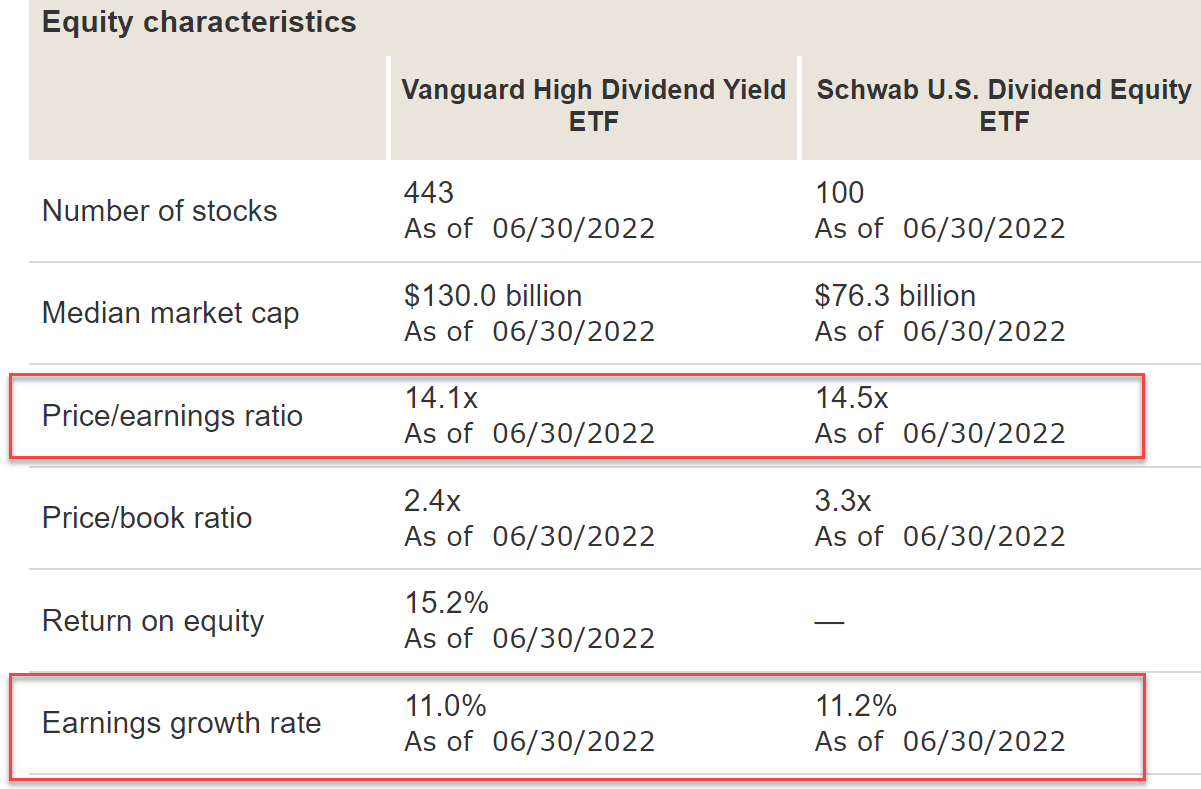
Reason 1: More Concentrated Holdings
From the above chart, you can see that VYM holds a total of 443 stocks and SCHD only 100. So as a result, SCHD holds a much more concentrated portfolio. You can also see the concentration by looking at their top ten holdings. Several of their top 10 holdings overlap (such as Home Depot (HD) and Coca-Cola (KO)), illustrating the similarities in their indexing method. But the key is that the top 10 positions represent more than 42% of the total asset for SCHD, almost 2x higher than VYM’s 23%.
Readers familiar with my investment style know that I always prefer fewer holdings that I understand well over more holdings that I don’t. And it is almost impossible for most investors to meaningfully understand more than 2 dozen stocks. For this reason, I feel I have a much better understanding of the holdings in SCHD at a stock level than VYM. For example, I’ve written dedicated analyses on all the top 10 holdings in SCHD, plus some of its small positions. But is essentially impractical to understand even a fraction of VYM’s holdings.
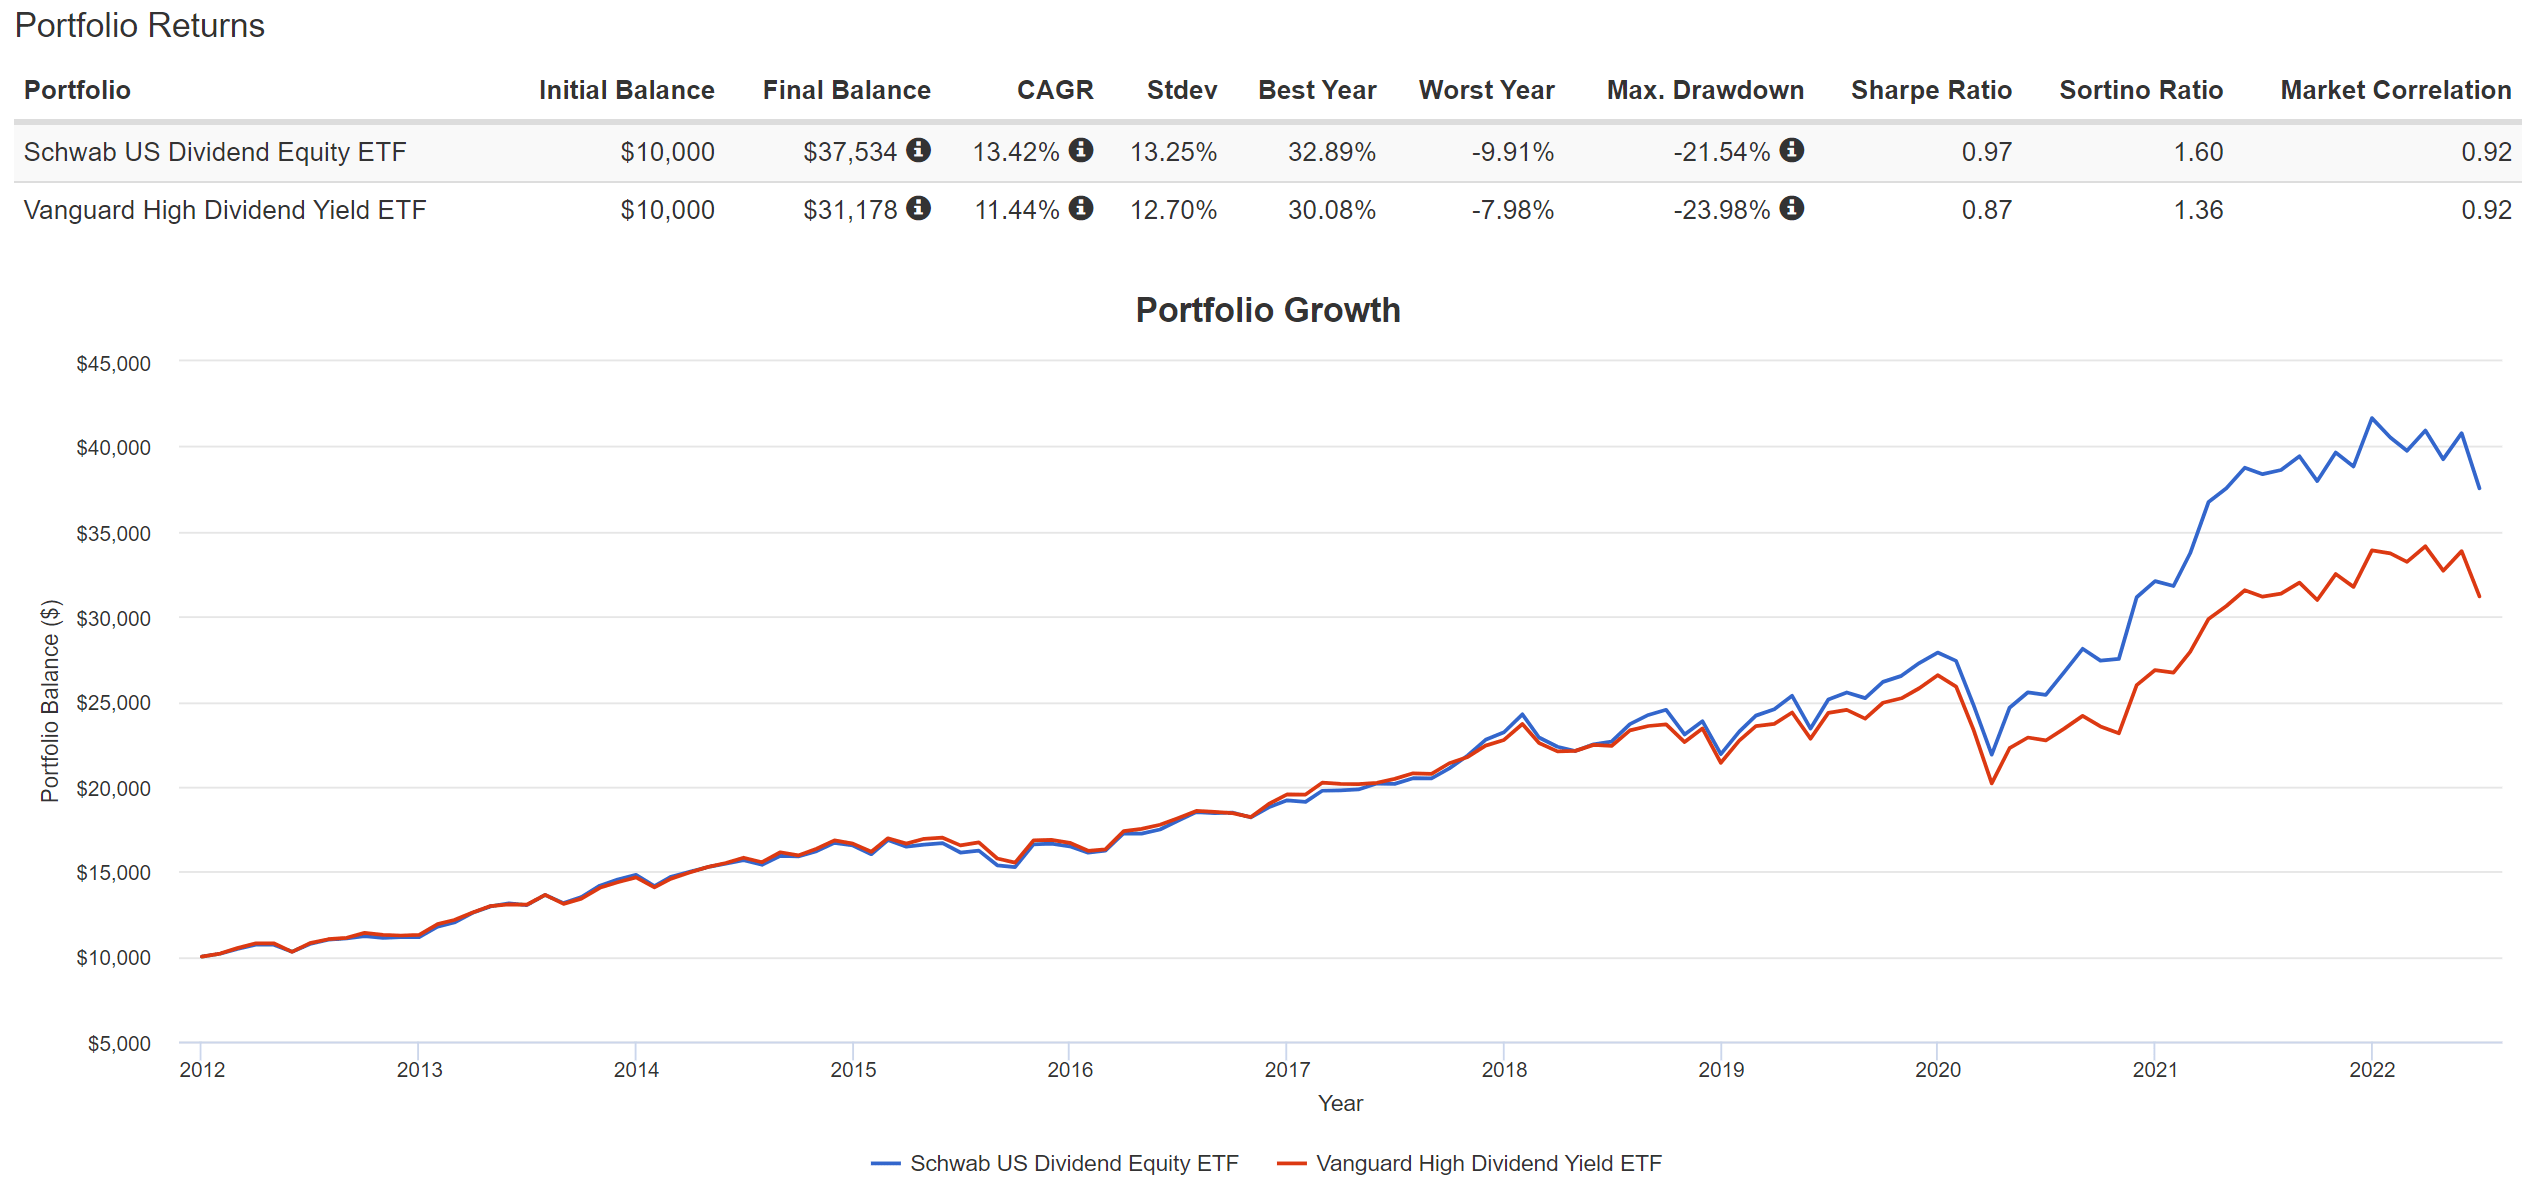
And in my experience, such an approach has not only produced better returns but also lower risks, which you can see from the next shot below. As you can see, SCHD has provided better returns since 2012. Its CAGR has been 13.4%, almost a whole 2% above VYM’s 11.4% CAGR. At the same time, despite the much fewer holdings, its risks are about the same as measured by standard deviation maximum, maximum drawdowns, and worst year returns. And its Sharpe ratio and Sortino ratio are both better than VYM by a good margin.
Source: Vanguard.com Source: portfoliovisualizer.com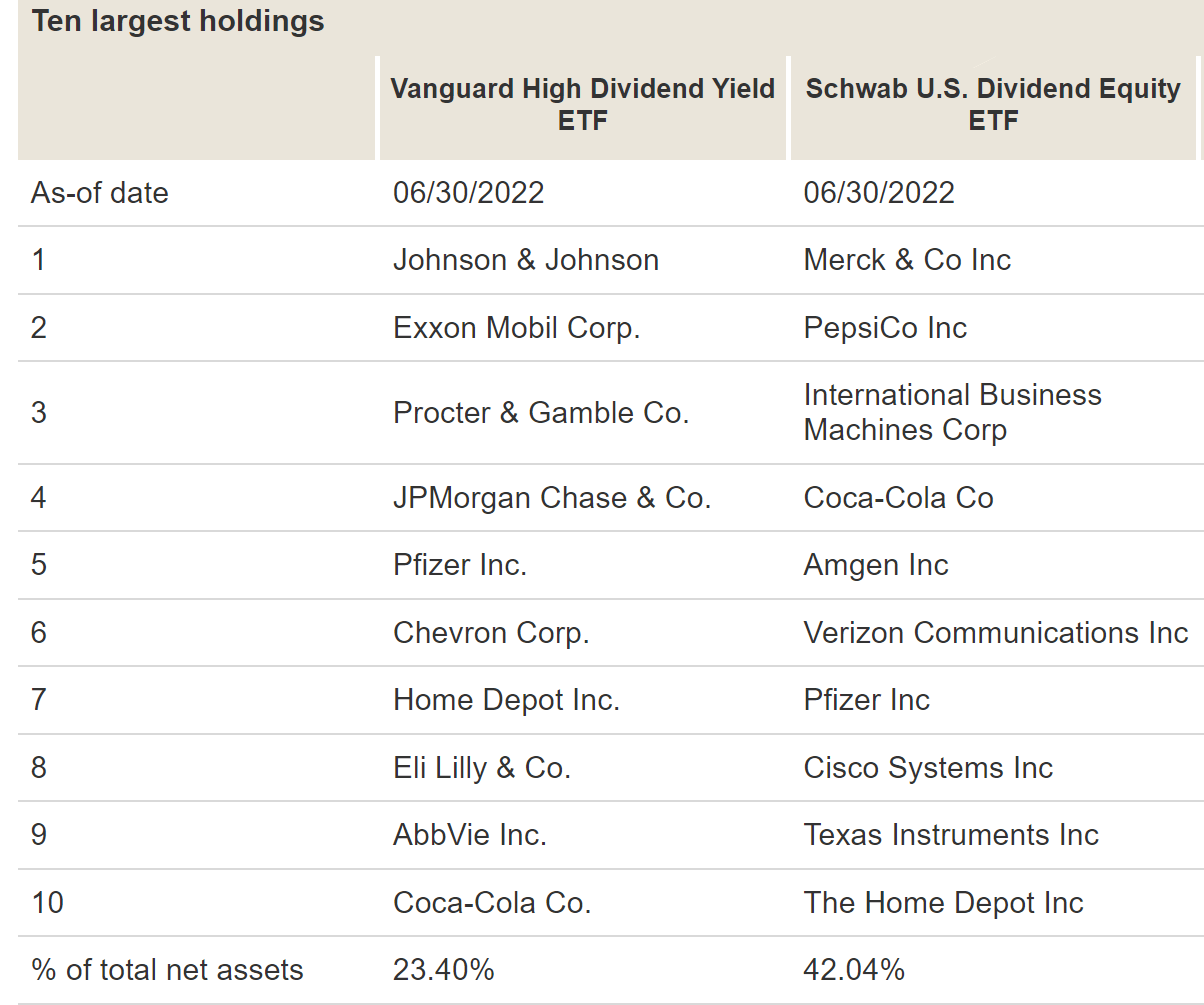
Reason 2: Larger Discount From Historical Average
Since many investors interested in SCHD and VYM are drawn to their dividends, the next chart compares their dividends against their historical records. Firstly, as you can see, currently SCHD provides slightly higher dividend yields of 3.38%, which is 0.24% above VYM. Such a spread does not seem to be too large in absolute terms. But as you’re going to see in the next section, it’s actually off the chart once we put it into historical perspective.
Secondly, you can also see that both are currently yielding above their historical averages, which is why now is an attractive opportunity to consider these funds thanks to the recent correction. To be more specific, the dividend yields for SCHD have been quite stable and fluctuated in a relatively narrow range between about 2.45% and 3.35% if you ignore the outlier data points during the COVID panic. Its average yield is about 2.84% in the past 10 years. Therefore, its current yield of 3.38% is about 19% above its historical average, signaling a 19% discount.
The picture for VYM is about the same quantitatively. The dividend yields for VYM have also fluctuated in a relatively narrow range between about 2.64% and 3.5% if the outlier data points are ignored. Its average yield is about 2.99% in the past 10 years. And its current yield is also above its historical mean. However, qualitatively, its current yield of 3.14% is only about 5% above its historical average, signaling a 5% discount, much smaller than the discount in SCHD.
Seeking Alpha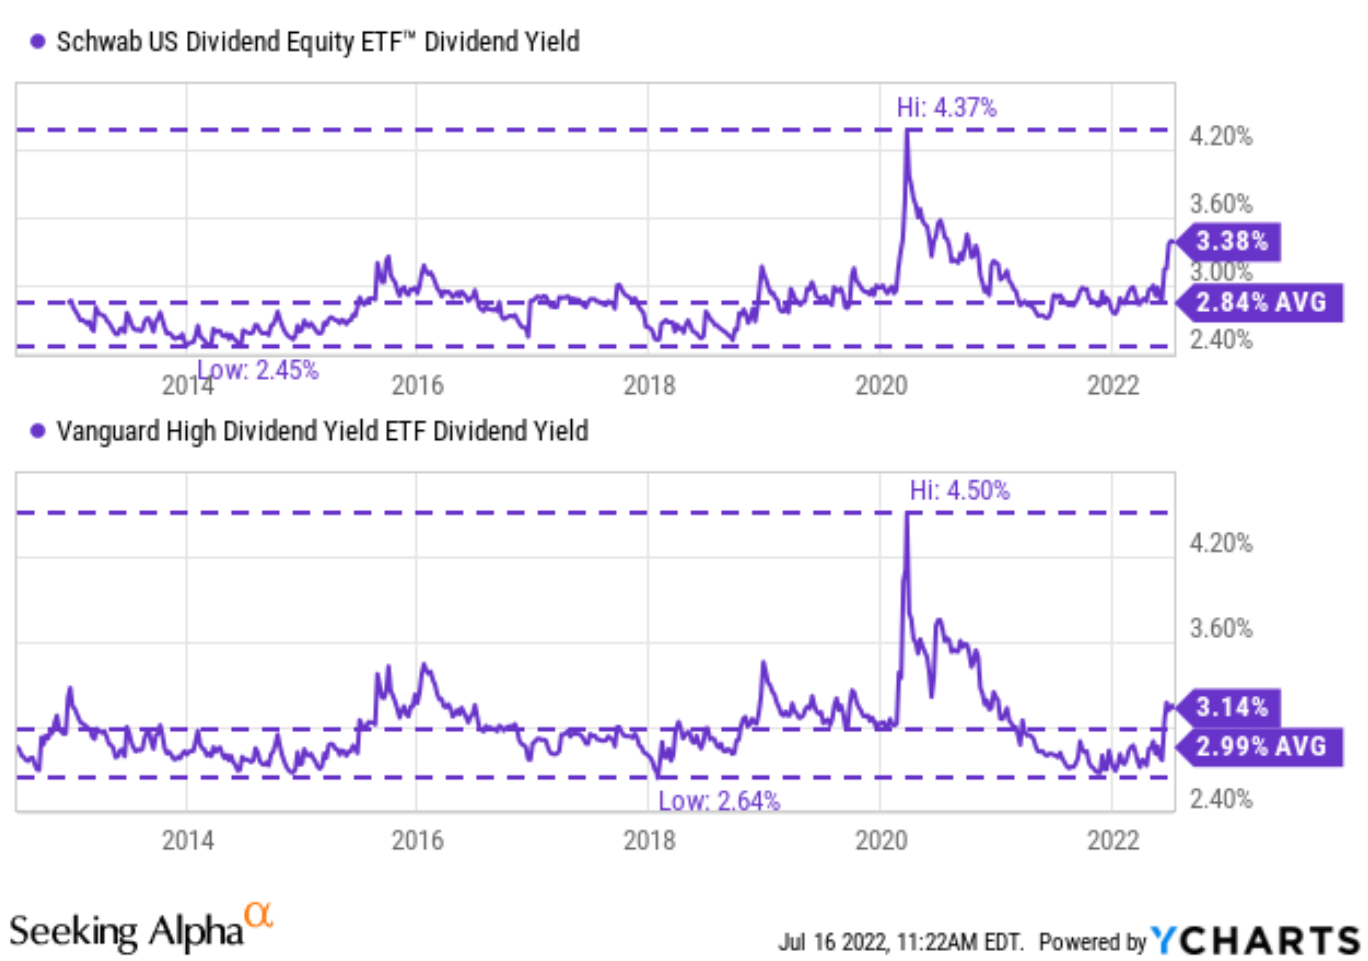
Reasons 3: Off-The-Chart Yield Spread
As aforementioned, SCHD’s dividend yield is current 0.24% above VYM (or 7.6% in relative terms), which seems negligible in absolute terms. However, such an appearance is very misleading. And as you will see, once we put it under historical perspective, the yield spread is quite substantial – the most substantial level in a decade as a matter of fact.
The next chart shows the yield spread between SCHD and VYM in the past decade. Details of the computation of the yield spread have been provided in our earlier article. Dividend yields and yield spread are what we first check before making any investment decisions because of:
- The common PE or Price/cash flow multiples provide partial and even misleading information due to the differences between accounting earnings and owners’ earnings.
- Dividends provide a backdoor to quickly estimate the owners’ earnings. Dividends are the most reliable financial information and least open to interpretation.
- The dividend yield spread (“YS”) is based on a timeless intuition. No matter how times change, the spread ALWAYS provides a measurement of the risk premium investors are paying.
As can be seen, the spread fluctuated in quite a stable and tractable range – which should come as no surprise at all given the two funds’ overall approaches. The YS has been within a range of -0.3% to 0.0% the majority of the time, with an average near -0.15%. And as of this writing, the yield spread is about 0.24% with SCHD yielding 3.38% and VYM yielding 3.14% as aforementioned. The current 0.24% yield spread is not only the highest level seen in a decade, it is literally off the chart.
Author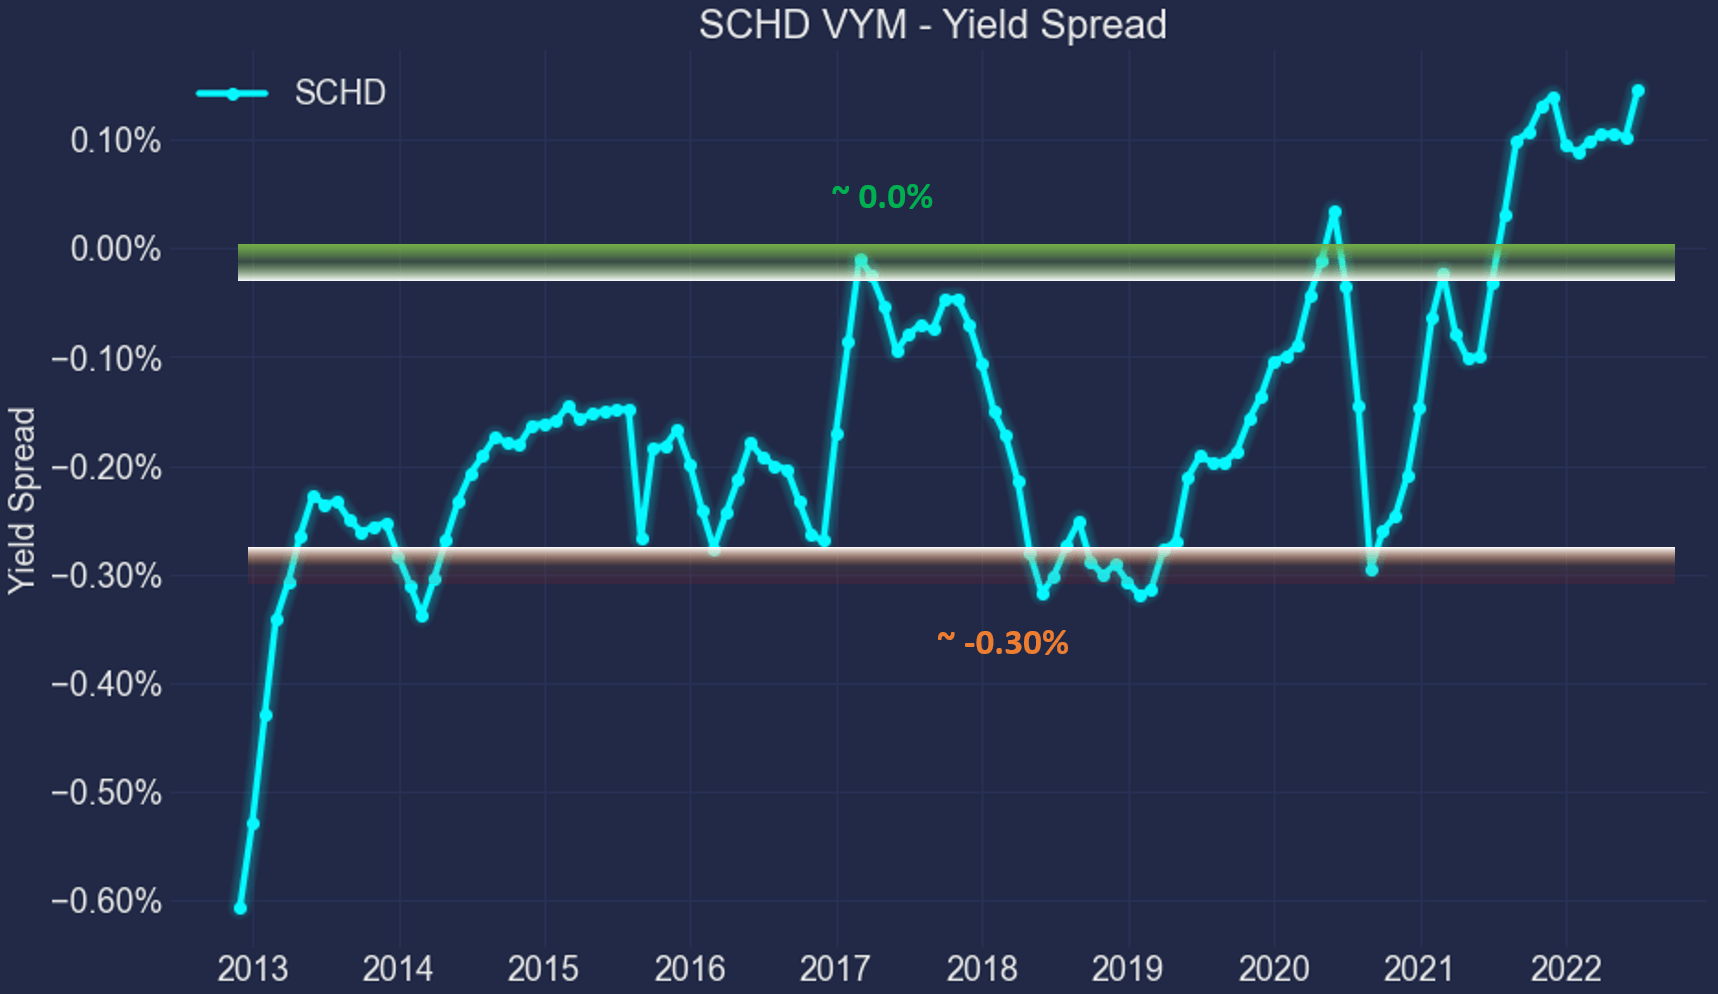
Finally, for readers familiar with our analyses, you know that the short-term returns are closely correlated with the yield spread for funds or stocks that have demonstrated stable earning powers and dividends, such as SCHD and VYM.
This chart shows the 1-year total return (including price appreciation and dividend) from SCHD minus that from VYM when the purchase was made under different yield spreads. In other words, this chart shows the alpha from SCHD relative to VYM at different yield spreads. You can see that there is a clear positive trend and the Pearson correlation coefficient is 0.56 once that one data point in the far left is removed (that was when the funds were just launched and dividends have not stabilized yet). And again, the current 0.24% yield spread is literally off the chart, signaling very favorable odds for positive alpha from SCHD over VYM in the near future.
Author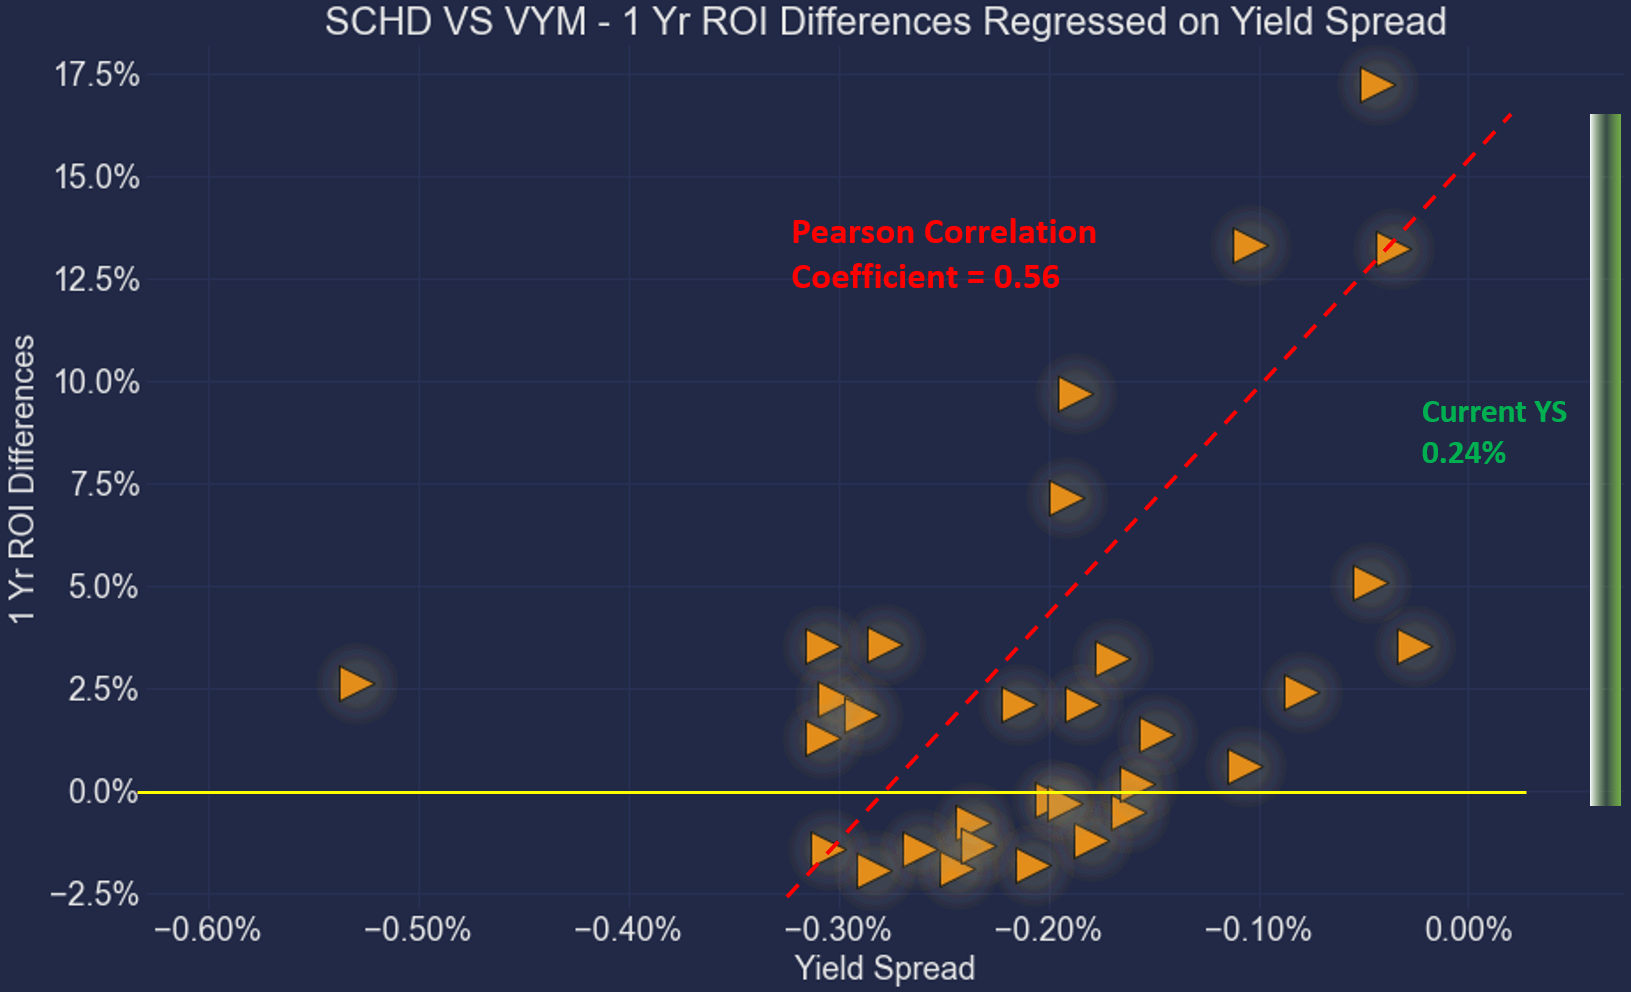
Final Thoughts And Risks
Both SCHD and VYM are popular funds for good reasons – high-quality holdings, low fees, and resilience during turbulent times. Thanks to the recent corrections, both SCHD and VYM are currently in an attractive range. Both are currently yielding above their historical averages.
For investors who are having a hard time deciding which one to pick, this article details my thinking. I prefer SCHD over VYM. And my main reasons are SCHD’s more concentrated holdings (which allows me to understand many of them better), large discount from the historical mean, and the record level of yield spread over VYM. To wit, its current yield % is about 19% above its historical average, compared to about 5% for VYM. Its current yield spread of 0.24% over VYM is literally off the chart.
Finally, there are also arguments against SCHD too. My style of holding a more concentrated fund (or portfolio) might not suit everyone. SCHD did exhibit large volatility in terms of standard deviation, the worst year performance, and drawdowns as mentioned before. Such larger volatility is caused both by the smaller number of holdings and also by the smaller size of the holdings. As you can see, the medium market cap in VYM is $130 billion, close to 2x of that for SCHD. Larger size correlates positively with higher safety and lower volatility. Finally, there are also tax considerations in case your holdings are in a taxed account. SCHD has a small allocation of foreign assets, and its turnover rates (46%) are much higher than VYM (7.7%).
Source: Vanguard.com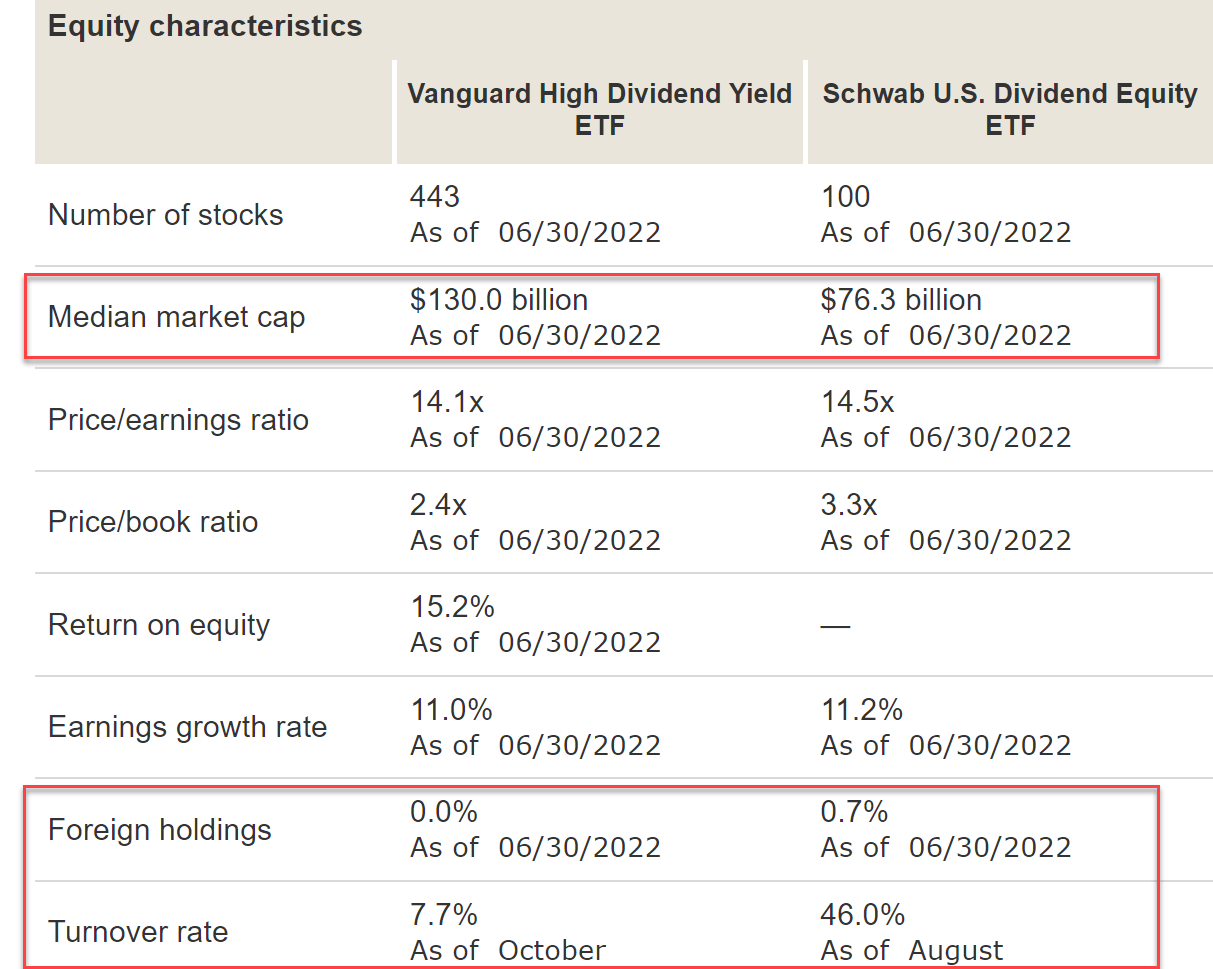
Be the first to comment