

Joe Raedle
For more than a year now, I have been cautiously optimistic on Procter & Gamble (NYSE:PG). Although its premium valuation has caused many investors to stay away, P&G’s best-in-class capital allocation combined with its strong and optimized brand portfolio has made its shares a very strong vehicle for capital preservation.
(…) all that makes Procter & Gamble one of the best capital preservation vehicles over the coming year. (December 2021)
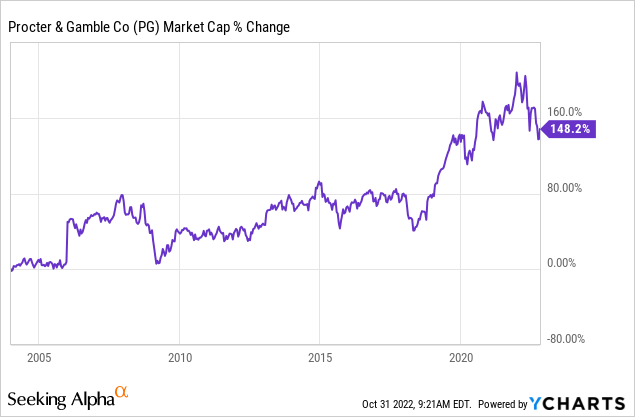
Source: Seeking Alpha
Indeed, since I first covered the company in June of last year, P&G has delivered a positive 4% total return, which compares very favourably against its major peers and the broader equity market, which lost more than 7% during this period.
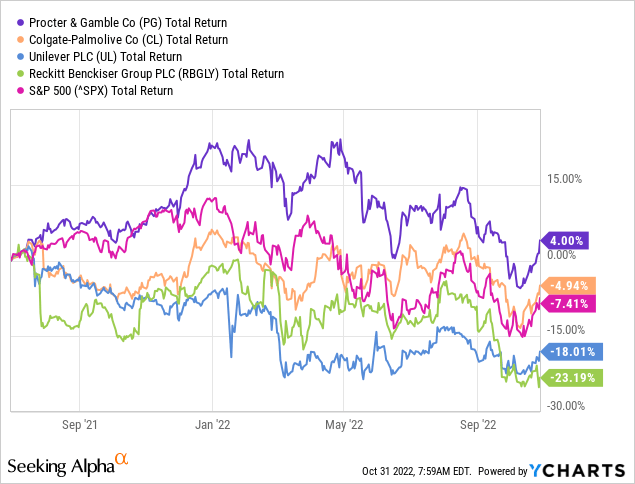
As I noted in my previous analysis, P&G was very attractive for anyone who is more interested in capital preservation at this point as opposed to high risk-reward opportunities.
However, in recent months I have been turning more cautious on the company’s share price and although I am keeping my ‘hold’ rating, the prospects for P&G now appear far less favourable.
The Strong Operating Profitability
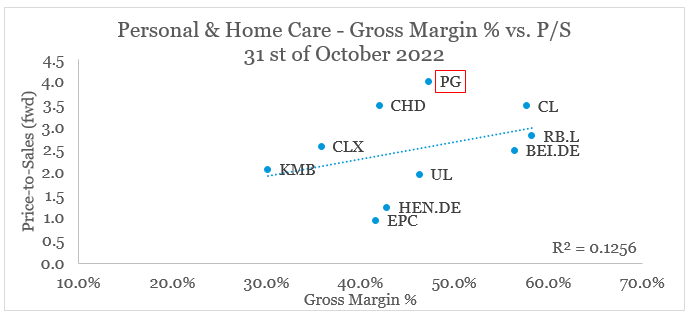
As one of the highest quality businesses, P&G still remains as the company with the highest premium as far as its valuation multiples are concerned.
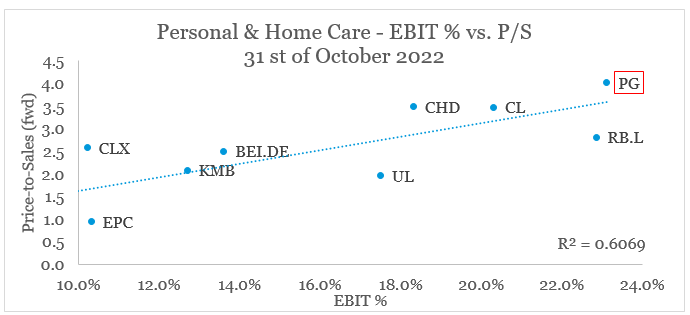
prepared by the author, using data from Seeking Alpha
From the graph above, however, we see that operating profitability is the major factor that supports this premium valuation. Although gross profitability is a major indicator of the overall quality of the brands of these businesses, Procter & Gamble is far from being the leader in that regard.
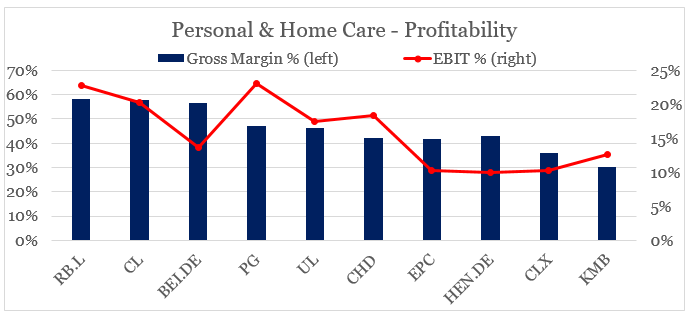
prepared by the author, using data from Seeking Alpha
However, by streamlining its brand portfolio and operations, P&G’s management has managed to gradually reduce the share of fixed costs even as gross profitability has been falling.
This dynamic has also been going in reverse for certain businesses from the peer group which is one reason why we see such a disparity when we substitute operating margins with gross margins in the graph above.
prepared by the author, using data from Seeking Alpha
Another major factor why P&G is so far above the trendline in the chart above, is its strong focus on North America.
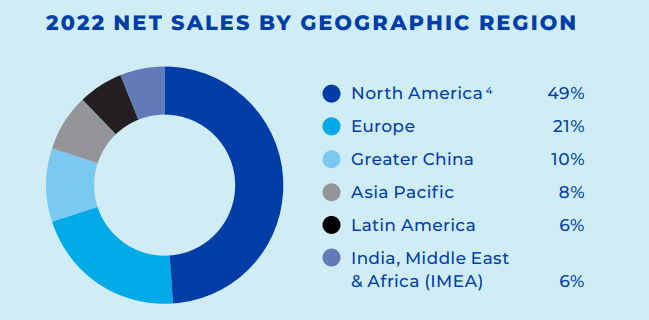
P&G Annual Report
On one hand this also results in a lower share of fixed costs due to geographical concentration, but on the other it also makes P&G less exposed to unfavourable foreign exchange movements. This has also provided a major tailwind for P&G as the U.S. dollar strengthened in recent years.
The Free Cash Flow Perspective
During the past year, however, it has become increasingly clear that these operating efficiencies will come under threat with the focus now shifting to more permanent supply chain issues.
(…) continued high commodity and transportation costs, inflation in the upstream supply chain and in our own operations, accelerating headwinds from foreign exchange, geopolitical issues, COVID disruptions impacting consumer confidence and historically high inflation impacting consumer budgets.
Source: Procter & Gamble Q1 2023 Earnings Transcript (emphasis from author)
With that, working capital requirements will likely remain under pressure and thus providing a sustained headwind for free cash flow.
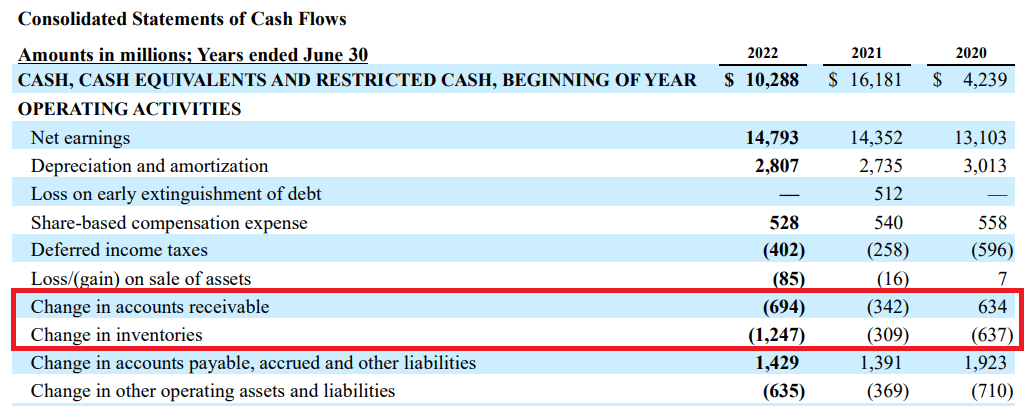
10-K SEC Filing
Even during the most recent quarter, both receivables and inventories still remain a major source of cash outflow which so far P&G is offsetting by stretching its payables.
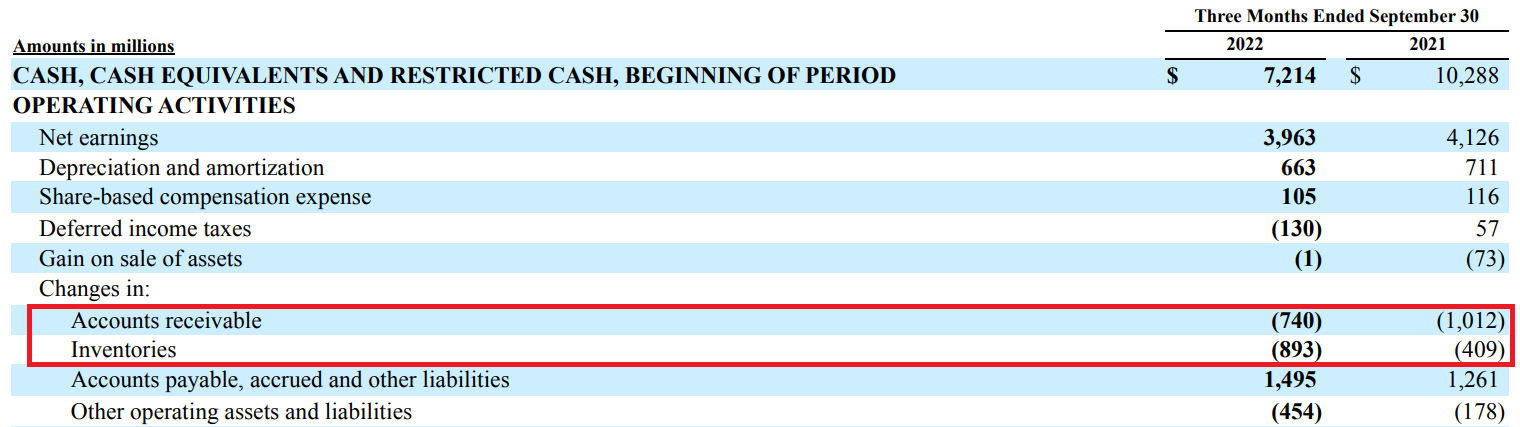
10-Q SEC Filing
This dynamic is hardly a reason to avoid a company and is also something that will continue to affect all global businesses. However, in the case of P&G, the company’s free cash flow has not changed materially since 2008 (see the graph below), while the gap with operating profitability is growing.
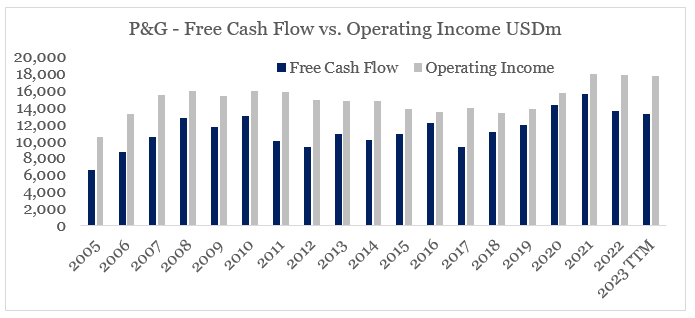
prepared by the author, using data from SEC Filings
The last time the gap was that high, was back in 2017 when P&G was spending a record amount on capital expenditure relative to sales (see the graph below). This time around, however, P&G’s Capital Expenditure remains at near record lows relative to sales.
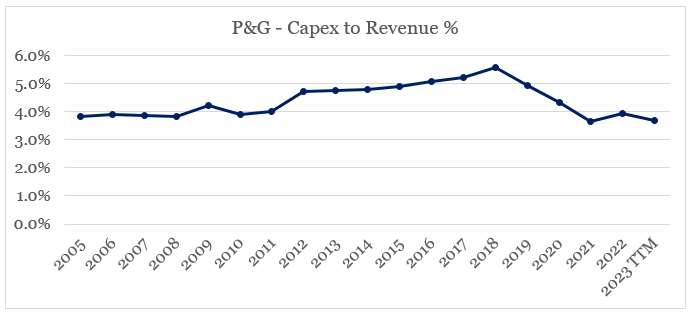
prepared by the author, using data from SEC Filings
This would significantly limit the company’s ability to improve its free cash flow in the coming years, while at the same time the share price does not seem to reflect that.
In other words, the free cash flow yield of P&G is now at record lows while higher business reinvestment needs will limit the company’s ability to improve that. At the same time we should also note that the gap between P&G’s free cash flow yield and the current 10-year bond yields has almost completely disappeared.
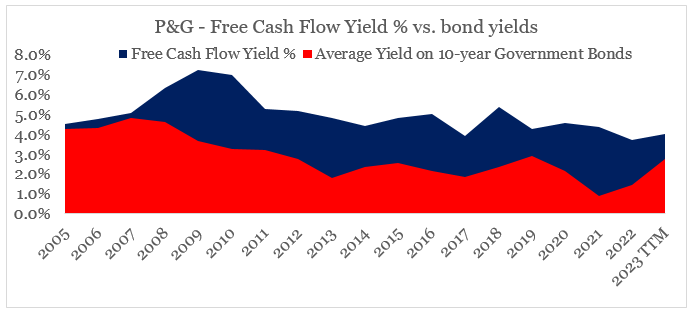
prepared by the author, using data from SEC Filings
With the current yield on the 10-year Treasury standing at slightly above 4% the gap between the two variables above has actually turned negative.
Conclusion
Although, Procter & Gamble will continue to be the global leader in the Personal & Home Care segment, the share price does not offer a high enough potential for future returns to justify a ‘buy’ rating. Operating efficiencies that were paramount for its premium valuation will also come under threat which combined with the need for higher capex will limit the company’s ability to expand free cash flow. As a result, P&G’s expected return is now much lower and does not justify the risks involved.
Be the first to comment