

BrianAJackson
Introduction
I last wrote about Danaher (NYSE:DHR) stock a year ago, on October 20th, 2021, with my article “Taking Profits In Danaher Is Reasonable Here“. It was the only “Sell” article published on Danaher over the past two years on Seeking Alpha. Here are the returns since that article was published:
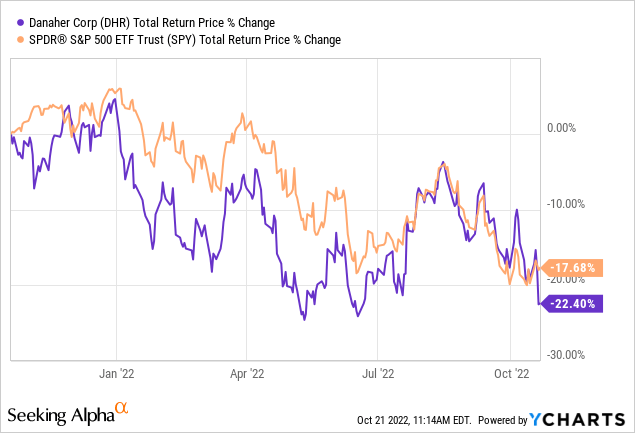
While it was a “Sell” article, I certainly sympathized with Danaher shareholders at the time because both Danaher’s business and stock price had performed well for many years, and there weren’t many alternative places in the market to invest that weren’t also overvalued at the time. As we can see by Danaher’s poor performance this past year, it was indeed overvalued when I last wrote about it, but the stock has only declined a little bit more than the S&P 500 (SPY) since then.
There is an additional danger for Danaher shareholders that I am going to write about today (along with my normal valuation process). That danger is what I call a “boom/bust” danger, and I hadn’t yet recognized it as of the writing of 2021’s Danaher article, but it looks pretty clear to me now as I revisit the stock.
In this article, I will first share my normal valuation process for Danaher, and then I will make adjustments for the current boom/bust risk.
My Valuation Method For Danaher
The valuation method I use for Danaher first checks to see how cyclical earnings have been historically. Once it is determined that earnings aren’t too cyclical, then I use a combination of earnings, earnings growth, and P/E mean reversion to estimate future returns based on previous earnings growth and sentiment patterns. I take those expectations and apply them 10 years into the future, and then convert the results into an expected CAGR percentage. If the expected return is really good, I will buy the stock, and if it’s really low, I will often sell the stock. In this article, I will take readers through each step of this process.
Importantly, once it is established that a business has a long history of relatively stable and predictable earnings growth, it doesn’t really matter to me what the business does. If it consistently makes more money over the course of each economic cycle, that’s what I care about – numbers over stories.
FAST Graphs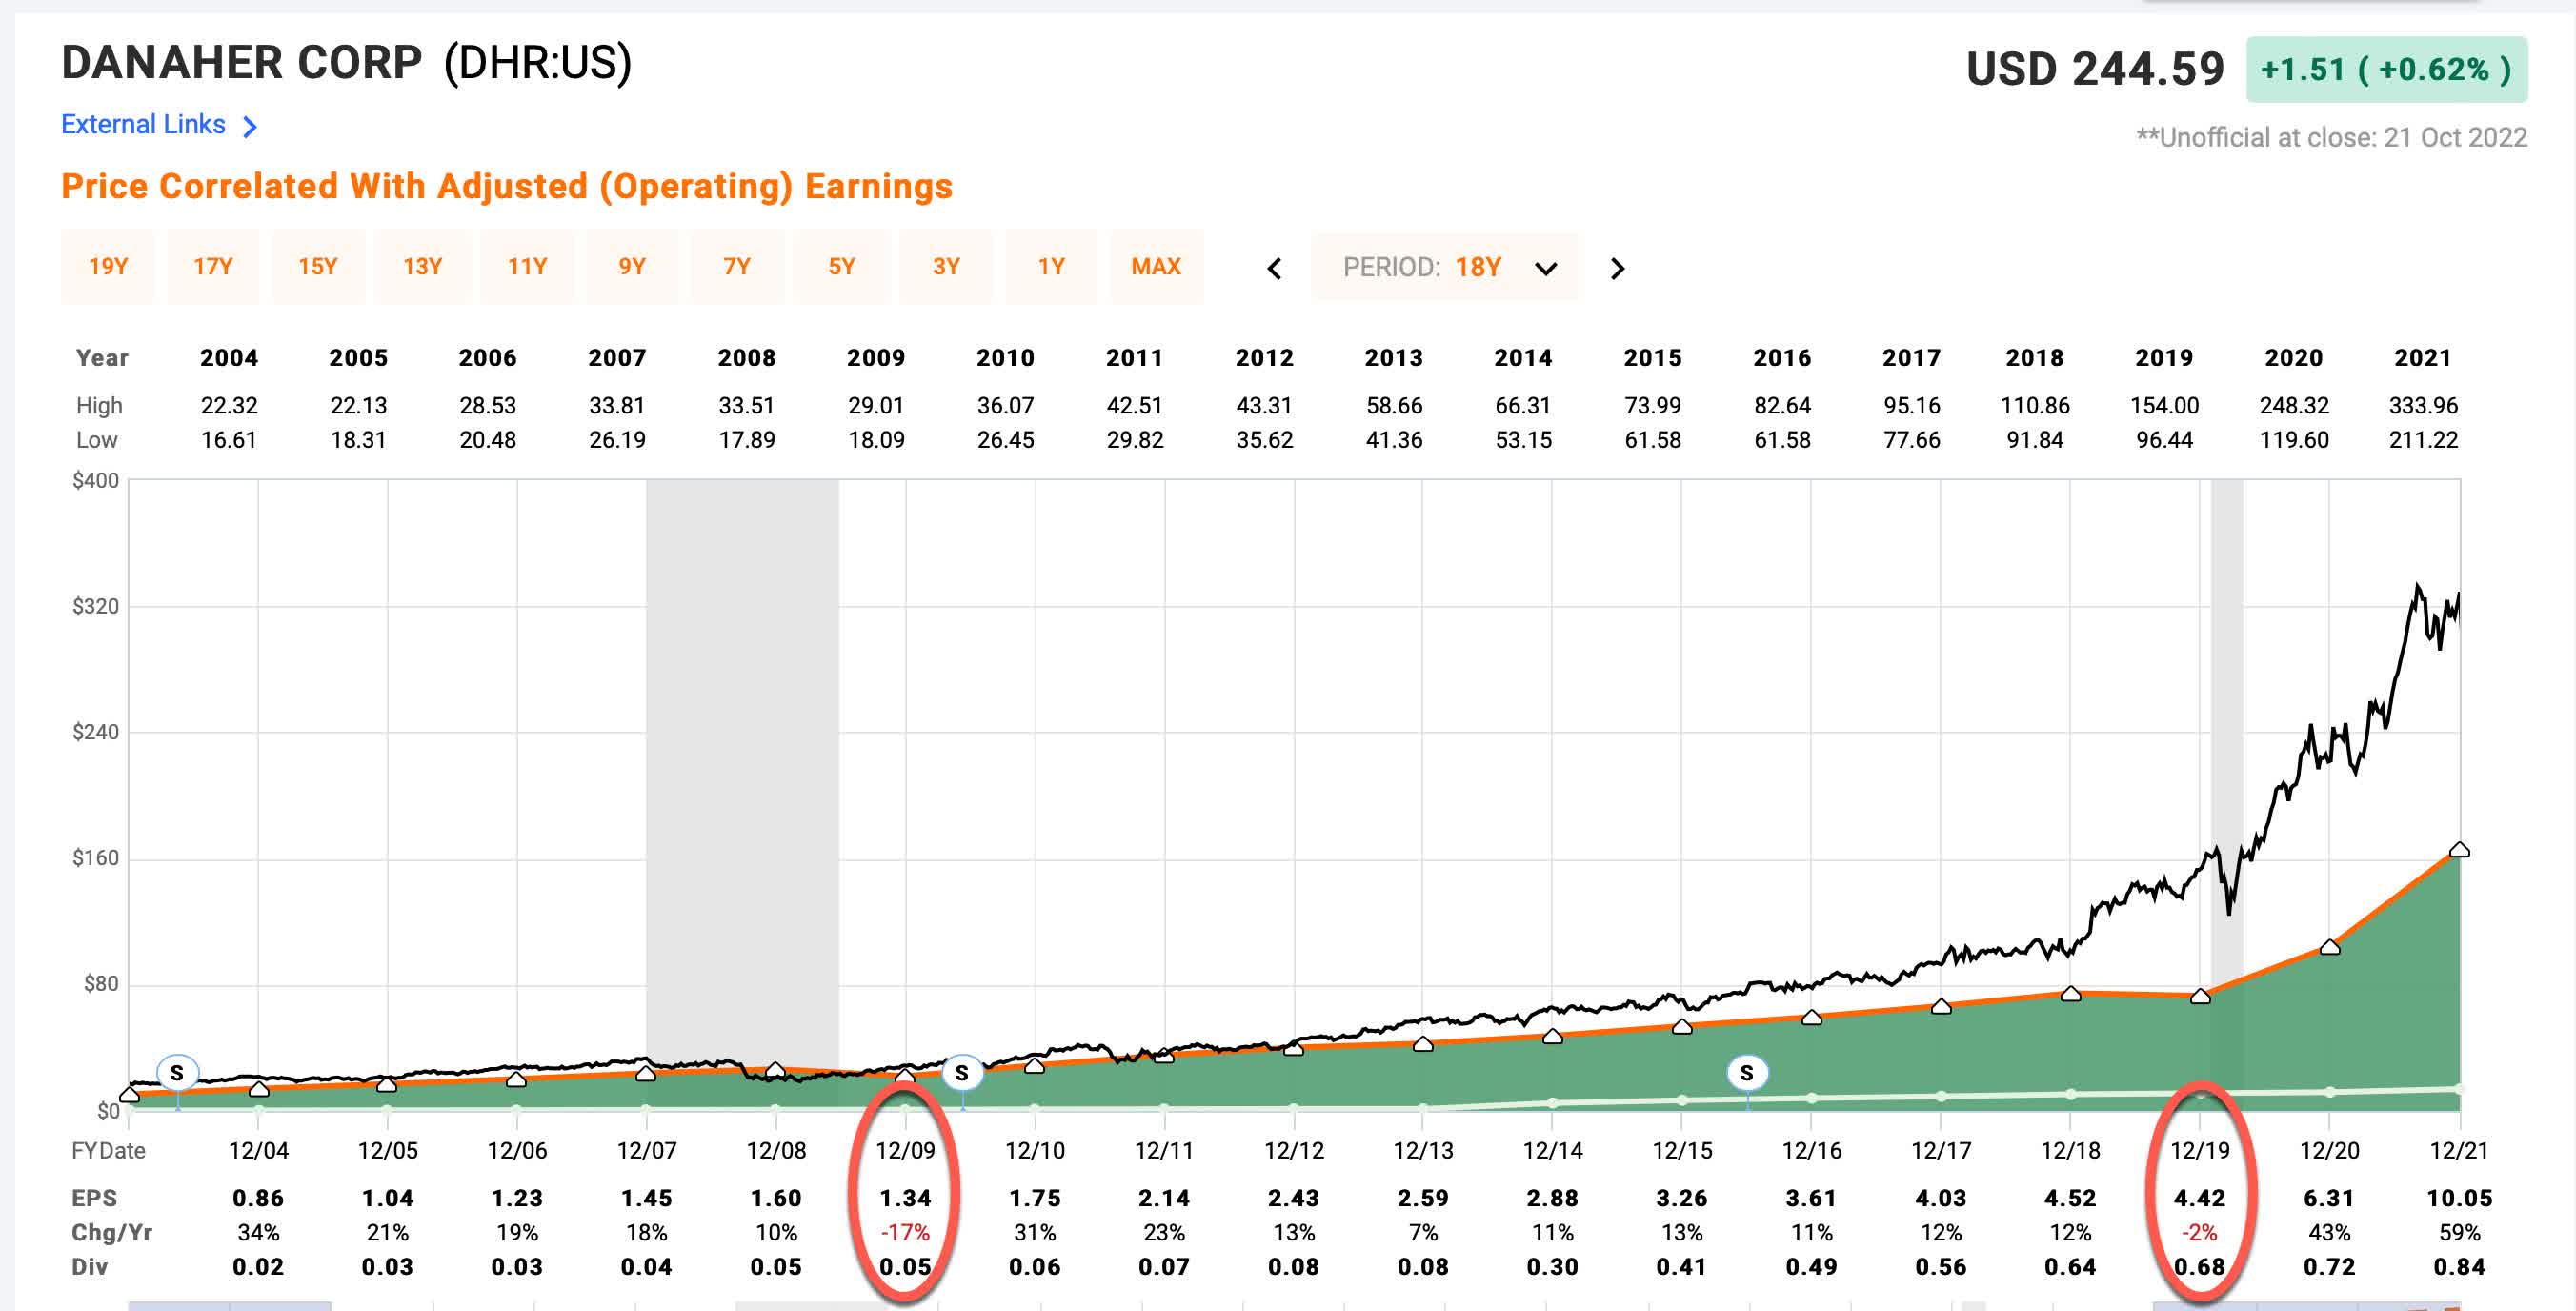
Since 2004, Danaher has only experienced two years of negative EPS growth, once in 2009, when EPS fell -17%, and again in 2019 when it fell -2%. I would classify this as a low-to-moderately cyclical business. Based on that, it is appropriate to use a fundamental analysis using earnings to value the stock, and that’s what I’ll do in this article. (If earnings had been more cyclical, I would use a different valuation technique.)
Danaher Stock – Market Sentiment Return Expectations
In order to estimate what sort of returns we might expect over the next 10 years, let’s begin by examining what return we could expect 10 years from now if the P/E multiple were to revert to its mean from the previous economic cycle. For this, I’m using a period that runs from 2015-2022.
FAST Graphs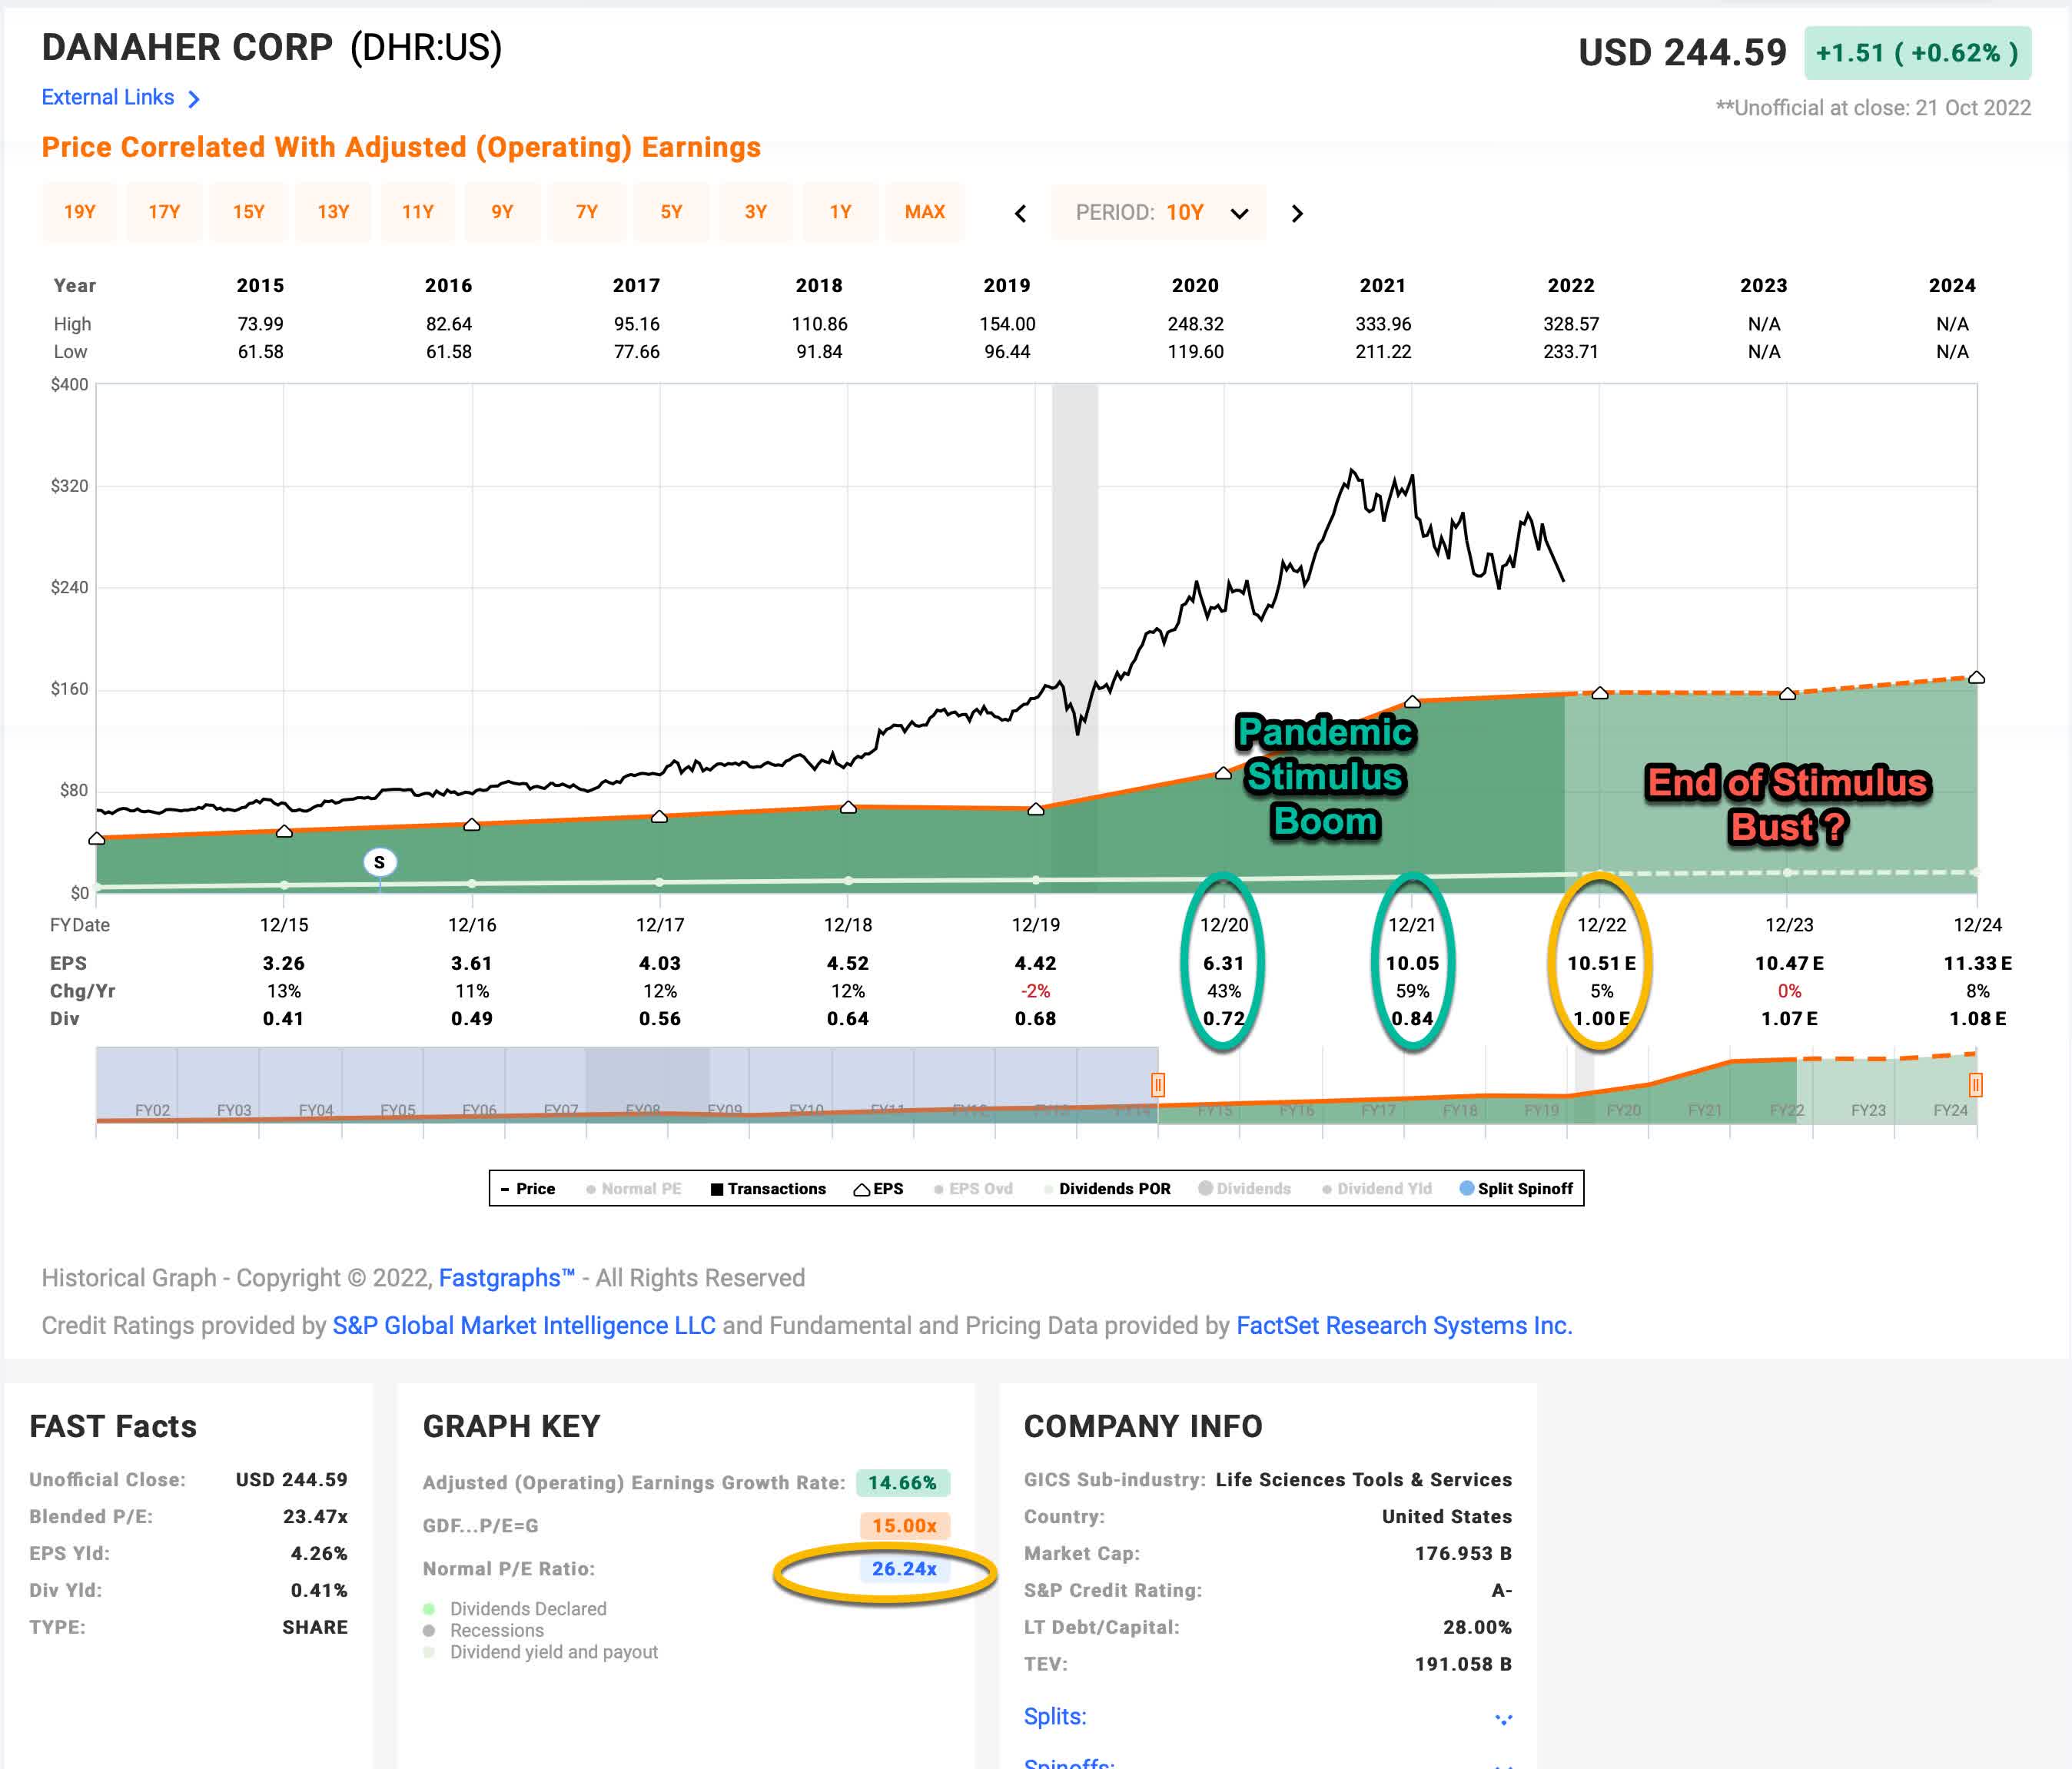
Danaher’s average P/E from 2015 to the present has been about 26.24 (the blue number circled in gold near the bottom of the FAST Graph). Using 2022’s forward earnings estimates of $10.51 Danaher has a current P/E of 23.27. If that 23.27 P/E were to revert to the average P/E of 26.24 over the course of the next 10 years and everything else was held the same, DHRs price would rise and it would produce a 10-Year CAGR of +1.21%. That’s the annual return we can expect from sentiment mean reversion if it takes 10 years to revert. If it takes less time to revert, the return would be higher.
Business Earnings Expectations
We previously examined what would happen if market sentiment reverted to the mean. This is entirely determined by the mood of the market and is quite often disconnected, or only loosely connected, to the performance of the actual business. In this section, we will examine the actual earnings of the business. The goal here is simple: We want to know how much money we would earn (expressed in the form of a CAGR %) over the course of 10 years if we bought the business at today’s prices and kept all of the earnings for ourselves.
There are two main components of this: the first is the earnings yield and the second is the rate at which the earnings can be expected to grow. Let’s start with the earnings yield (which is an inverted P/E ratio, so the Earnings/Price ratio). The current earnings yield is about +4.30%. The way I like to think about this is, if I bought the company’s whole business right now for $100, I would earn $4.30 per year on my investment if earnings remained the same for the next 10 years.
The next step is to estimate the company’s earnings growth during this time period. I do that by figuring out at what rate earnings grew during the last cycle and applying that rate to the next 10 years. This involves calculating the historical EPS growth rate, taking into account each year’s EPS growth or decline, and then backing out any share buybacks that occurred over that time period (because reducing shares will increase the EPS due to fewer shares).
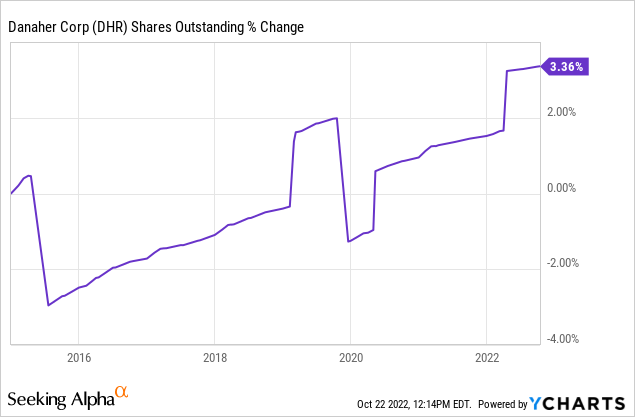
Danaher’s shares outstanding have actually risen over this time period, so we don’t need to make any adjustments for those. I get an estimated earnings growth rate for Danaher during this period of +17.28%, which is extremely good.
Next, I’ll apply that growth rate to current earnings, looking forward 10 years in order to get a final 10-year CAGR estimate. The way I think about this is, if I bought Danaher’s whole business for $100, it would pay me back $4.80 plus +17.28% growth the first year, and that amount would grow at +17.28% per year for 10 years after that. I want to know how much money I would have in total at the end of 10 years on my $100 investment, which I calculate to be about $214.41 including the original $100. When I plug that growth into a CAGR calculator, that translates to a +7.93% 10-year CAGR estimate for the expected business earnings returns.
10-Year, Full-Cycle CAGR Estimate
Potential future returns can come from two main places: market sentiment returns or business earnings returns. If we assume that market sentiment reverts to the mean from the last cycle over the next 10 years for Danaher, it will produce a +1.21% CAGR. If the earnings yield and growth are similar to the last cycle, the company should produce somewhere around a +7.93% 10-year CAGR. If we put the two together, we get an expected 10-year, full-cycle CAGR of +9.14% at today’s price.
My Buy/Sell/Hold range for this category of stocks is: above a 12% CAGR is a Buy, below a 4% expected CAGR is a Sell, and in between 4% and 12% is a Hold. A +9.14% expected CAGR makes Danaher stock a “Hold” using these assumptions and means it’s roughly fairly valued here. However, I think it’s reasonable to think these estimates might be too optimistic. Danaher benefitted greatly during 2020 and 2021 when pandemic stimulus money was being pumped into the economy and the pandemic was raging around the globe. It’s highly likely that when the stimulus and pandemic have fully ended in 2023 that Danaher’s earnings, along with the wider economy, will suffer. So, in the next section, I will make some adjustments for this likelihood.
Pandemic Boom/Bust Adjustments
In the 7 years leading up to 2020 Danaher’s earnings growth was about 9%. Then in 2020 earnings grew 43% and in 2021 earnings grew another 59%. By the end of 2022, Danaher’s earnings are expected to be more than double what they were in 2019. I think it’s reasonable to assume earnings will fall back down to the previous trend over the next two years since stimulus will have ended and we will likely be entering a recession.
FAST Graph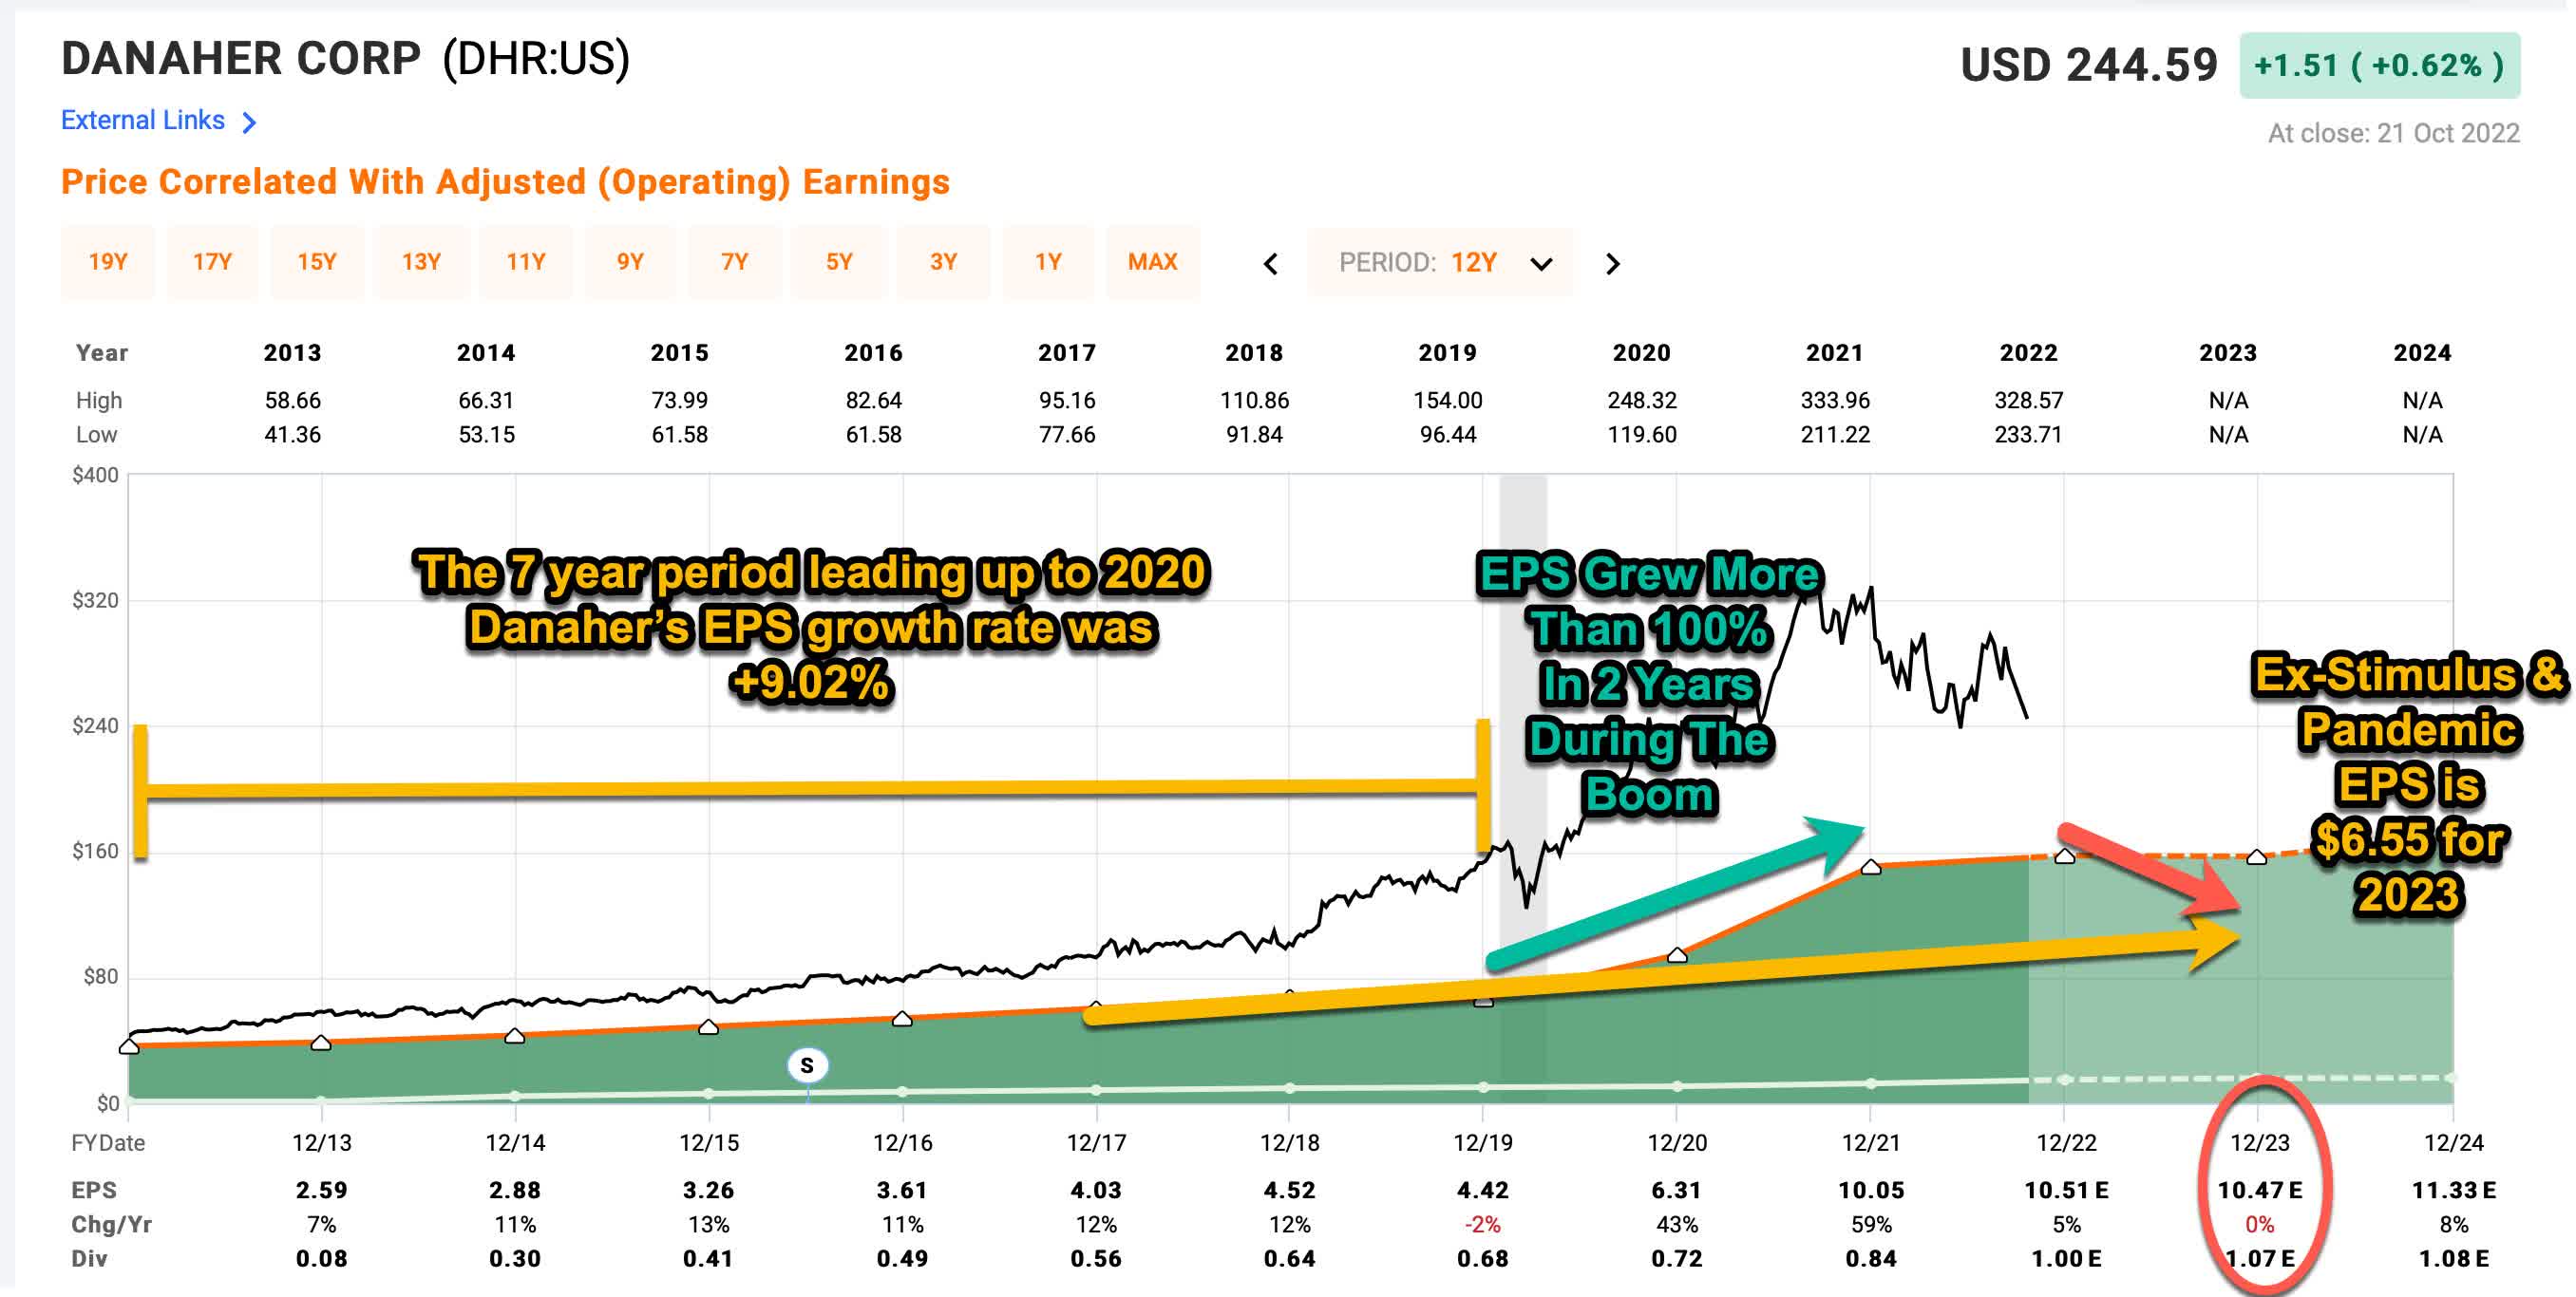
What I have done is model out what Danaher’s earnings would have been if the pre-pandemic trend would have continued from 2019 for three years into 2023, and then I assume earnings fall to that level next year. Next, I’ll run the numbers and examine the valuation of the stock again using these assumptions.
I start by taking the $4.42 per share DHR earned in 2019 and growing it at a 9% rate for three years. Since we’ve had some inflation, I’ll add another 5% per year for inflation and assume some of the inflation is sticky. After doing that, I get an ex-stimulus/pandemic-adjusted 2023 EPS estimate of $6.55 per share (much lower than the $10.47 analysts currently project). I will take that expectation and then model it out over 10 years, growing at a 9% rate, and see what the valuation looks like then. Using those assumptions, I get a Mean Reversion CAGR of -3.47% and a Business CAGR of +3.74%, for a 10-Year CAGR expectation of +0.28%. This is well below the 4% threshold I use as a selling threshold.
Conclusion
Sometimes reasonable investors buy the stock of a good business and miss important aspects of risk associated with the stock. There isn’t anything wrong with Danaher’s business (just as there wasn’t anything wrong last year at this time before the stock price dropped -20%). But currently, investors are probably far too optimistic about 2023 and 2024’s earnings. Even absent a recession, the stimulus money will be finished and the pandemic will be endemic by next year. I think it’s very reasonable to assume that Danaher’s earnings trend is likely to revert somewhere close to its long-term average. And when we use earnings estimates based on the longer-term earnings trajectory, this stock has a lot of near-term downside potential and not much long-term upside potential. It seems very reasonable to sell and find a stock that doesn’t have as much risk, or, at least the potential of more reward than Danaher does at today’s price.
Be the first to comment