

pcess609/iStock via Getty Images
Inflation has caused the Fed to use all, in its power, to slow the overheated economy, thus creating a bear market in leading indicators like the Dow Index (NYSEARCA:DIA). The DIA sees a recession coming. Meanwhile, consumers are still spending and employment is very strong.
There is no sign of a recession yet. Housing has turned down. Inflation is bothering the consumer. Workers are demanding pay increases. High gasoline prices have dropped. Loans for cars are more expensive. However, employment is very strong and consumers are ready to spend, as usual, during the holidays.
Why Is There A Bounce In The Market?
Any hopeful, positive narratives create technical bounces in a bear market. Currently, the DIA is experiencing such a bounce. You can see Demand improving for stocks in the Dow Index on our list below. You can also see the bounce on the DIA chart below reaching the 50-day, downtrend, moving average, currently at $311.
How High Is This Bounce Going?
The two big questions are how long will the bounce last and how high will it go on the DIA? The last big bounce reached all the way up to test the 200-day moving average, before diving back down into its bear market looking for a bottom. We don’t think this technical bounce, caused by a short squeeze and other technical, market factors, will reach the 200-day which is a much higher price at $325.
Timing is the more difficult question to answer. Earnings season is in full swing and companies are beating lowered earnings expectations. CEOs are preparing for a recession and watching headcount. They are raising prices to cover increased costs, if they have that option. Others are having their margins squeezed and earnings are falling. The PE, applied to Dow earnings to determine valuation, is falling. Estimated earnings are a lagging indicator and the last thing to fall.
With earnings coming in as expected and the consumer ready to spend for the holidays, the market drop may pause until after the holidays. The Fed’s 75 basis point increase in November is already priced into the market, so that won’t come as a shock. The narrative that the Fed is going to pivot will be replayed until it is proven wrong by the next Fed increase in rates, after November.
When Will This Bounce End?
Considering these factors, we see this short term bounce continuing for a few weeks. After the good holiday sales in November, and after earnings, we think the bounce is over. In January we think the market will be looking for that bear market bottom again, as a recession in 2023 becomes more obvious and the Fed fails to pivot. For that reason, we are looking to buy January puts, deep out of the money, when we see the Sell Signal on the Dow.
What Stocks Look Good In The Dow?
We look at each of the 30 stocks in the Dow to come to our conclusions using both fundamentals and technicals to determine our most important Buy/Hold/Sell signal shown in the SID column of the report below. As you can see, only two stocks have our SID Buy Signal and they are Chevron (CVX) and Merck (MRK). We also like UnitedHealth (UNH) and just added that to our 2023 Model Portfolio. It has SID score of 79 where 80 to 100 is a Buy Signal.
We also like stocks that have a Buy Signal in the Fund column and a Hold Signal in the SID column. They are Travelers (TRV), JPMorgan (JPM), Home Depot (HD) and Johnson & Johnson (JNJ).
Which Stocks Have Demand Moving Price Higher?
You can see Demand taking prices higher for 20 of the Dow stocks. These are identified in the D:S column. You can see TRV is color coded green with a D7 rating out of a possible 9. This tells us that buyers were chasing this stock. You can also see that 11 stocks have our short term, technical buy signal in the Tech column. These signals are indicative of this type of short term bounce, that fails to produce more Buy Signals in our SID column. That confirms for us that this is only a bounce in a bear market.
At the bottom of the list you can see 6 stocks that have our Sell Signal. On a price weighted basis, this is 8.5% of the Dow. We expect this to increase by the end of January as the Fed fails to pivot and a recession becomes more obvious to the market, if not the consumer.
Where Is This Market Going Longer Term?
The DIA chart below shows us what the summation of each of the Dow stocks is telling us. This is a technical bounce in a bear market. It has reached the price resistance at $312-$316. We don’t think it can make it to $325 and the 200-day, long term downtrend that defines this as a bear market. We expect this bounce to fail, like the last one and price to dive to find the bottom of this bear market.
Here is the Dow list of 30 stocks with our Buy/Hold/Sell Signal for each stock shown in the SID column on the right side of the page:
Dow Stocks With Demand Bounce The DIA (StocksInDemand.com)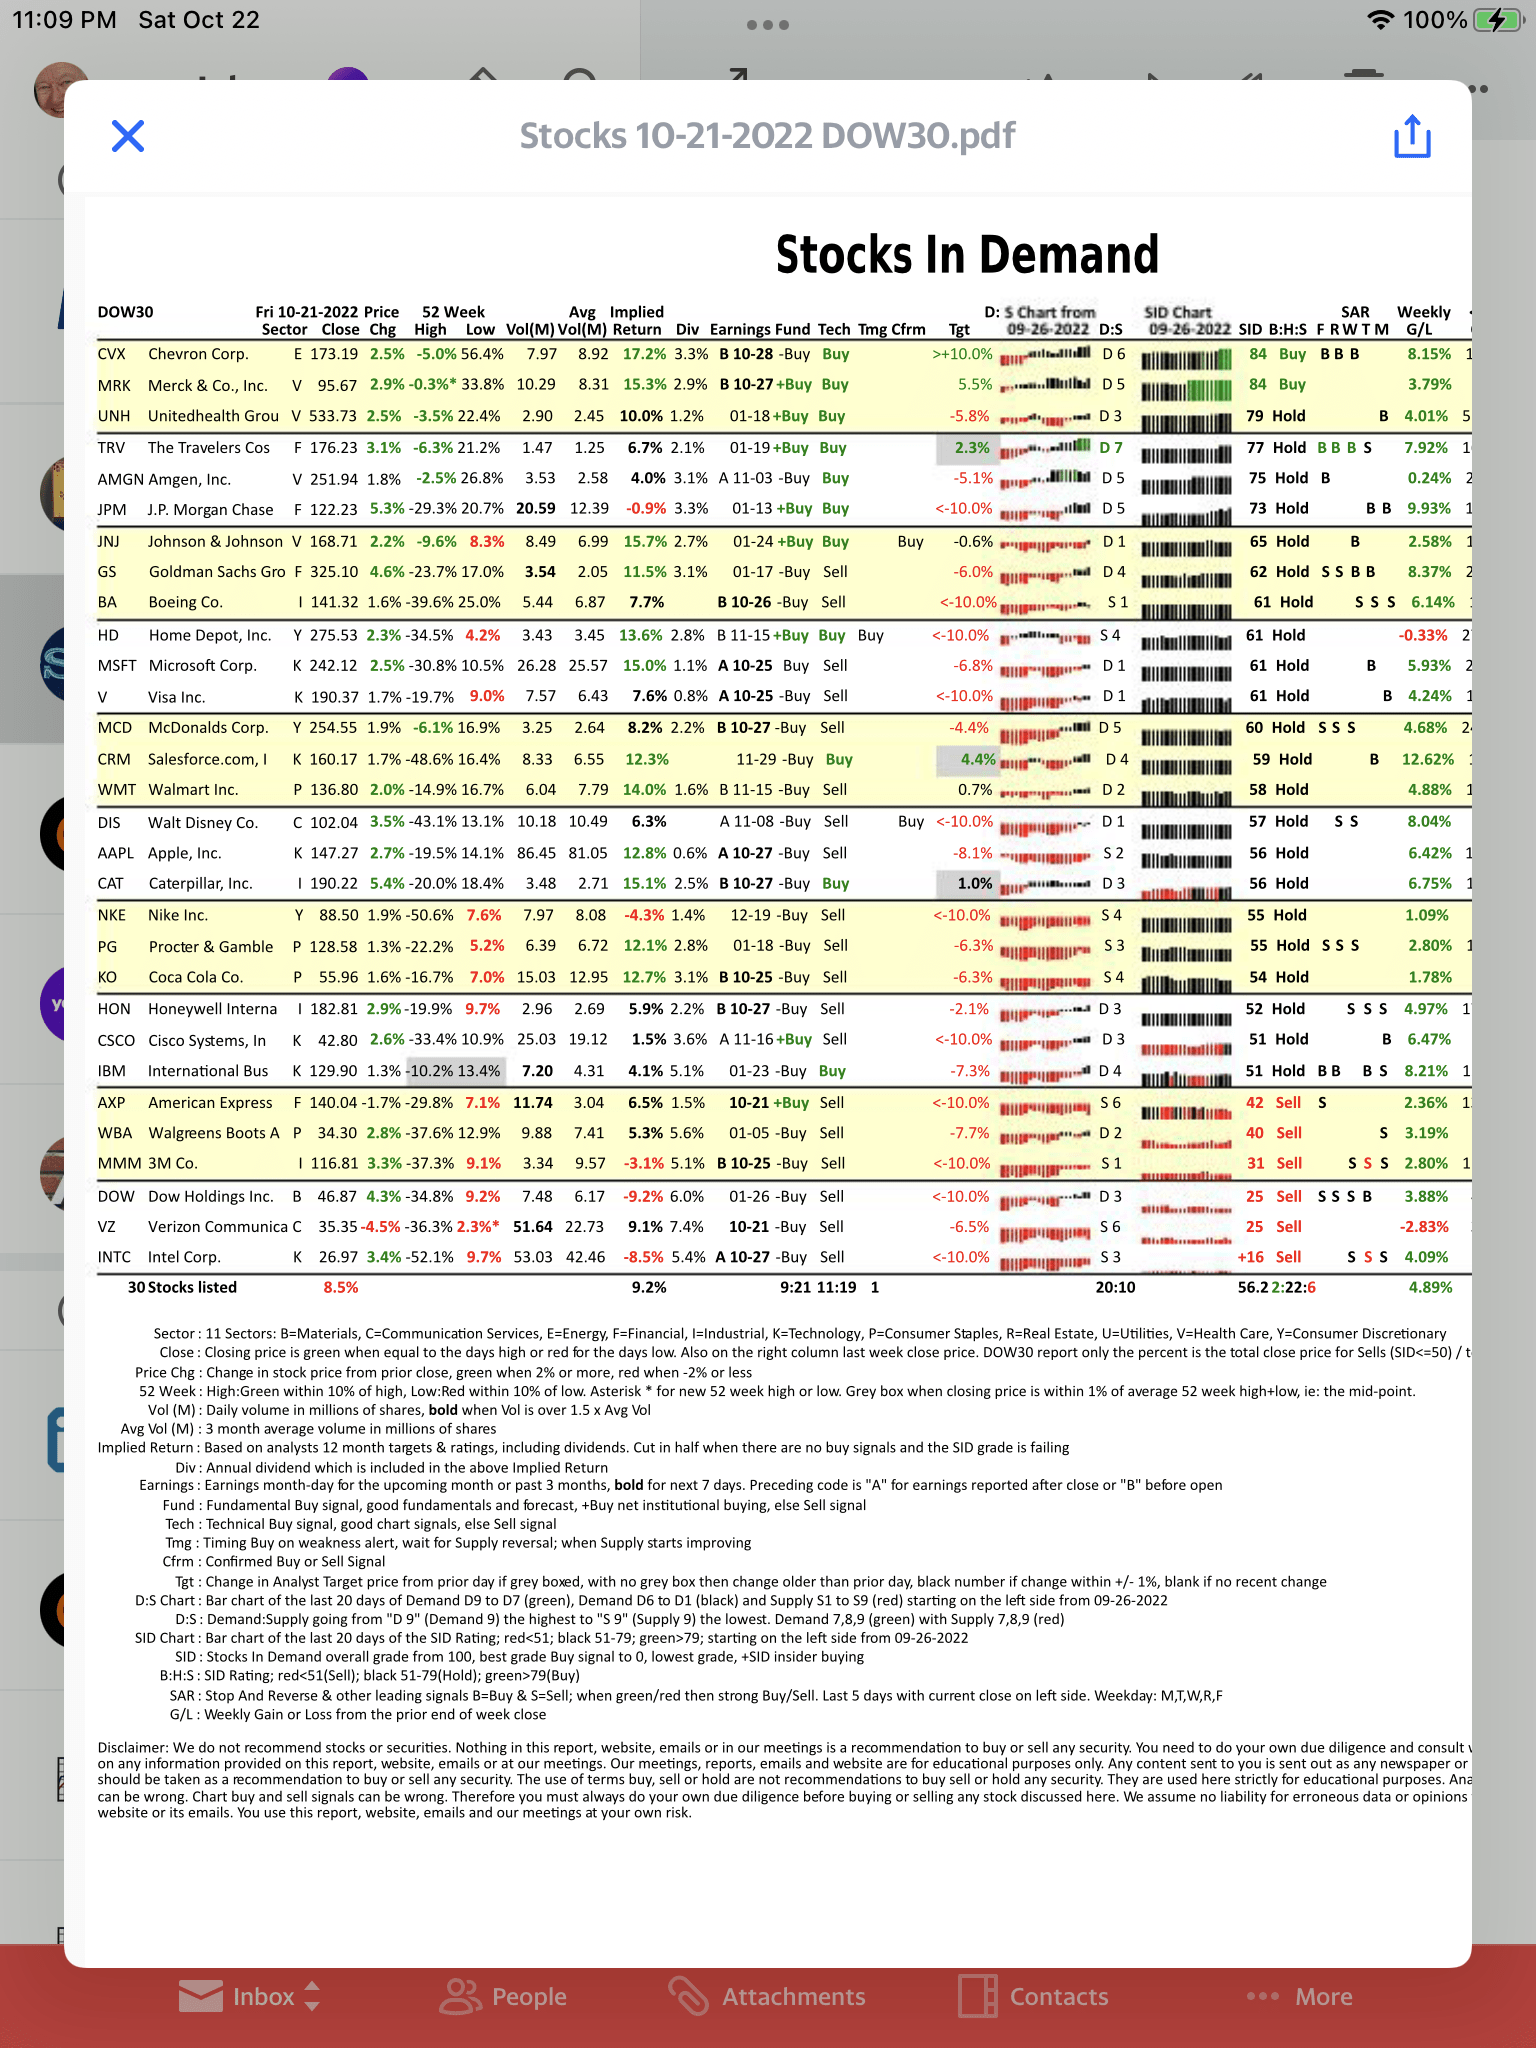
Here is our DIA chart showing the bounce in a bear market reaching the 50-day downtrend and trying to reach the 200-day downtrend, like last time:
DIA At 50-Day Downtrend, Targeting 200-day? (StockCharts.com)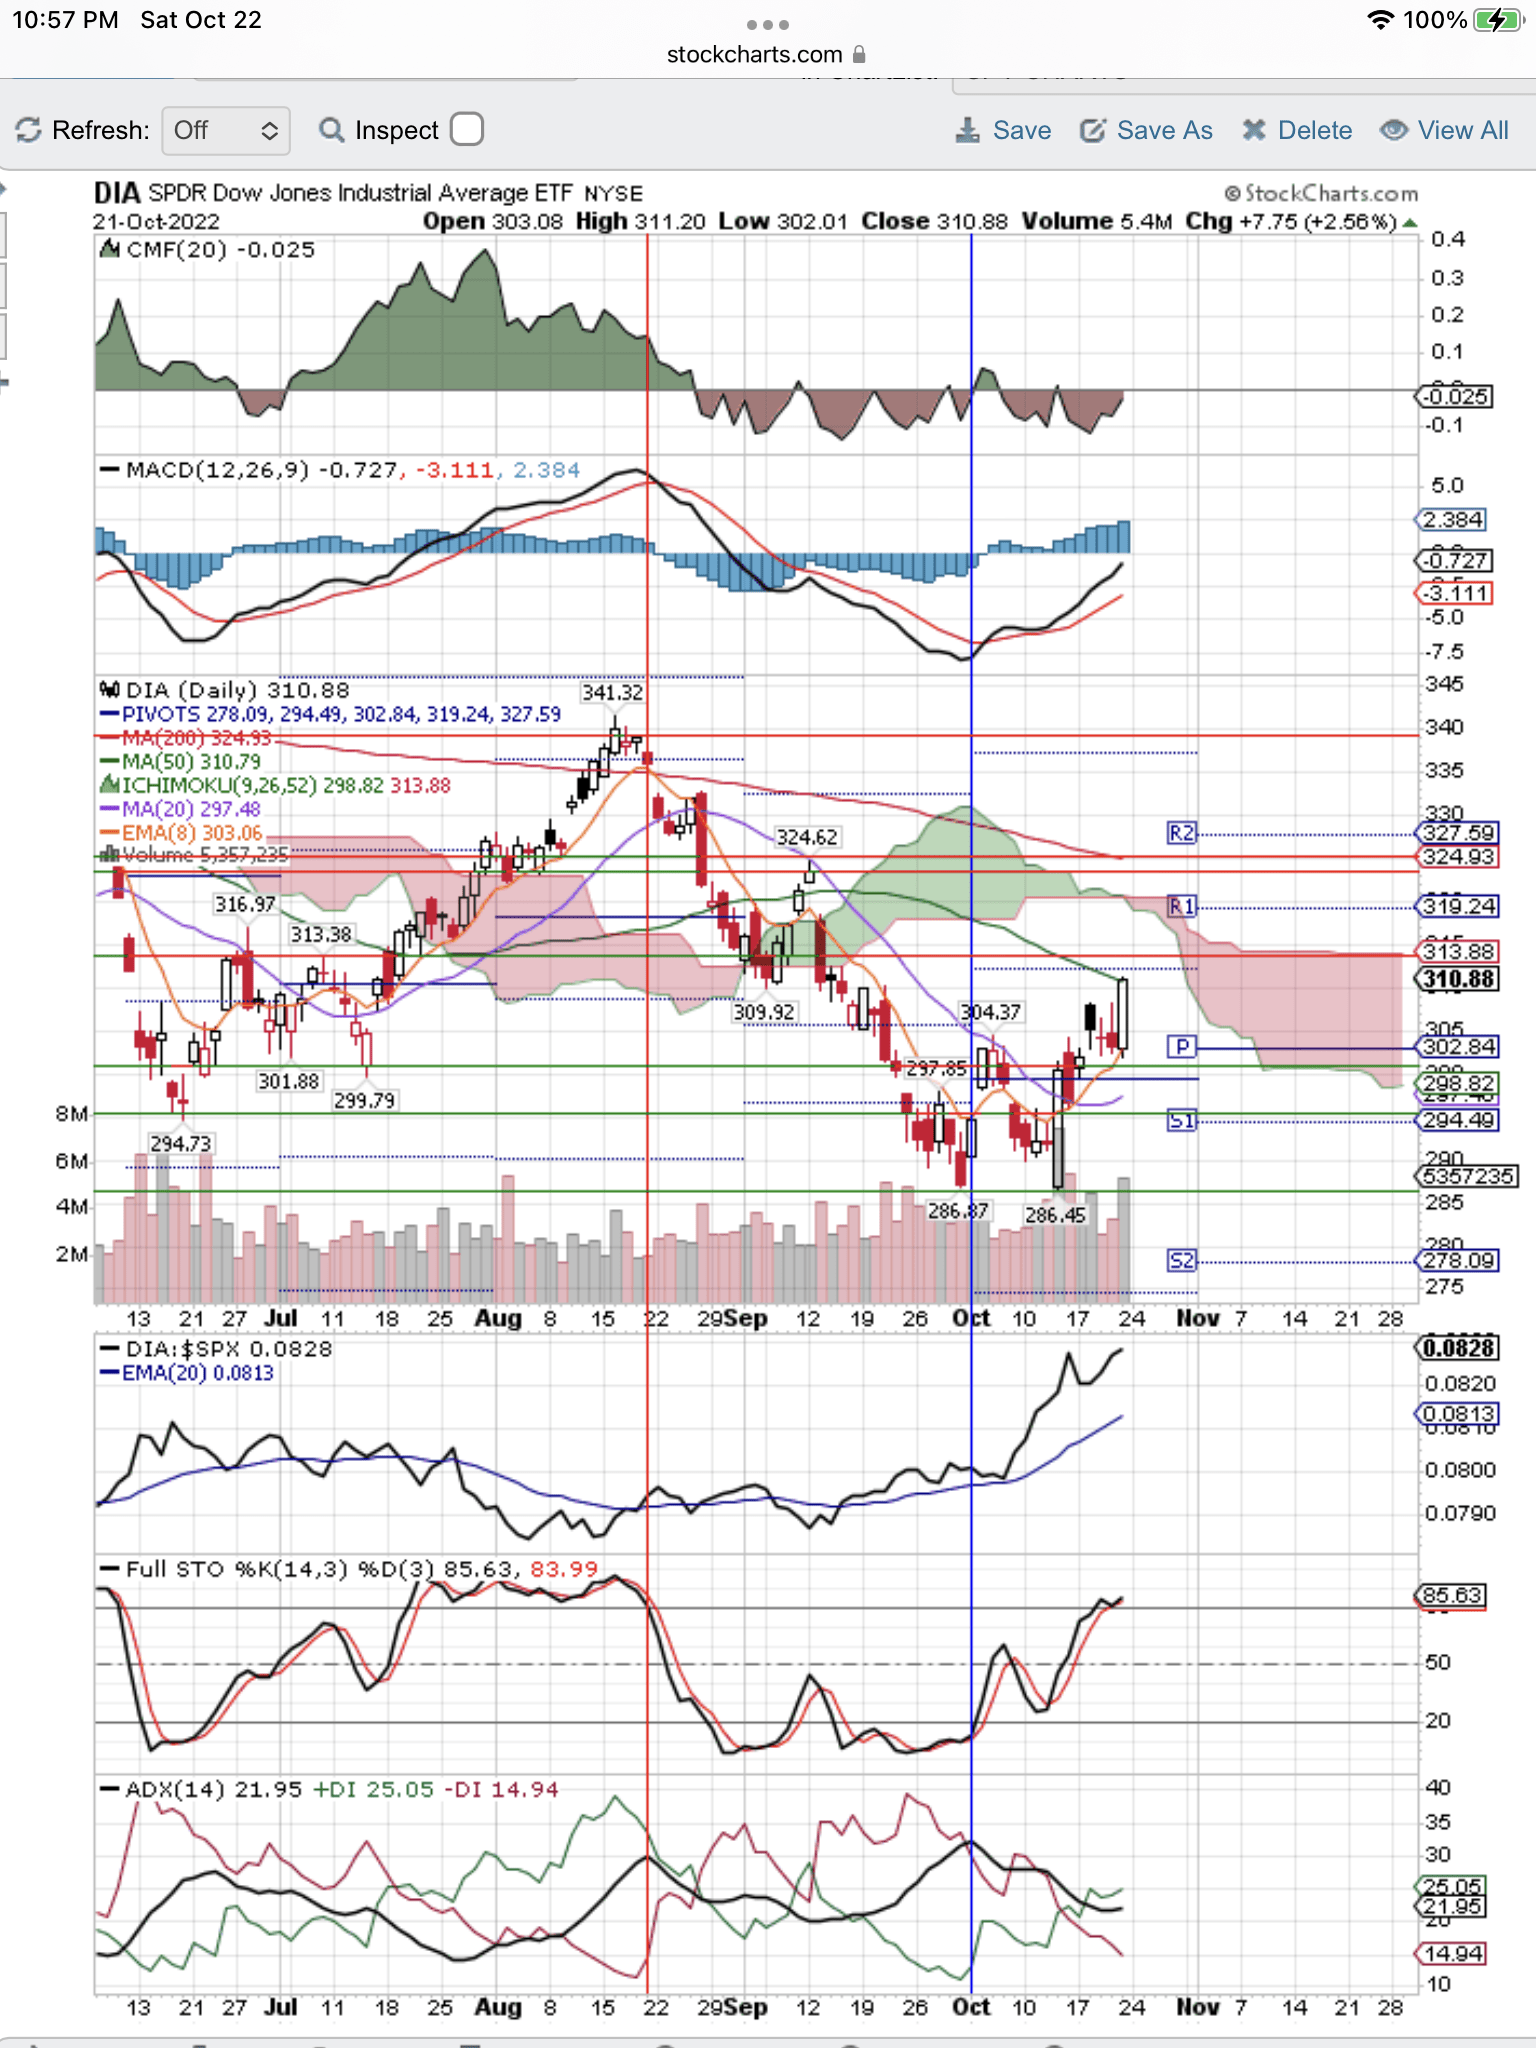
Be the first to comment