

shapecharge
If you’re nervous about your retirement portfolio, you’re not alone. We face a near-perfect storm of fear, uncertainty, and doubt right now.
- The highest inflation in 40 years might not peak until 10% or even 11%
- we’ve now had consecutive quarters of negative GDP growth, a technical recession
- the Fed is hiking at the fastest rate in 40 years
- the bond market is pricing in an actual recession starting in January 2023
- corporate earnings estimates are falling by the week
- blue-chip economist teams think the market might bottom anywhere from -24% (June 16th) to -52% (40% lower from here)
But guess what? Unless this is the actual apocalypse, every market challenge is followed by investor heaven.
Charlie Bilello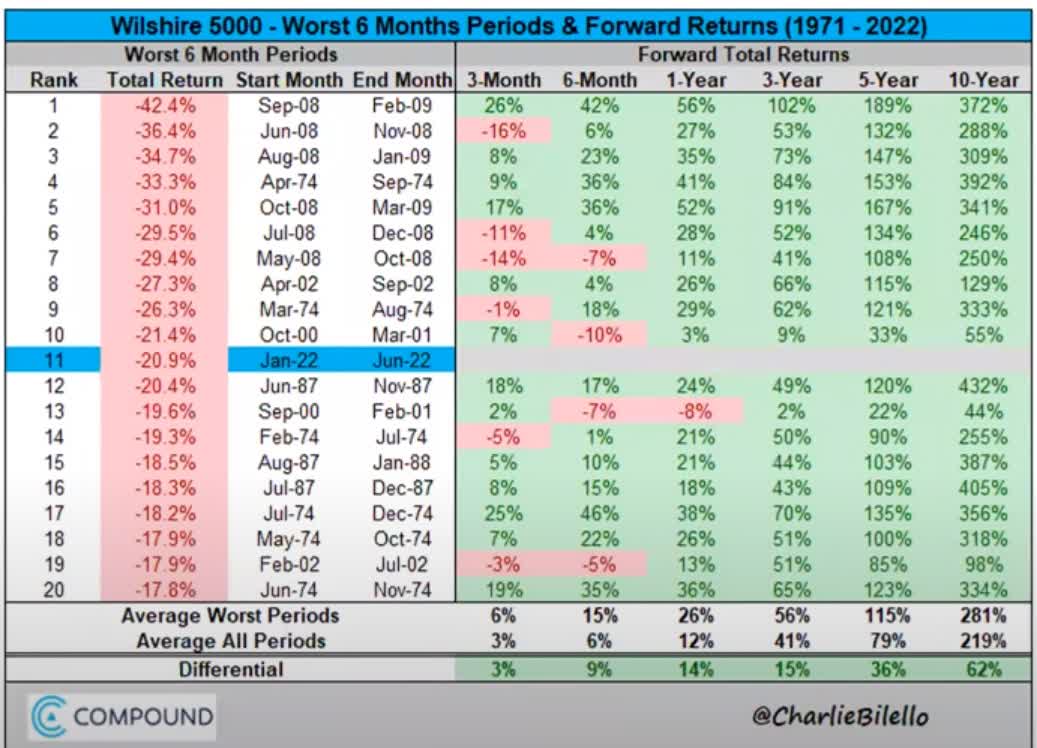
The average 10-year gain following terrible six-month periods is 281%, a nearly 4X return.
- 14.4% CAGR returns for stocks
- individual blue-chips can deliver 8X to 16X returns
Why is the blue-chip bear market bottom range so wide? Because in the short-term stock returns are a crap shoot.
In The Short Term, Luck Is 33X As Powerful As Fundamentals. In The Long-Term Fundamentals Are 33X As Powerful As Luck
| Time Frame (Years) |
Total Returns Explained By Fundamentals/Valuations |
| 1 Day | 0.01% |
| 1 month | 0.25% |
| 3 months | 0.75% |
| 6 months | 1.5% |
| 1 | 3% (Short-Term) |
| 2 | 6% |
| 3 | 23% |
| 4 | 31% |
| 5 | 39% |
| 6 | 47% |
| 7 | 55% (Medium-Term) |
| 8 | 62% |
| 9 | 70% |
| 10 | 78% |
| 11+ | 90% to 91% (Long-Term) |
| 30+ | 97% (Very Long-Term) |
(Sources: JPMorgan, Bank of America, Princeton, Fidelity, RIA)
But in the long-term blue-chip portfolio returns are destiny, driven 97% by fundamentals.
Or, to put it another way, the market doesn’t have to make any sense in the short term. But in the long term, it almost always makes perfect sense.
Today I want to share three reasons why you should love Apple (NASDAQ:AAPL) but wait for a better buying opportunity that might be coming soon.
I also want to highlight far better blue-chip bargain buying opportunities that you can safely buy today to set yourself up for the likely epic bull market that could start at any time.
Reason One To Love Apple: One Of The Most Profitable Companies On Earth
Apple is about 40% of Berkshire’s portfolio, and it’s not hard to see why. Buffett is famous for his love of wide moats, and just look at the moat around Apple.
Recent survey data shows that iPhone customers are not contemplating switching brands today. In a December 2018 survey by Kantar, 90% of U.S.-based iPhone users said they planned to remain loyal to future Apple devices. A recent survey (as of December 2021) from 451 Research indicates iPhone customer satisfaction of 98% for the iPhone 13 product family. Also, users of ancillary products (especially the Watch and AirPods) lose significant functionality when paired with a smartphone other than the iPhone. Ultimately, we believe that existing iPhone users are relatively locked into the iOS ecosystem and interface.” – Morningstar (emphasis added)
Apple might sell premium phones at premium prices, but its loyal following is willing to pay those prices with a smile because of the quality and convenience they get in return.
What does that translate to in dollars and cents? Just take a look.
Apple Medium-Term Growth Consensus Forecast
| Year | Sales | Free Cash Flow | EBITDA | EBIT (Operating Income) | Net Income |
| 2020 | $297,717 | $78,353 | $88,208 | $77,087 | $66,844 |
| 2021 | $372,699 | $96,457 | $122,969 | $111,595 | $95,939 |
| 2022 | $398,374 | $107,497 | $131,911 | $120,592 | $100,527 |
| 2023 | $417,800 | $110,669 | $135,654 | $124,659 | $103,807 |
| 2024 | $438,625 | $117,508 | $143,421 | $129,891 | $109,408 |
| 2025 | $473,216 | $130,301 | $156,653 | $142,587 | $121,619 |
| 2026 | $518,016 | $147,720 | $169,229 | $158,005 | $133,670 |
| 2027 | $560,835 | $158,846 | $181,702 | $168,360 | $142,819 |
| Annualized Growth | 9.47% | 10.62% | 10.88% | 11.81% | 11.46% |
| Annualized Growth (Post Pandemic) | 7.05% | 8.67% | 6.72% | 7.09% | 6.86% |
| Cumulative Next Six Years | $2,806,866 | $665,044 | $786,659 | $723,502 | $611,323 |
(Source: FactSet Research Terminal)
Do you know how many companies have ever generated $100 billion in profit in a single year? One Saudi Aramco (ARMCO). Apple is expected to become the second in 2022.
It’s also expected to become the first company in history to generate over $100 billion in free cash flow in a single year, also in 2022.
By 2027 analysts think Apple could be generating almost $160 billion in free cash flow each year, and that river of cash is expected to be growing at almost 10%.
Apple’s 2022 free cash flow consensus is larger than the GDP of all but 62 countries on earth.
Over the next six years, analysts think Apple could generate almost $3 trillion in sales and $665 billion in free cash flow. Apple is the most profitable company in history by a wide margin. And speaking of margins.
Apple Margin Consensus Forecast
| Year | FCF Margin | EBITDA Margin | EBIT (Operating) Margin | Net Margin | Return On Capital Expansion |
Return On Capital Forecast |
| 2020 | 26.3% | 29.6% | 25.9% | 22.5% | 1.00 | |
| 2021 | 25.9% | 33.0% | 29.9% | 25.7% | TTM ROC | 313.03% |
| 2022 | 27.0% | 33.1% | 30.3% | 25.2% | Latest ROC | 314.00% |
| 2023 | 26.5% | 32.5% | 29.8% | 24.8% | 2027 ROC | 313.84% |
| 2024 | 26.8% | 32.7% | 29.6% | 24.9% | 2027 ROC | 314.81% |
| 2025 | 27.5% | 33.1% | 30.1% | 25.7% | Average | 314.32% |
| 2026 | 28.5% | 32.7% | 30.5% | 25.8% | Industry Median | 13.23% |
| 2027 | 28.3% | 32.4% | 30.0% | 25.5% | AAPL/Industry Median | 23.76 |
| Annualized Growth | 1.05% | 1.29% | 2.14% | 1.82% | Vs. S&P | 21.53 |
| Annualized Growth (Post Pandemic) | 1.51% | -0.30% | 0.04% | -0.18% |
(Source: FactSet Research Terminal)
Apple’s incredible margins are expected to remain table over time, including free cash flow margins of 28% and net margins of 26%.
Joel Greenblatt, one of the greatest investors in history, earned 40% annual returns for 21 years, focusing on return on capital and valuation.
- Return on capital = annual-pretax profits/the money it takes to run the business
ROC is Greenblatt’s gold standard proxy for quality and moatiness. Apple’s ROC in the last year was 313%, 22X that of the S&P 500 and 24X that of its median peer.
And analysts expect Apple to keep generating over 300% returns on capital for the foreseeable future.
And that incredible profitability isn’t due to Apple being stingy with the growth spending.
Apple Growth Spending Consensus Forecast
| Year | SG&A (Selling, General, Administrative) | R&D | Capex | Total Growth Spending | Sales | Growth Spending/Sales |
| 2020 | $20,448 | $19,562 | $8,266 | $48,276 | $297,717 | 16.22% |
| 2021 | $22,786 | $22,855 | $10,946 | $56,587 | $372,699 | 15.18% |
| 2022 | $25,796 | $26,359 | $10,872 | $63,027 | $398,374 | 15.82% |
| 2023 | $27,808 | $28,911 | $12,021 | $68,740 | $417,800 | 16.45% |
| 2024 | $28,880 | $31,683 | $12,936 | $73,499 | $438,625 | 16.76% |
| 2025 | $29,832 | $36,337 | $13,438 | $79,607 | $473,216 | 16.82% |
| 2026 | $31,250 | $38,779 | $11,148 | $81,177 | $518,016 | 15.67% |
| 2027 | $34,115 | $40,821 | $11,252 | $86,188 | $560,835.00 | 15.37% |
| Annualized Growth | 7.59% | 11.08% | 4.50% | 8.63% | 9.47% | -0.76% |
| Total Spending Next Six Years | $177,681 | $202,890 | $71,667 | $452,238 | $2,806,866 |
(Source: FactSet Research Terminal)
Apple’s consensus R&D spending this year is $26 billion, and total growth spending consensus is $63 billion.
- Apple’s 2022 growth spending is larger than the GDP of all but 63 countries on earth
By 2027 analysts expect Apple to be spending almost $41 billion on R&D and $86 billion on growth.
That’s a total $452 billion in consensus growth spending in just the next six years.
Apple isn’t a company, it’s a nation unto itself. And all that cash has resulted in the
Reason Two: The Largest Capital Return Program In History Keeps Getting Bigger
What does Apple do with its rivers of cash? Returns it to shareholders with epic scale and speed.
Apple Investor Relations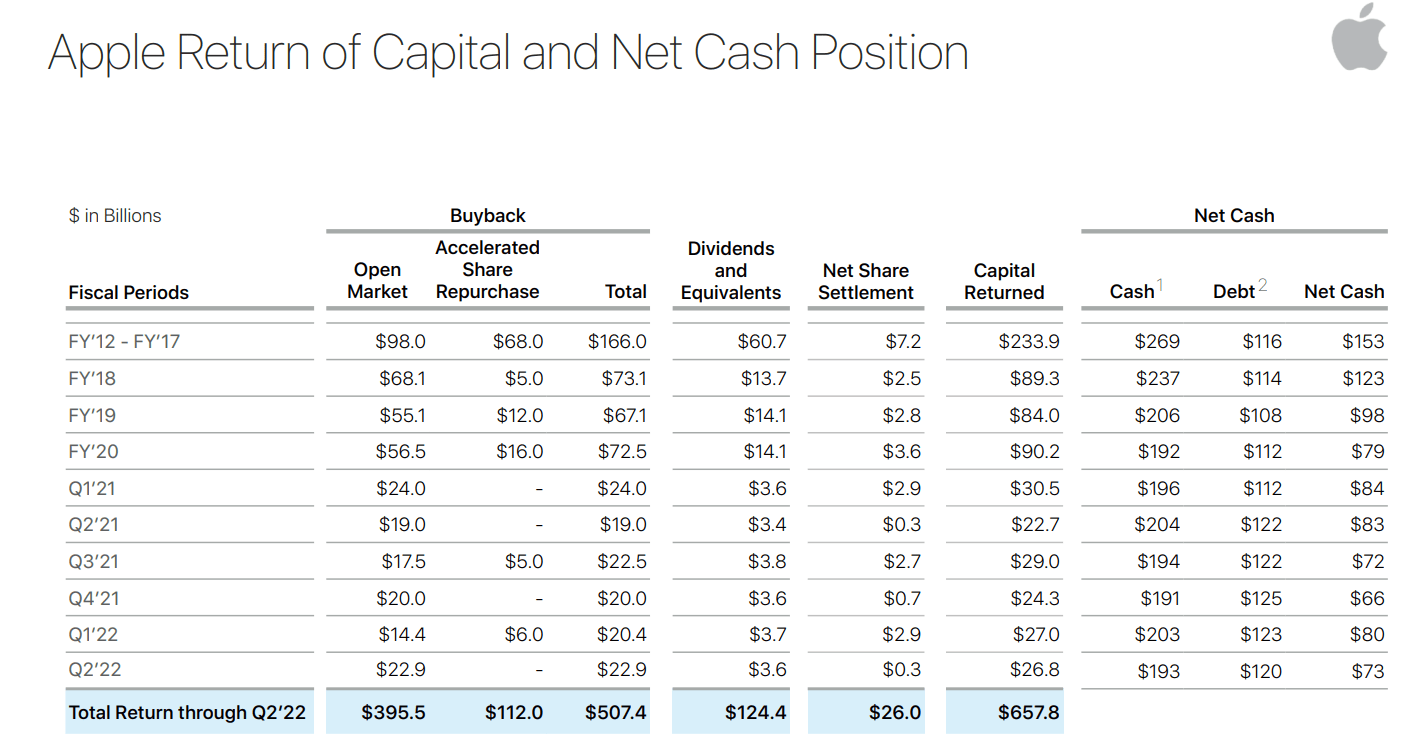
Since it began the capital return program in 2012, it’s returned $658 billion through buybacks and dividends. And it still has $193 billion in cash and $73 billion in net cash.
Apple Dividend Growth Consensus Forecast
| Year | Dividend Consensus | FCF/Share Consensus | FCF Payout Ratio | Retained (Post-Dividend) Free Cash Flow | Buyback Potential | Debt Repayment Potential |
| 2022 | $0.90 | $6.68 | 13.5% | $93,682 | 3.69% | 79.3% |
| 2023 | $0.96 | $7.21 | 13.3% | $101,300 | 3.99% | 85.8% |
| 2024 | $1.02 | $7.91 | 12.9% | $111,673 | 4.40% | 94.6% |
| Total 2022 Through 2024 | $2.88 | $21.80 | 13.2% | $306,655.36 | 12.08% | 259.87% |
| Annualized Rate | 6.46% | 8.82% | -2.17% | 9.18% | 9.18% | 9.24% |
(Source: FactSet Research Terminal)
Apple is spending almost $16 billion annually on dividends yet still paying out just 14% of free cash flow. Analysts expect the dividend to grow at 6% to 7% over the next few years, while FCF/share grows closer to 9%, causing the payout ratio to fall to 13%.
- rating agencies consider 60% a safe payout ratio for this industry
- the average payout ratio for the S&P 500 over the last 95 years is 57%
- the S&P 500’s is currently 42%
After paying $47 billion in dividends, analysts think Apple would have $307 billion in retained cash flow that could be used to repay all of its debt almost 3X over or buy back up to 12% of shares at current valuations.
Apple Buyback Consensus Forecast
| Year | Consensus Buybacks ($ Millions) | % Of Shares (At Current Valuations) | Market Cap |
| 2022 | $81,194 | 2.7% | $2,538,160 |
| 2023 | $69,548 | 1.7% | $2,538,160 |
| 2024 | $42,403 | 1.7% | $2,538,160 |
| Total 2022-2024 | $111,951 | 4.4% | $2,538,160 |
| Annualized Rate | 1.49% | Average Annual Buybacks | $37,317 |
(Source: FactSet Research Terminal)
Apple is expected to spend $82 billion on buybacks this year, potentially repurchasing almost 3% of its shares in 2022.
I expect those falling estimates in 2023 and 2024 will increase significantly since Apple’s free cash flow and mountain of cash are expected to keep growing steadily over time.
Ycharts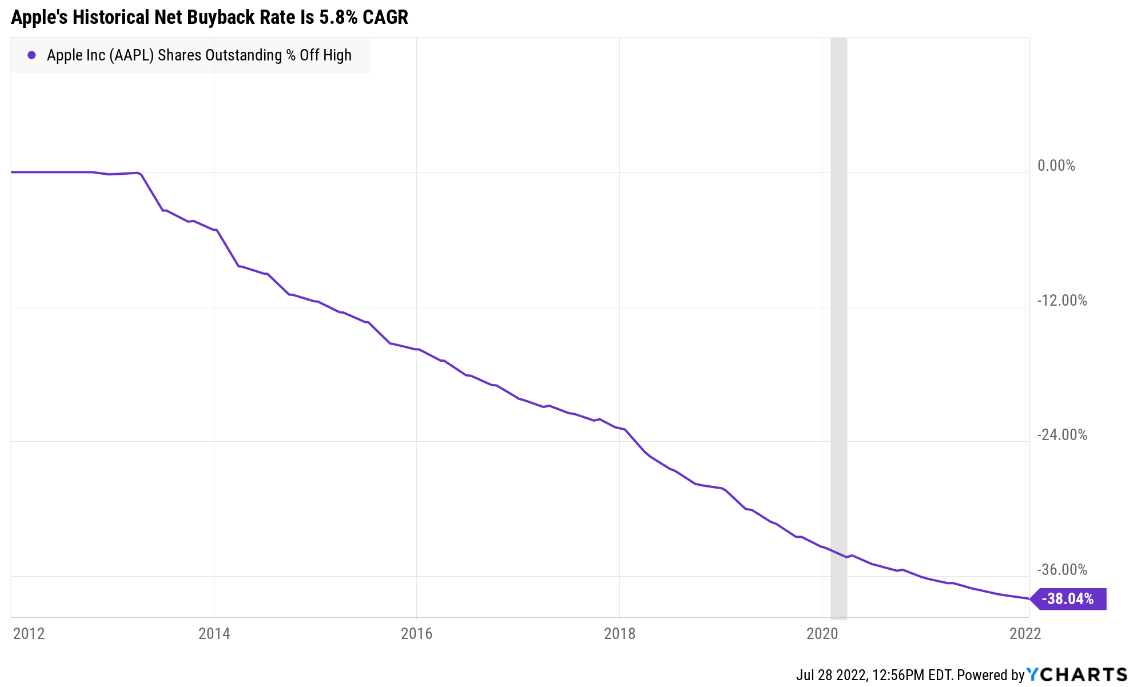
Apple’s been buying back net shares at a rate of 5.8% per year for the last eight years, repurchasing almost 40% of its shares.
| Time Frame (Years) | Net Buyback Rate | Shares Remaining | Net Shares Repurchased | Each Share You Own Is Worth X Times More (Not Including Future Growth And Dividends) |
| 5 | 2.7% | 87.21% | 12.79% | 1.15 |
| 10 | 2.7% | 76.06% | 23.94% | 1.31 |
| 15 | 2.7% | 66.33% | 33.67% | 1.51 |
| 20 | 2.7% | 57.84% | 42.16% | 1.73 |
| 25 | 2.7% | 50.45% | 49.55% | 1.98 |
| 30 | 2.7% | 43.99% | 56.01% | 2.27 |
(Source: FactSet Research Terminal)
If Apple were to buy back 2.7% of its shares at current valuations, which is the 2022 consensus, and do that for the next 30 years, then it could buy back another 56% of its net shares and more than double the intrinsic value of each existing share, not counting any future growth.
Reason Three: Market-Beating Return Potential For Decades To Come
(Source: FactSet Research Terminal)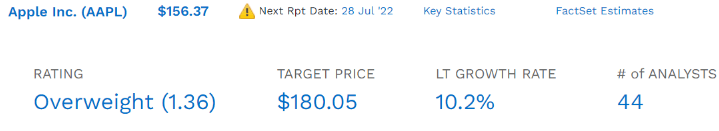
Apple isn’t expected to keep growing at hyper-growth rates, and how can it? It’s already the largest company on earth by market cap, but analysts think it can grow at 10.2% over time.
What does that potentially mean for long-term income investors?
- 10.8% CAGR long-term return potential
- slightly about the S&P 500’s 10.2% CAGR long-term consensus
That might not sound too exciting, given that Apple has delivered 29.6% CAGR total returns for the last 20 years. But remember that Apple is one of the world’s safest companies.
- AA+ stable credit rating = 0.29% 30-year bankruptcy risk
Apple is a virtually risk-free single-company investment opportunity and one that could still deliver exceptional long-term returns that could help you retire in safety and splendor.
Inflation Adjusted Consensus Total Return Forecast: $1,000 Initial Investment
| Time Frame (Years) | 7.7% CAGR Inflation-Adjusted S&P Consensus | 8.6% Inflation-Adjusted Aristocrat Consensus | 8.3% CAGR Inflation-Adjusted Apple Consensus | Difference Between Inflation-Adjusted Apple Consensus And S&P Consensus |
| 5 | $1,451.05 | $1,512.69 | $1,491.91 | $40.86 |
| 10 | $2,105.56 | $2,288.22 | $2,225.81 | $120.25 |
| 15 | $3,055.27 | $3,461.36 | $3,320.71 | $265.44 |
| 20 | $4,433.36 | $5,235.95 | $4,954.22 | $520.85 |
| 25 | $6,433.04 | $7,920.35 | $7,391.26 | $958.22 |
| 30 | $9,334.69 | $11,981.01 | $11,027.12 | $1,692.44 |
(Source: DK Research Terminal, FactSet)
Analysts think Apple can potentially deliver 11X inflation-adjusted returns over the next 30 years, slightly more than the S&P 500.
| Time Frame (Years) | Ratio Aristocrats/S&P Consensus | Ratio Inflation-Adjusted Apple Consensus vs. S&P consensus |
| 5 | 1.04 | 1.03 |
| 10 | 1.09 | 1.06 |
| 15 | 1.13 | 1.09 |
| 20 | 1.18 | 1.12 |
| 25 | 1.23 | 1.15 |
| 30 | 1.28 | 1.18 |
(Source: DK Research Terminal, FactSet)
Given that Apple’s rabidly loyal fanbase is making it almost a tech utility, this return potential makes Apple well worth owning in almost any income growth portfolio.
Apple Is Not A Good Buy Right Now
| Metric | Historical Fair Value Multiples (10-Years) | 2021 | 2022 | 2023 | 2024 |
12-Month Forward Fair Value |
| PE | 18.16 | $104.24 | $113.14 | $120.58 | $130.75 | |
| Average | $104.24 | $113.14 | $120.58 | $130.75 | $117.43 | |
| Current Price | $156.96 | |||||
|
Discount To Fair Value |
-50.58% | -38.73% | -30.17% | -20.04% | -33.66% | |
|
Upside To Fair Value (NOT Including Dividends) |
-33.59% | -27.92% | -23.18% | -16.70% | -25.18% | |
| 2022 EPS | 2023 EPS | 2022 Weighted OCF | 2023 Weighted OCF | 12-Month Forward PE | 12-Month Average Fair Value Forward PE |
Current Forward PE |
| $6.23 | $6.64 | $2.64 | $3.83 | $6.47 | 18.16 | 24.27 |
I estimate Apple, in the Tim Cook era, is historically worth about 18.2X earnings, and today it trades at 24.3X.
- 20.0X cash-adjusted earnings vs. 13-year median of 10.3X
|
Analyst Median 12-Month Price Target |
Morningstar Fair Value Estimate |
| $180.05 (27.8 PE) | $130.00 (20.1 PE) |
|
Discount To Price Target (Not A Fair Value Estimate) |
Discount To Fair Value |
| 12.82% | -20.74% |
|
Upside To Price Target (Not Including Dividend) |
Upside To Fair Value (Not Including Dividend) |
| 14.71% | -17.18% |
|
12-Month Median Total Return Price (Including Dividend) |
Fair Value + 12-Month Dividend |
| $180.97 | $130.92 |
|
Discount To Total Price Target (Not A Fair Value Estimate) |
Discount To Fair Value + 12-Month Dividend |
| 13.27% | -19.89% |
|
Upside To Price Target ( Including Dividend) |
Upside To Fair Value + Dividend |
| 15.30% | -16.59% |
(Source: FactSet, Morningstar)
Morningstar’s discounted cash flow model estimates Apple is worth about 20X earnings.
Analysts are very bullish and think it will trade at 28X earnings within a year, delivering a modest 15% gain.
But let me show you why analyst forecasts are so speculative.
(Source: FAST Graphs, FactSet)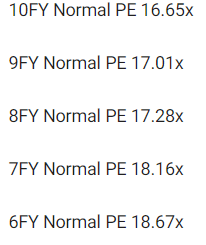
During the Tim Cook era, Apple has grown at nearly 20% annually, yet it was valued at around 18X earnings by billions of investors outside of bear markets and bubbles.
At its recent peak, it was trading at 31.4X earnings, a 72% historical premium.
- S&P 500 peak historical premium in March 2000 was 50%
- the worst bubble in US market history
Apple’s Recent Bear Market Was Not A Good Buying Opportunity
(Source: FAST Graphs, FactSet)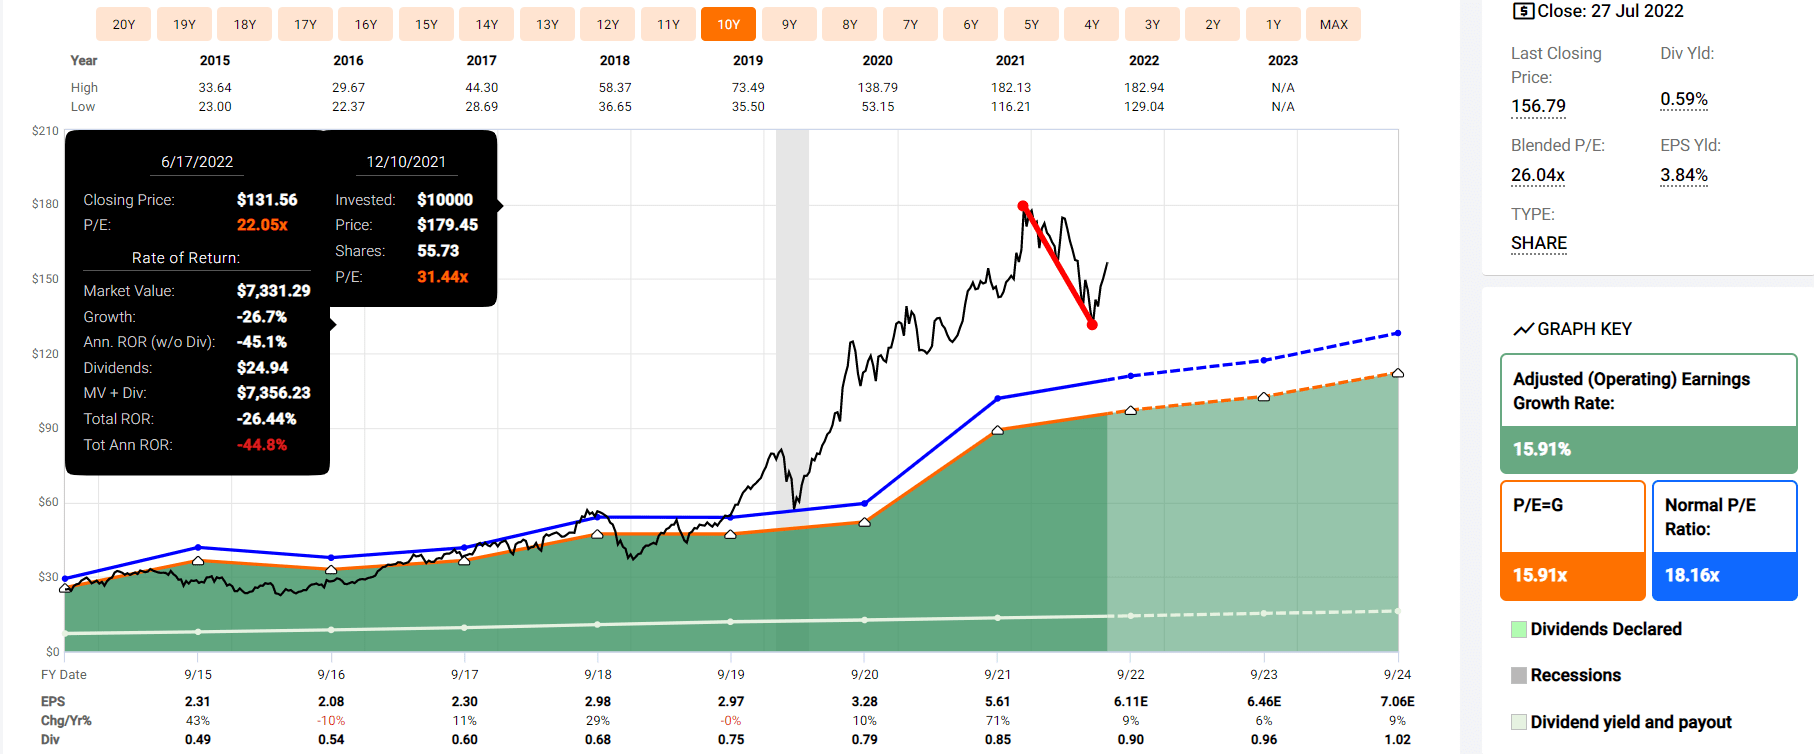
What kind of returns are Apple investors likely to get over the next few years?
Apple 2024 Consensus Total Return Potential
(Source: FAST Graphs, FactSet)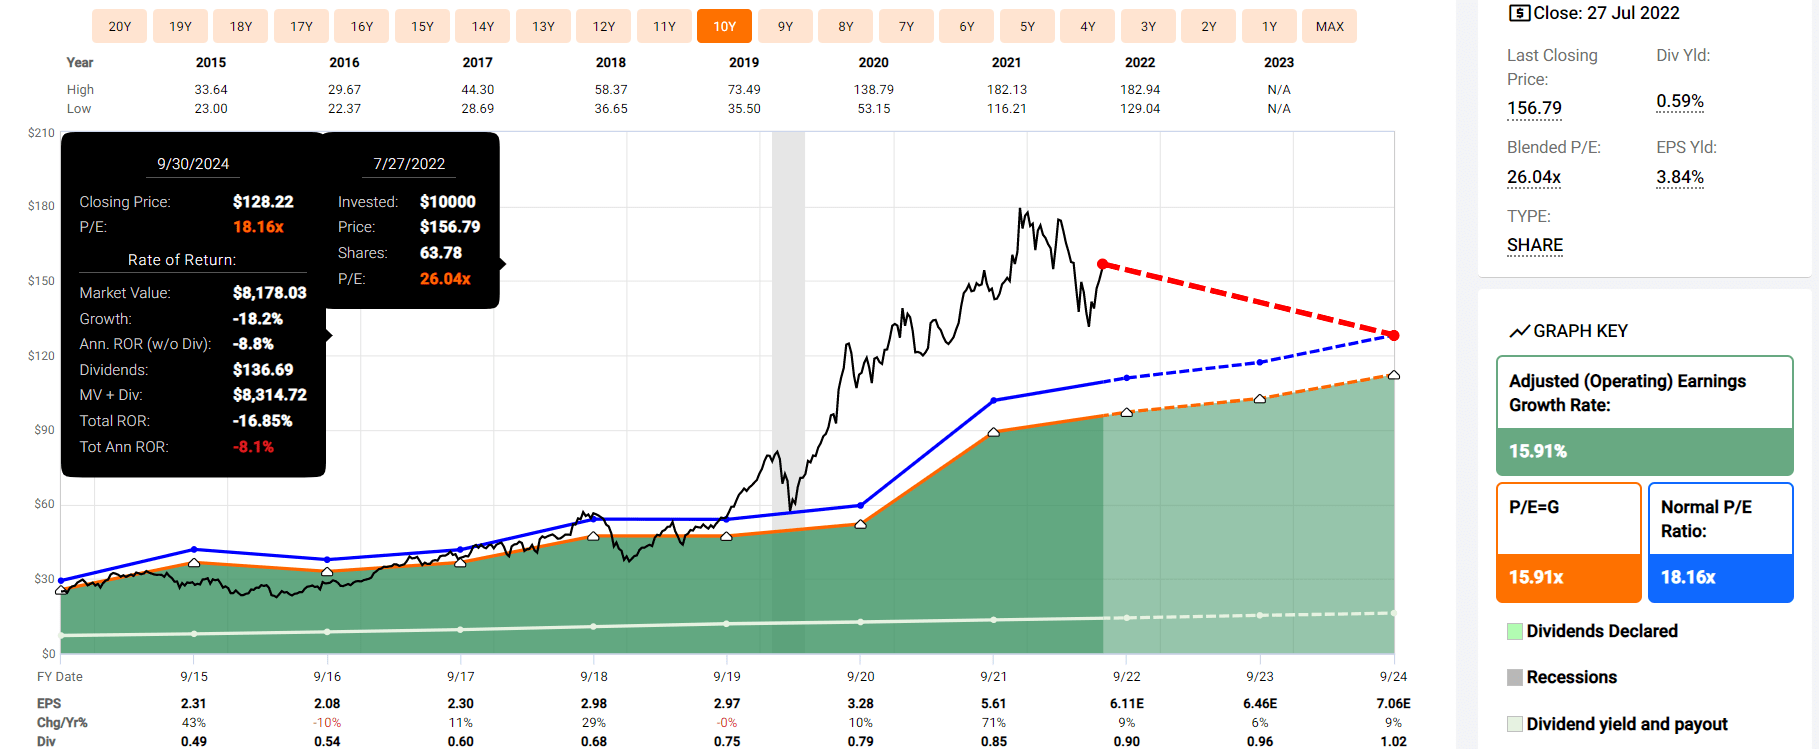
If Apple grows as expected (about 9% annually through 2024), and returns to historical fair value in the Tim Cook era, investors could lose 17% over the next three years, or -6% CAGR.
Apple 2027 Consensus Total Return Potential
(Source: FAST Graphs, FactSet)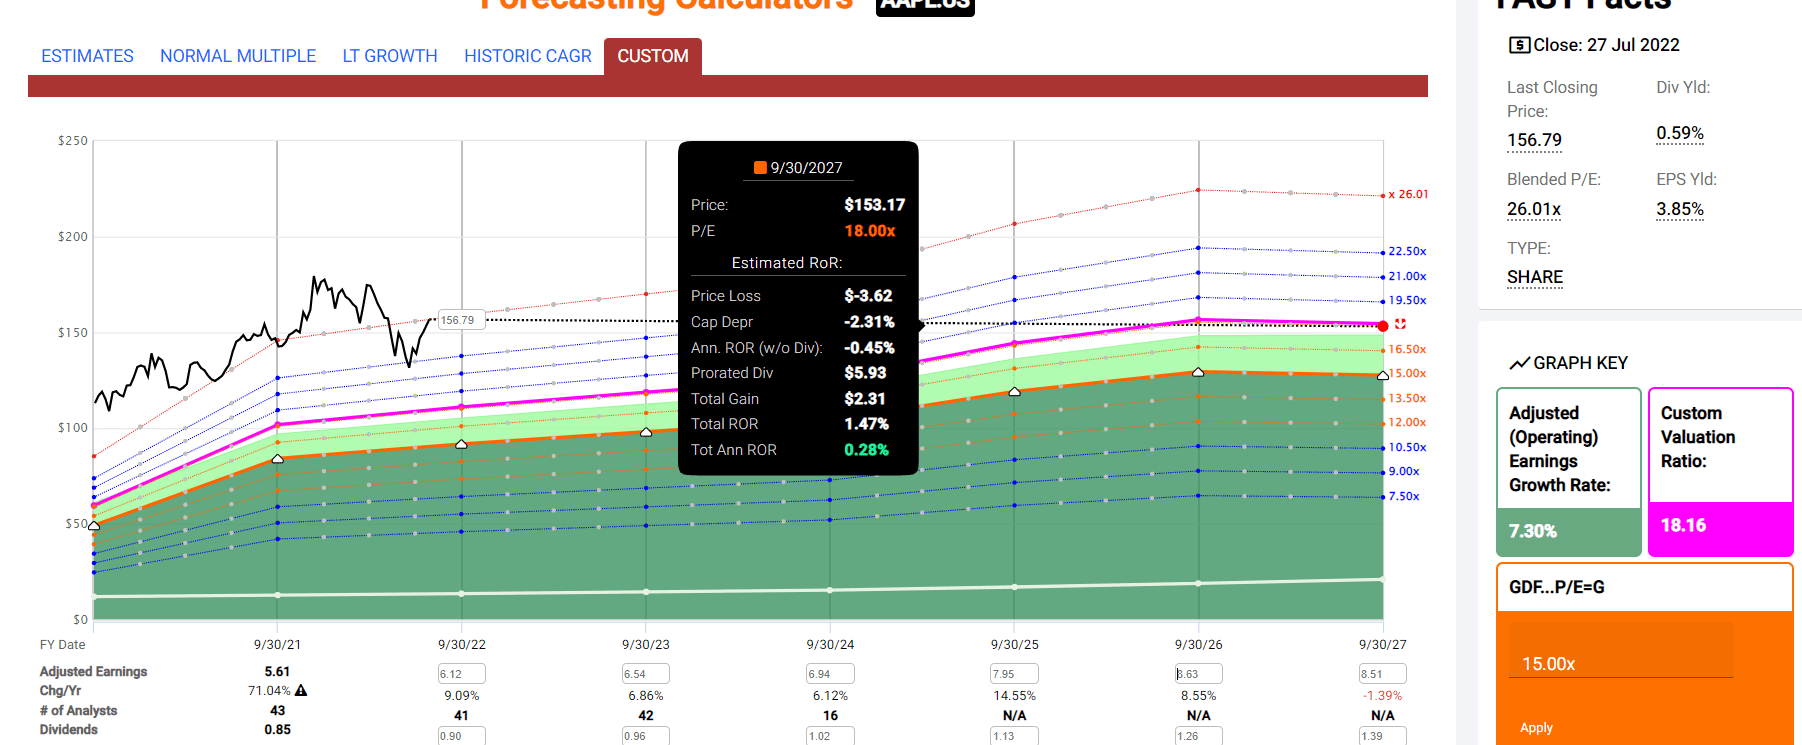
If Apple grows as expected and returns to historical fair value, then by 2027, investors will break even.
- Analysts only expect Apple to grow at 7.3% CAGR through 2027
Do you know what can potentially beat 0.3% annual returns over the next five years? Almost anything.
Does that mean that Apple is a sell? I rate it a “hold” because its 33% overvalued, but not yet tech bubble valuations.
- DK uses 50% overvalued as our automatic “potential trim/sell” rating classification
If You Bought Apple The Last Time It Was Fairly Valued You Can Make 20% Returns, Even It Crashes.
(Source: FAST Graphs, FactSet)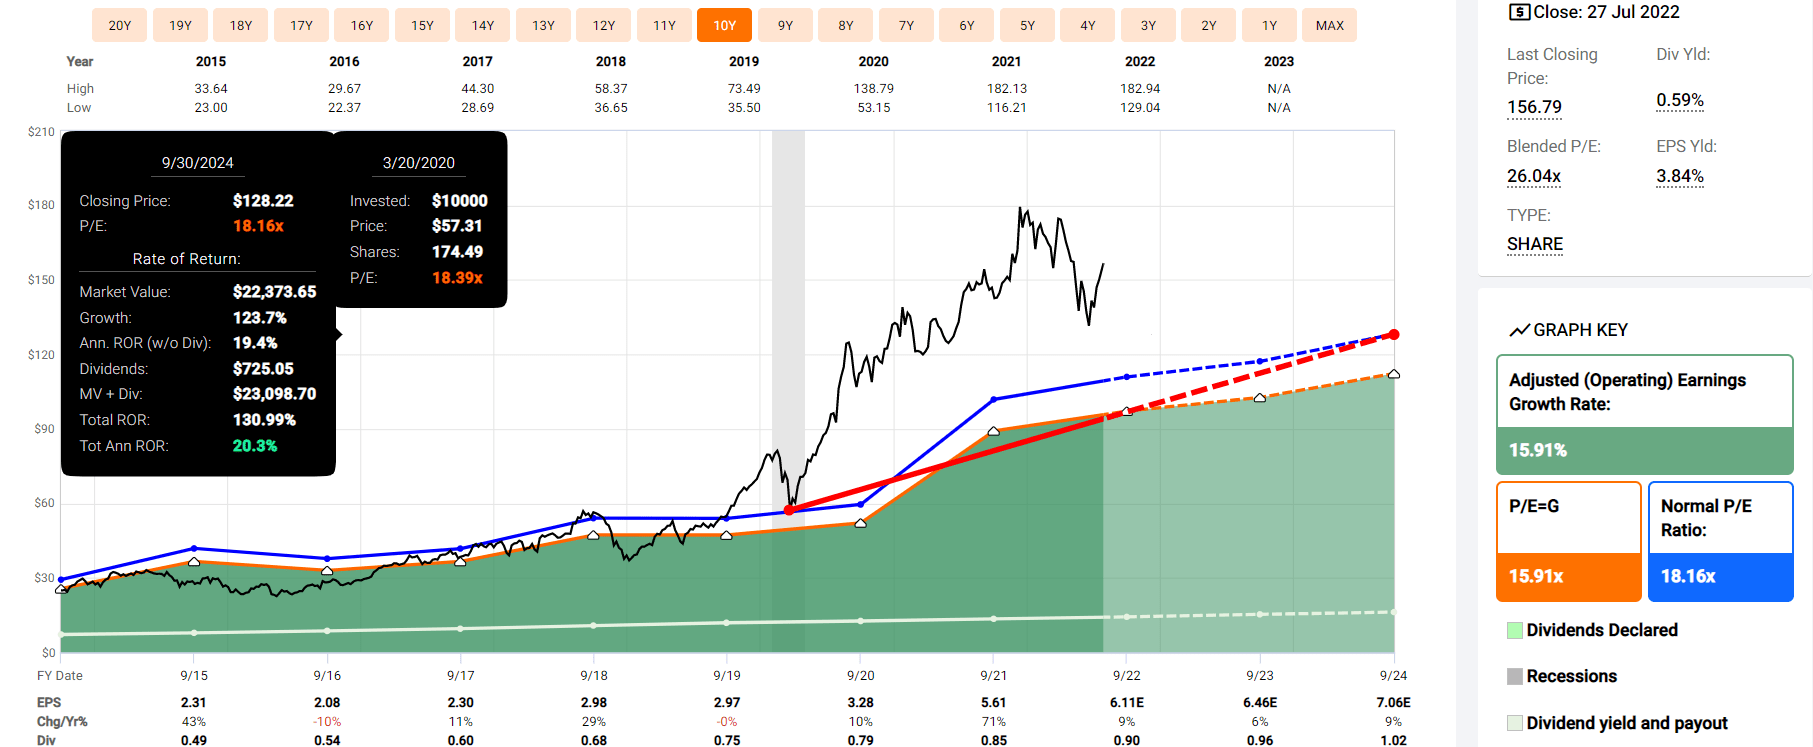
If you bought Apple the last time it was historically fairly valued, at the Pandemic lows, you can reasonably expect to make about 20% annual returns through 2024.
- Buy it today and its -6% annual returns
What about Buffett? Why isn’t he selling his mountain of Apple shares?
(Source: WhaleWisdom)
Berkshire owns 5.5% of Apple, and its cost basis is about $38.
Buffett Doesn’t Have To Trigger Taxable Capital Gains… Because He Bought Apple At 12.7X Earnings
(Source: FAST Graphs, FactSet)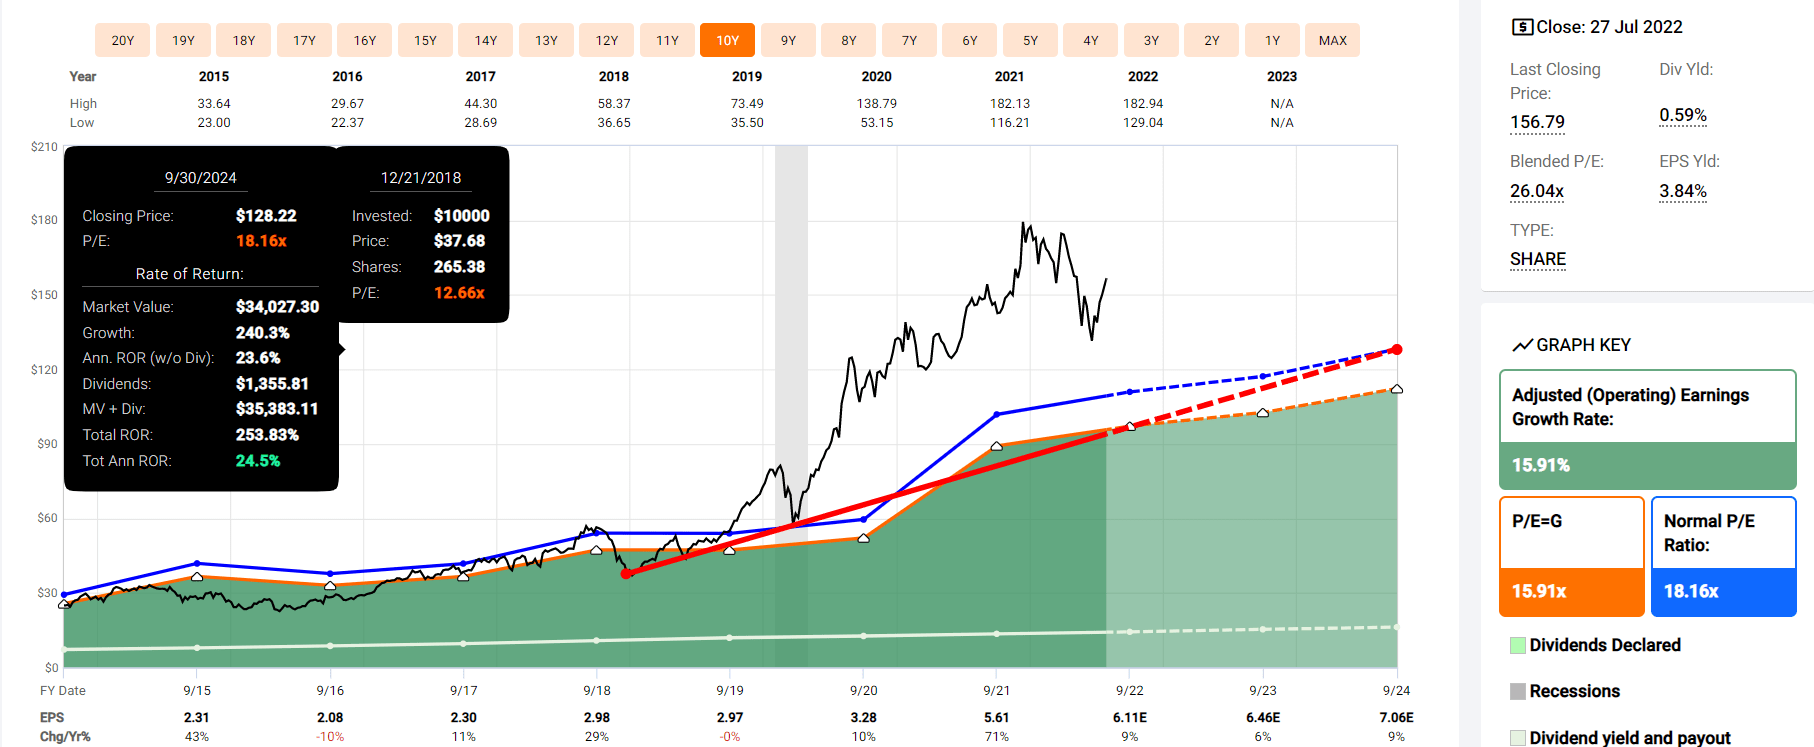
At Buffett’s price, Berkshire has locked in potentially 24.5% annual total returns through late 2024.
Did Buffett get a sweetheart deal? You bet. But only because he was buying Apple when it was in a bear market and was “greedy when others were fearful.”
The point is that the valuation you pay for a company makes all the difference between earning Buffett-like returns (quite literally) and negative returns for several years.
Is it possible that Apple’s most service-oriented business model is now worth 24X or even 28X earnings?
- in 2021 81% of Apple’s sales were hardware
- in 2027 analysts expect 69% of Apple’s sales to be from hardware
That’s for the market to decide, but anyone who buys today is buying with a negative margin of safety and speculating about Apple’s higher future valuation.
And as I’ll now show, there’s no need to speculate when there are far better dividend growth blue-chip bargains available.
How To Easily Find Superior Dividend Growth Alternatives To Apple In 2 Minutes
Here’s how I used the Dividend Kings Zen Research Terminal To find X better dividend growth bargain alternatives to Apple.
This is our flagship screening tool that runs off the DK 500 Masterlist.
The DK 500 Master List is one of the world’s best watchlists, including
-
every dividend aristocrat (S&P companies with 25+ year dividend growth streaks)
-
every dividend champion (every company, including foreign, with 25+ year dividend growth streaks)
-
every dividend king (every company with 50+ year dividend growth streaks)
-
every foreign aristocrat (every company with 20+ year dividend growth streaks)
-
every Ultra SWAN (wide moat aristocrats, as close to perfect quality companies as exist)
-
40 of the world’s best growth stocks
So let me show you the very easy screen I did in three minutes.
- Potential good buy or better (sufficient margin of safety for a company’s quality and risk profile) 183 companies remain
- dividend yield 0.6%+ (equal to or better than Apple’s) 151 companies remain
- 92%-plus quality score (equal to or better than Apple’s) 25 companies remain
- 97%-plus dividend safety score (equal or better than Apple’s, 1.15% severe recession dividend cut risk) 17 companies remain
- 10.8%-plus long-term return potential (equal or better than Apple’s) 13 companies remain
- A-credit rating or better (similar fundamental risk to Apple’s), three companies remain
- total time: Two minutes
6 Better Dividend Blue-Chip Bargains To Buy Instead Of Apple
Dividend Kings Zen Research Terminal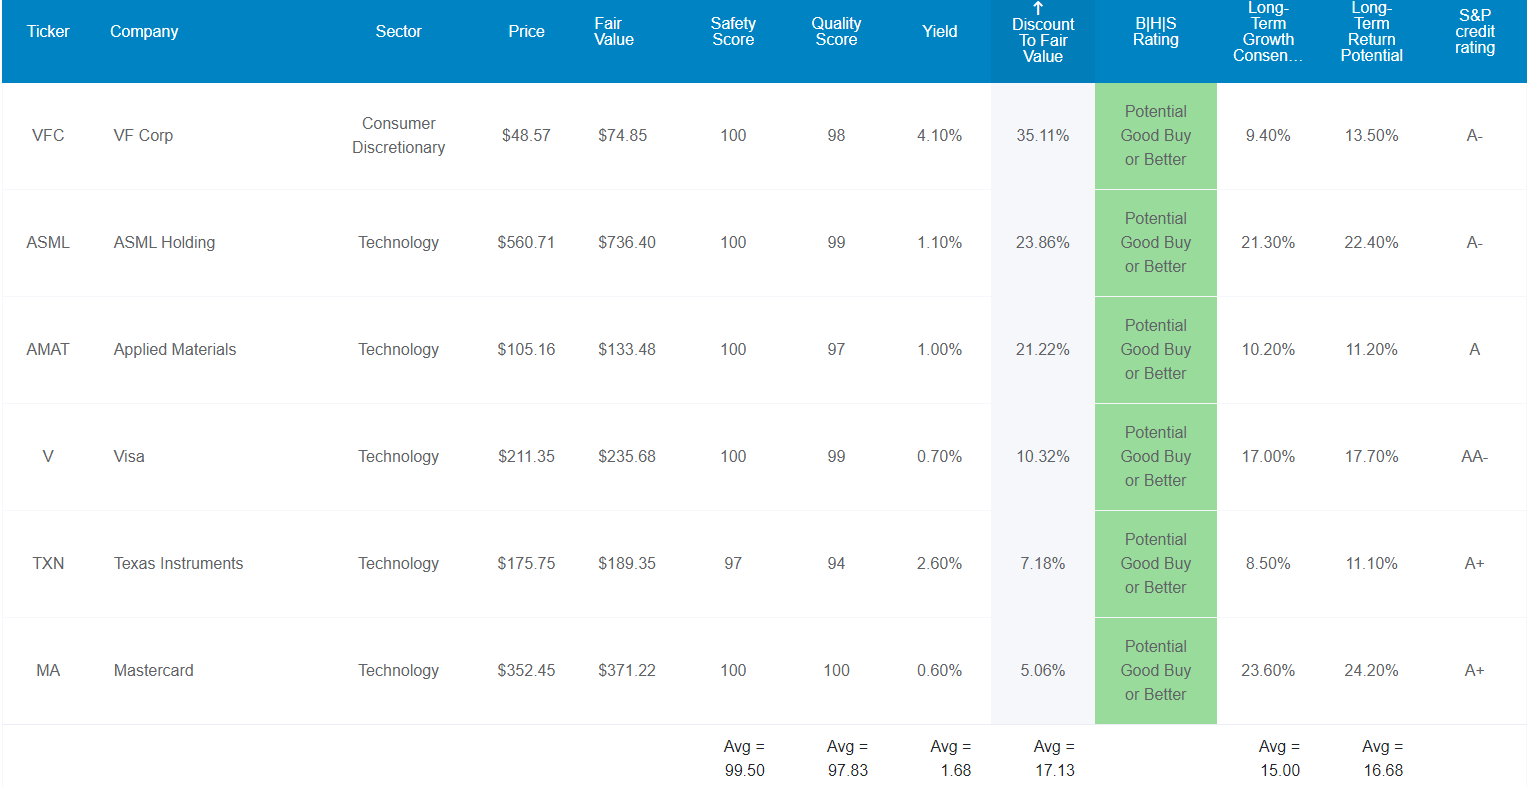
I’ve linked to articles exploring each company’s investment thesis, risk profile, growth outlook, valuation, and total return potential.
Here are six Ultra SWANs with equal or superior safety, quality, and dependability to Apple.
They are collectively 17% undervalued, a potential strong buy for anyone comfortable with their risk profiles.
They offer a 1.7% yield that’s 3X higher than Apple’s.
They are growing at 15.0%, about 50% better than Apple.
And analysts expect almost 17% long-term total returns, about 70% more than Apple.
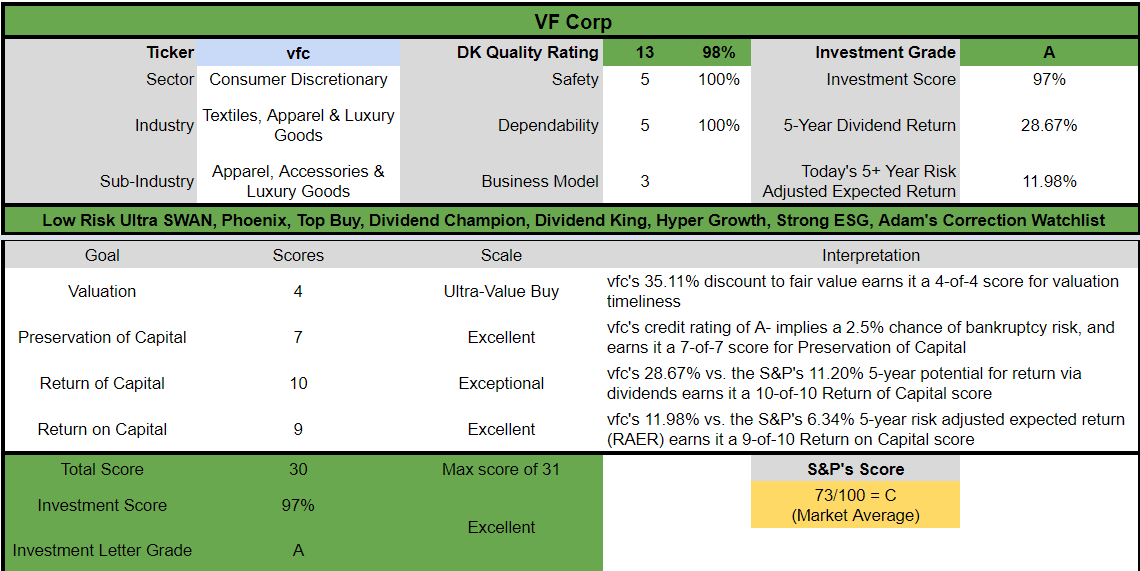
V.F. Corp 2024 Consensus Total Return Potential
(Source: FAST Graphs, FactSet)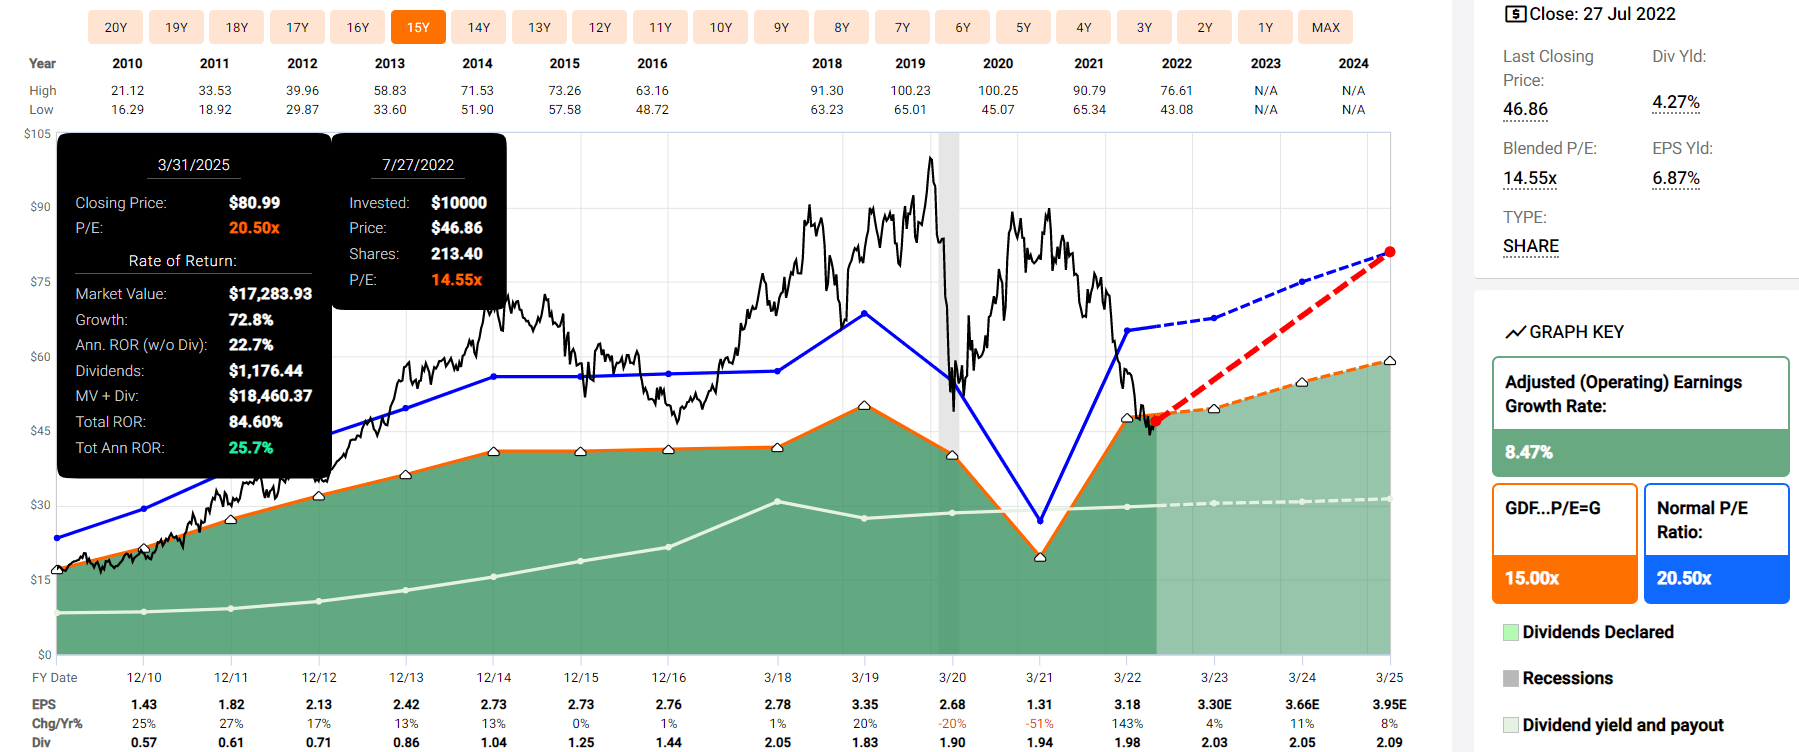
VF 2027 Consensus Total Return Potential
(Source: FAST Graphs, FactSet)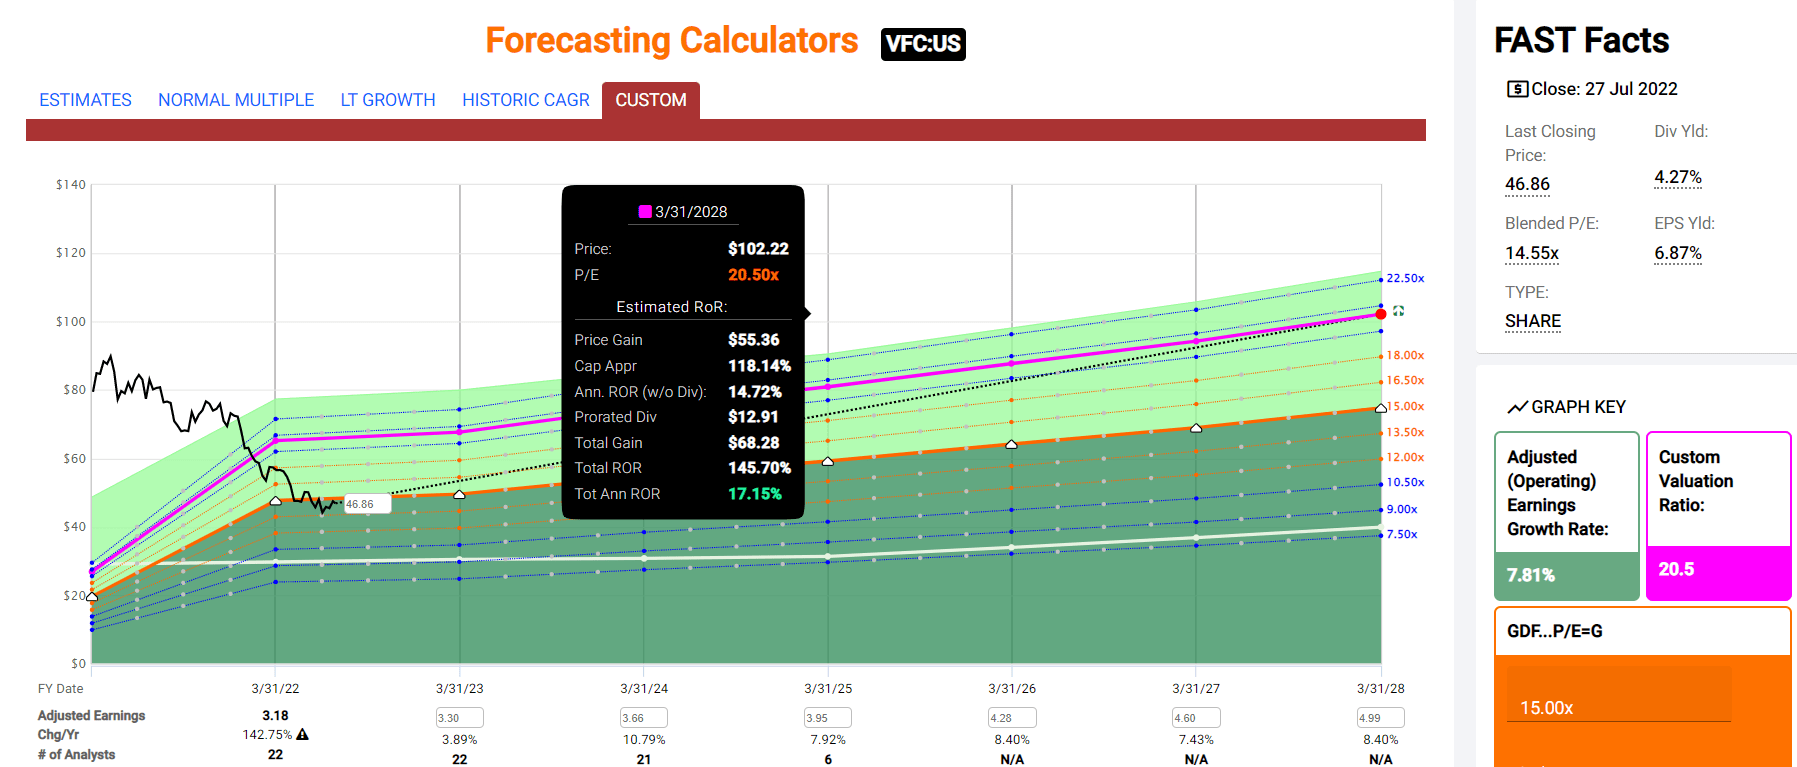
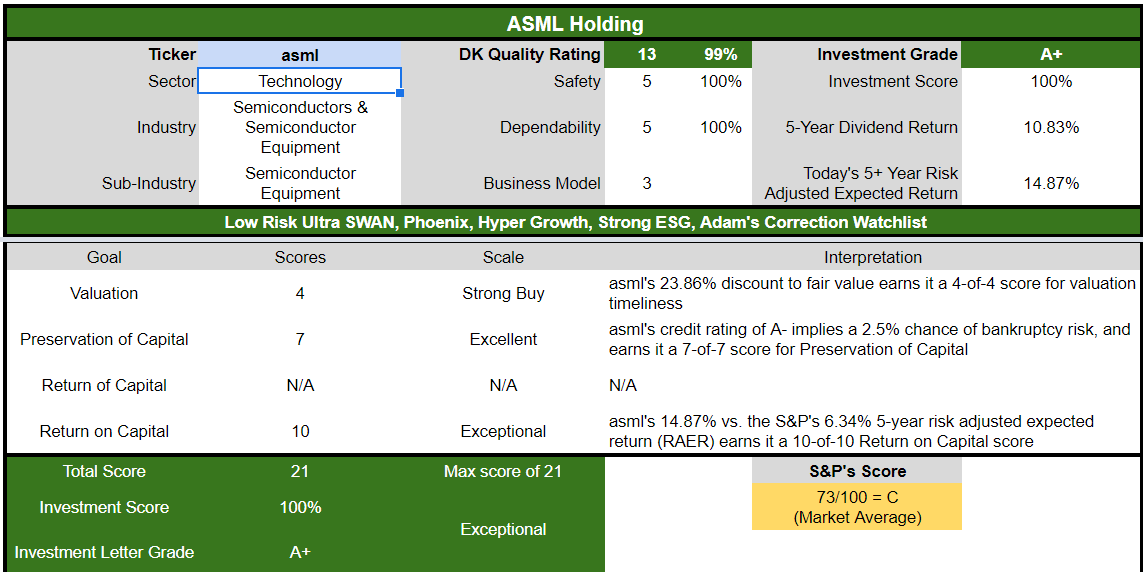
ASML 2024 Consensus Total Return Potential
(Source: FAST Graphs, FactSet)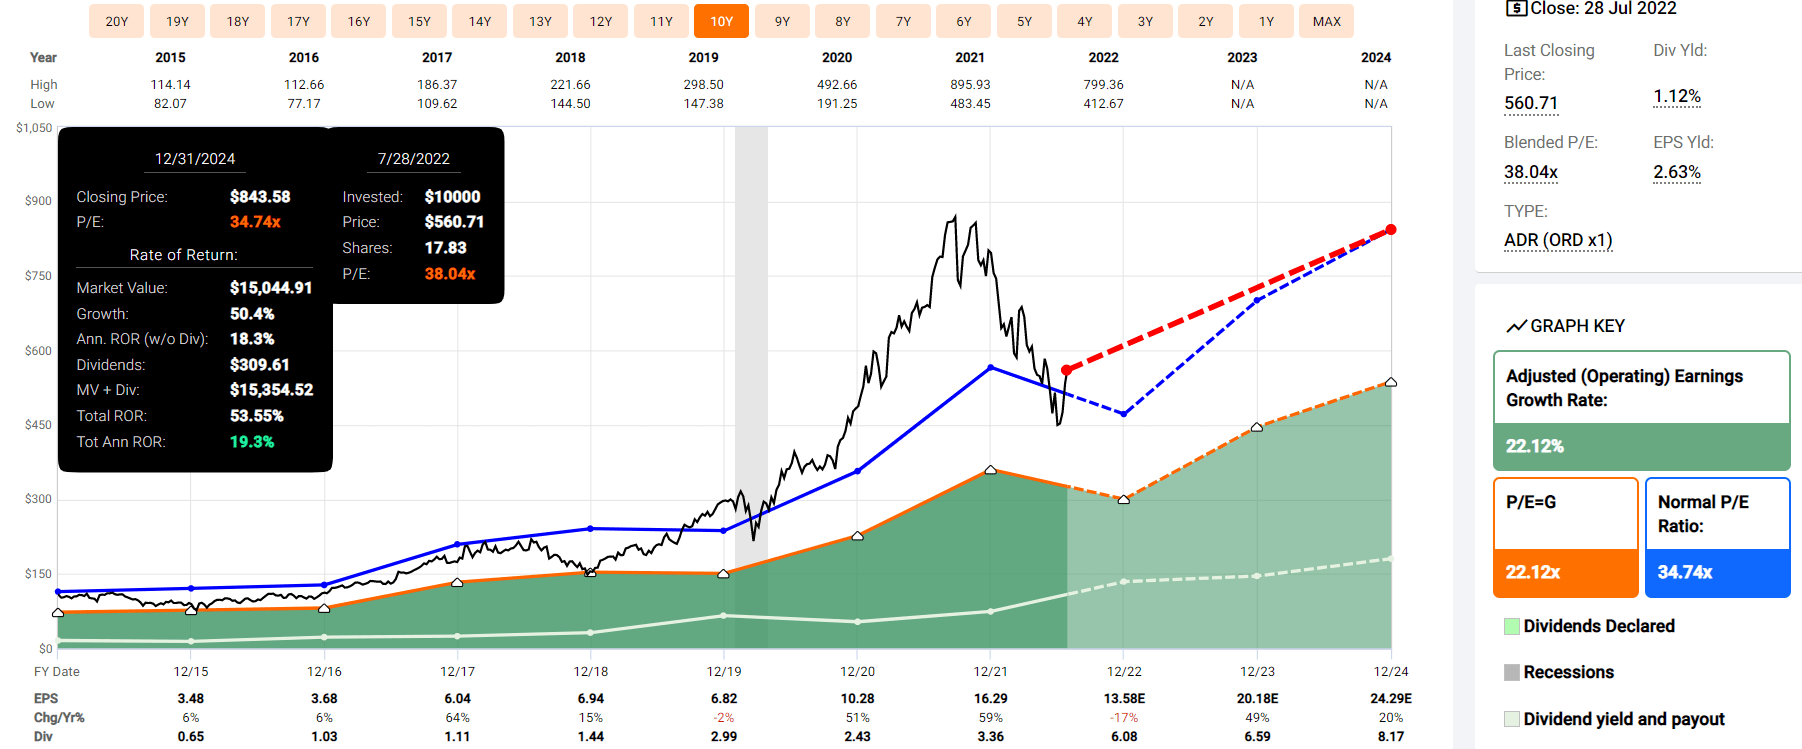
ASML 2027 Consensus Total Return Potential
(Source: FAST Graphs, FactSet)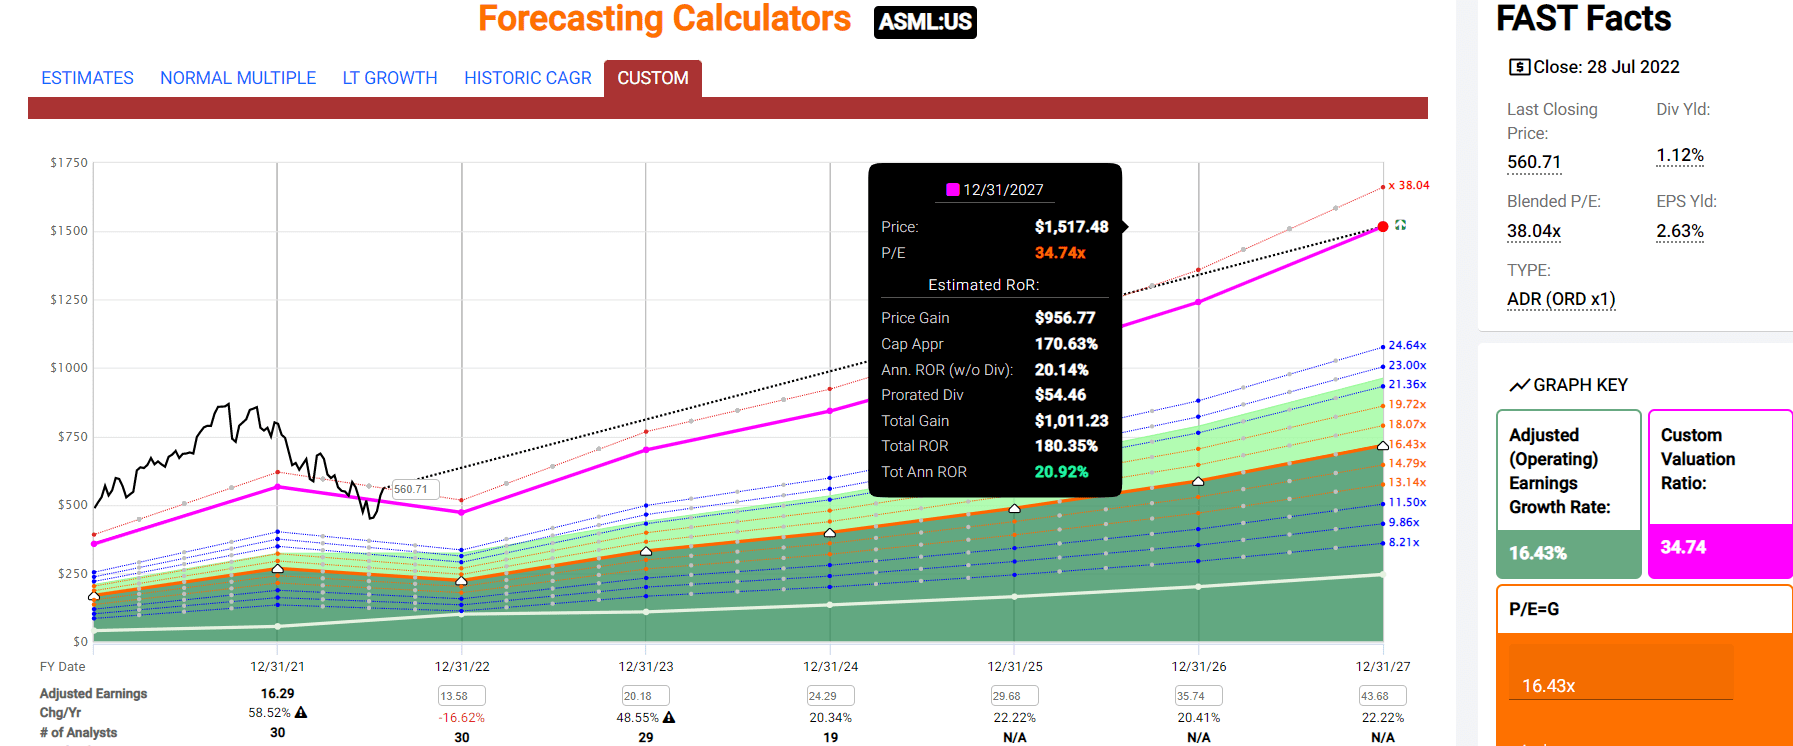
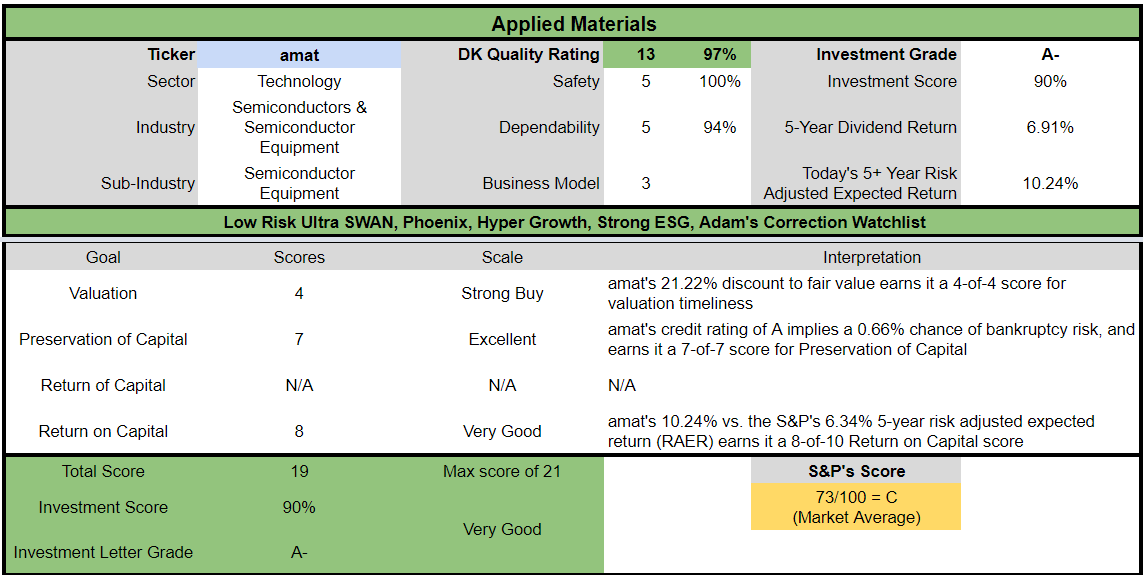
Applied Materials 2024 Consensus Total Return Potential
(Source: FAST Graphs, FactSet)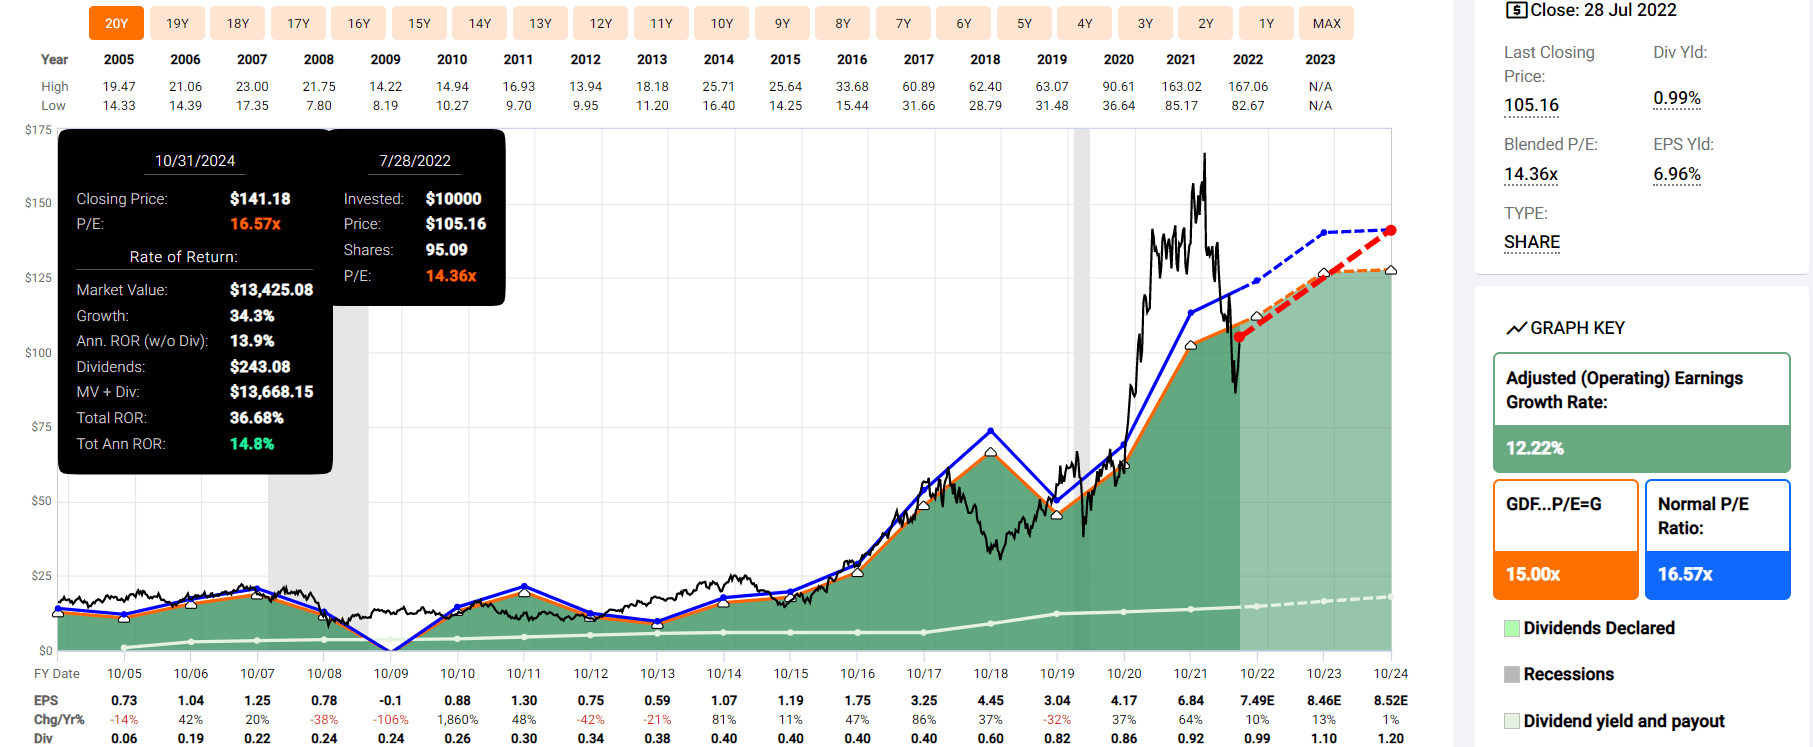
Applied Materials 2027 Consensus Total Return Potential
(Source: FAST Graphs, FactSet)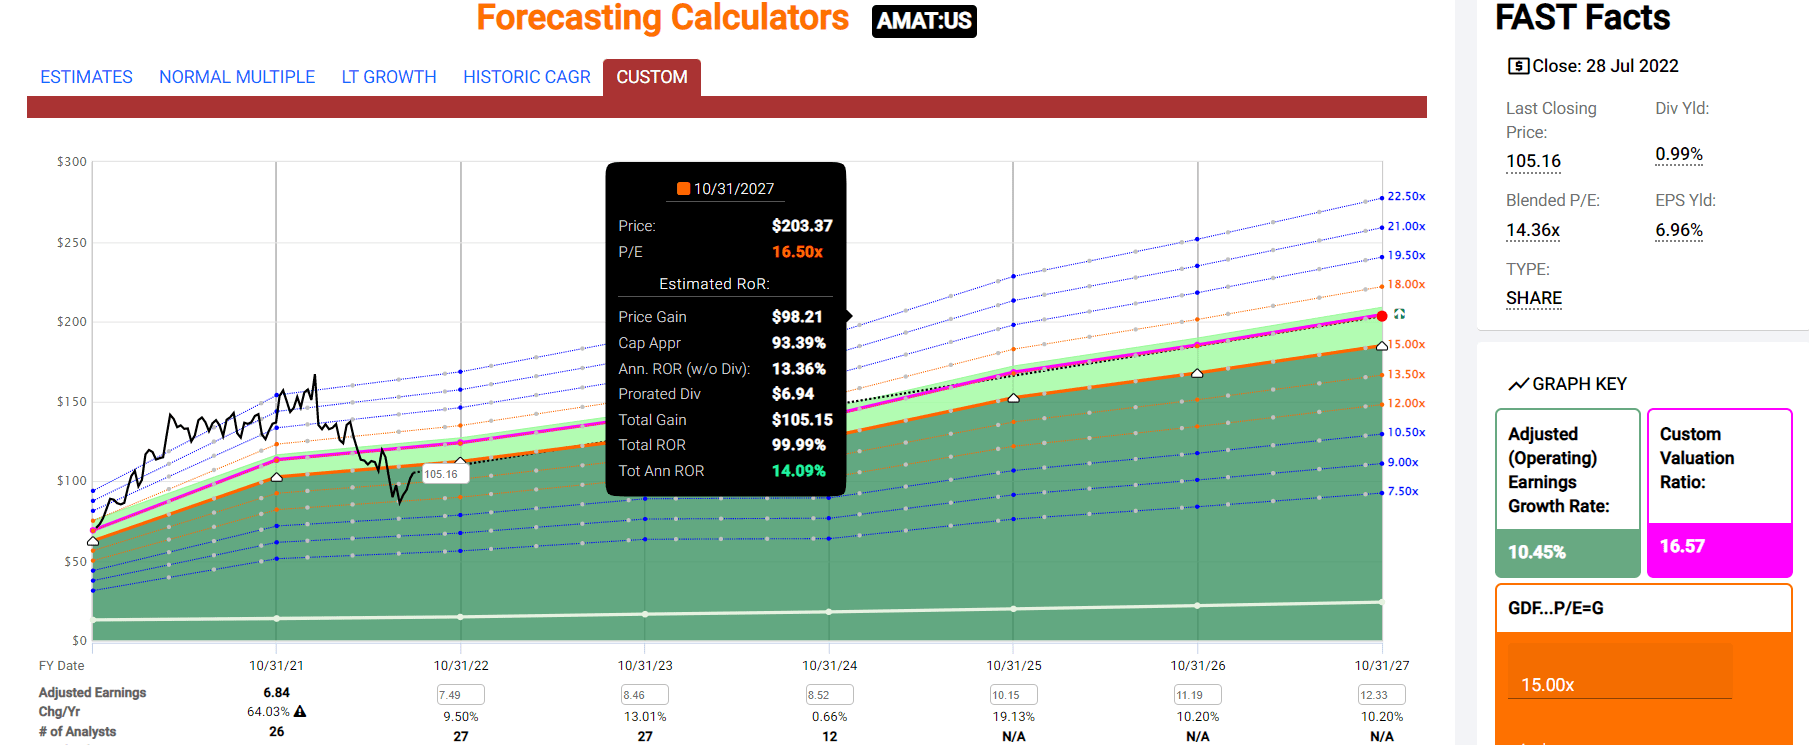
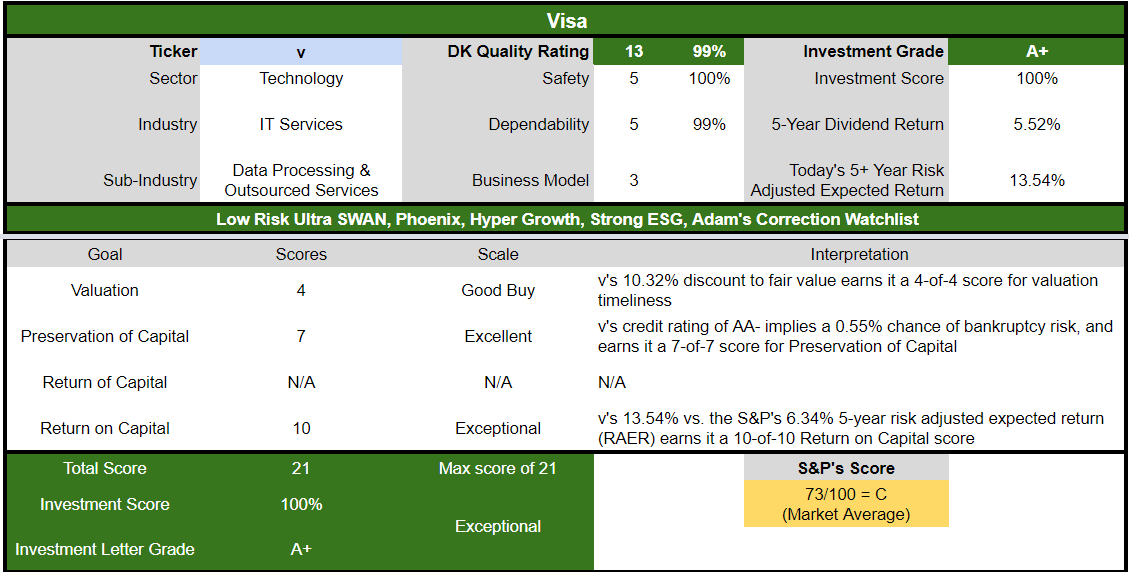
Visa 2024 Consensus Total Return Potential
(Source: FAST Graphs, FactSet)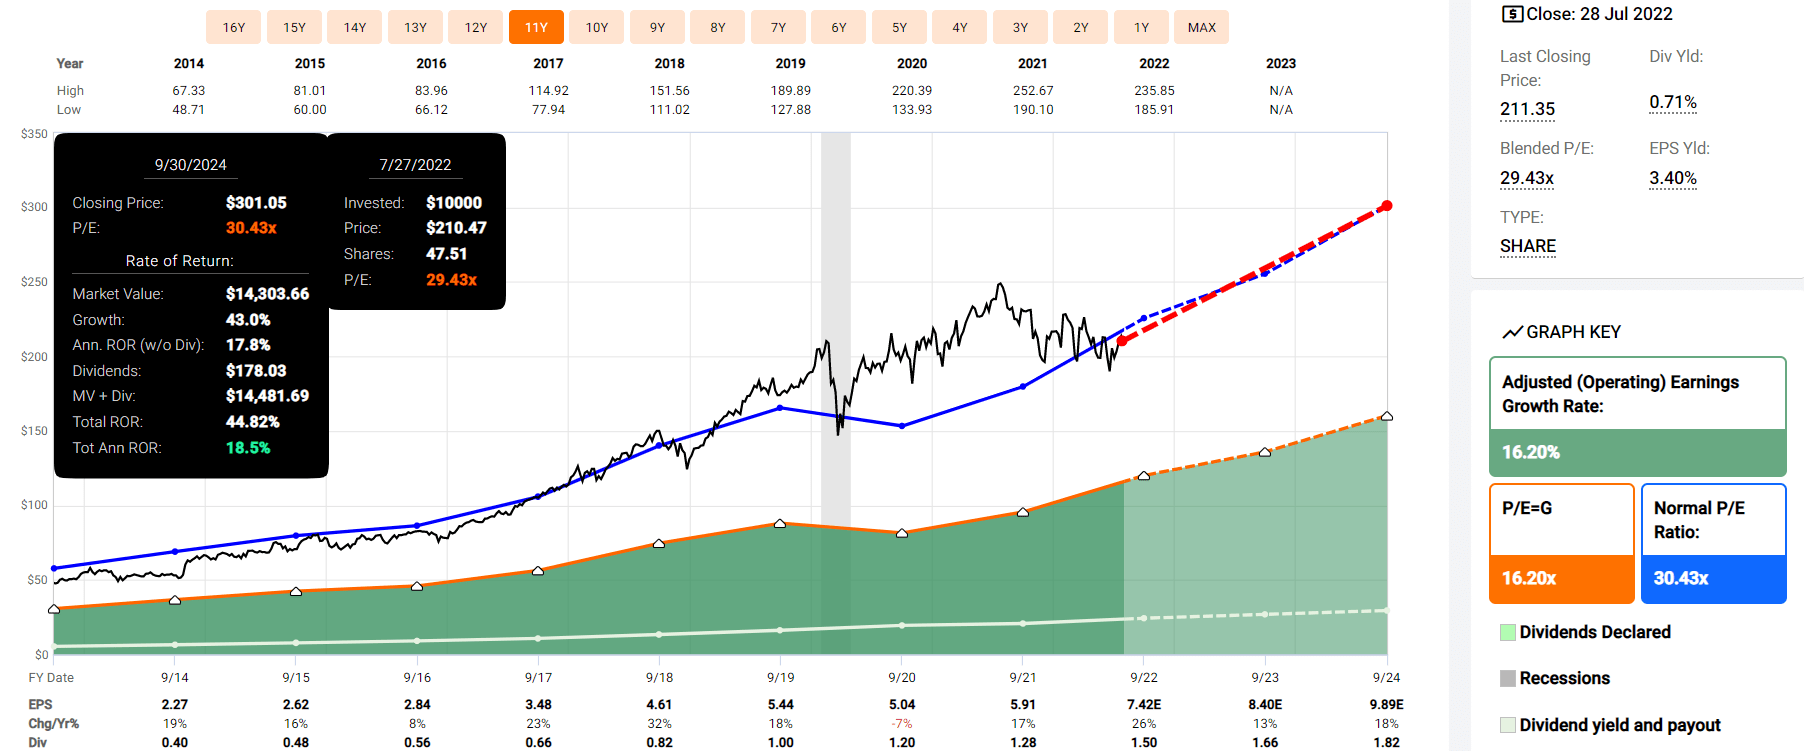
Visa 2027 Consensus Total Return Potential
(Source: FAST Graphs, FactSet)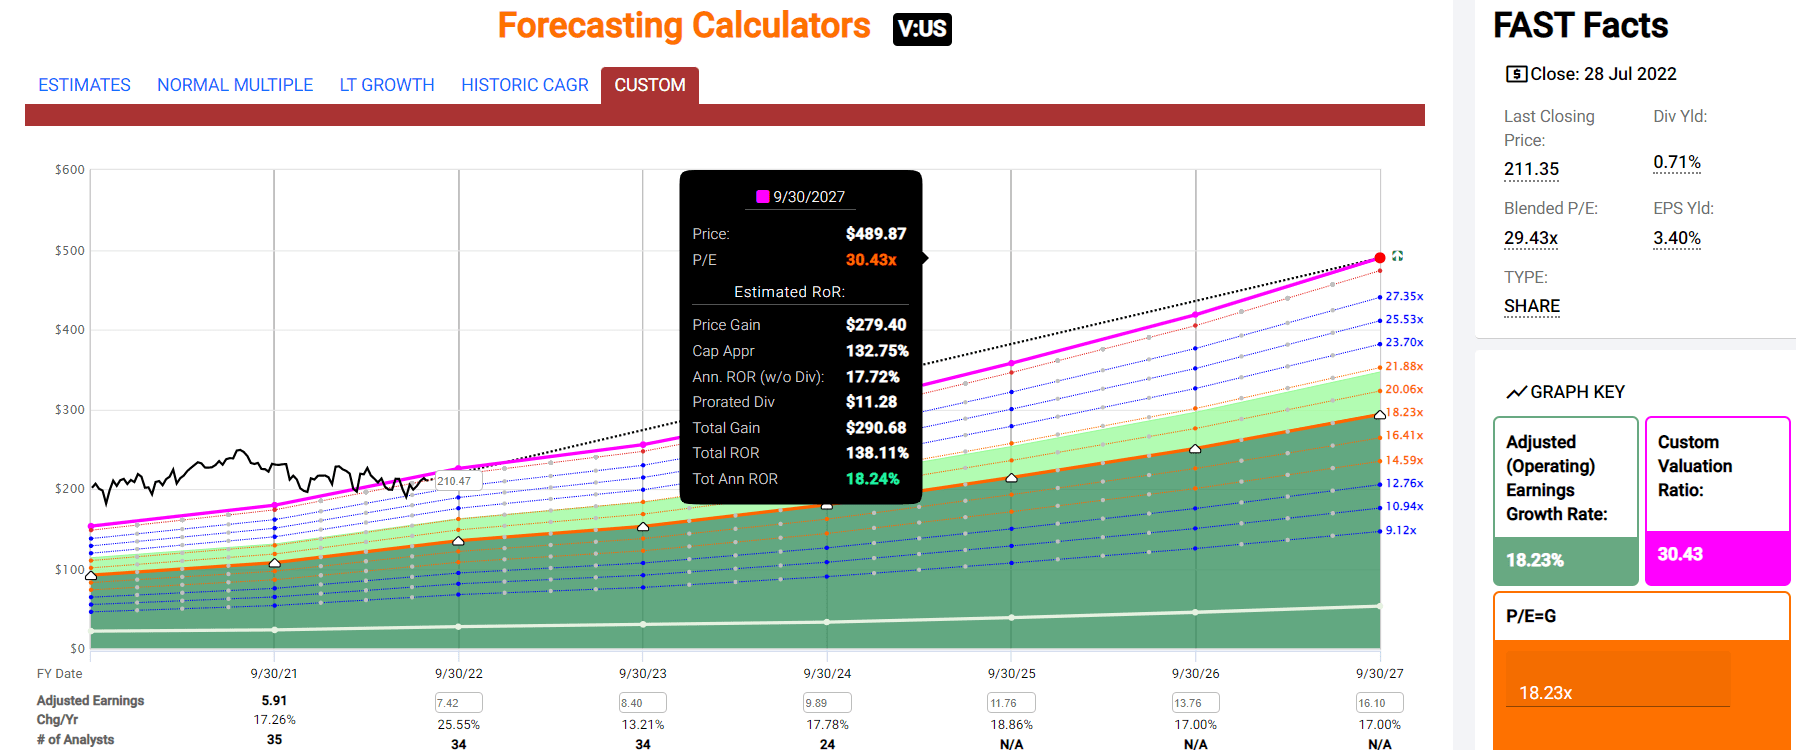
Texas Instruments 2024 Consensus Total Return Potential
(Source: FAST Graphs, FactSet)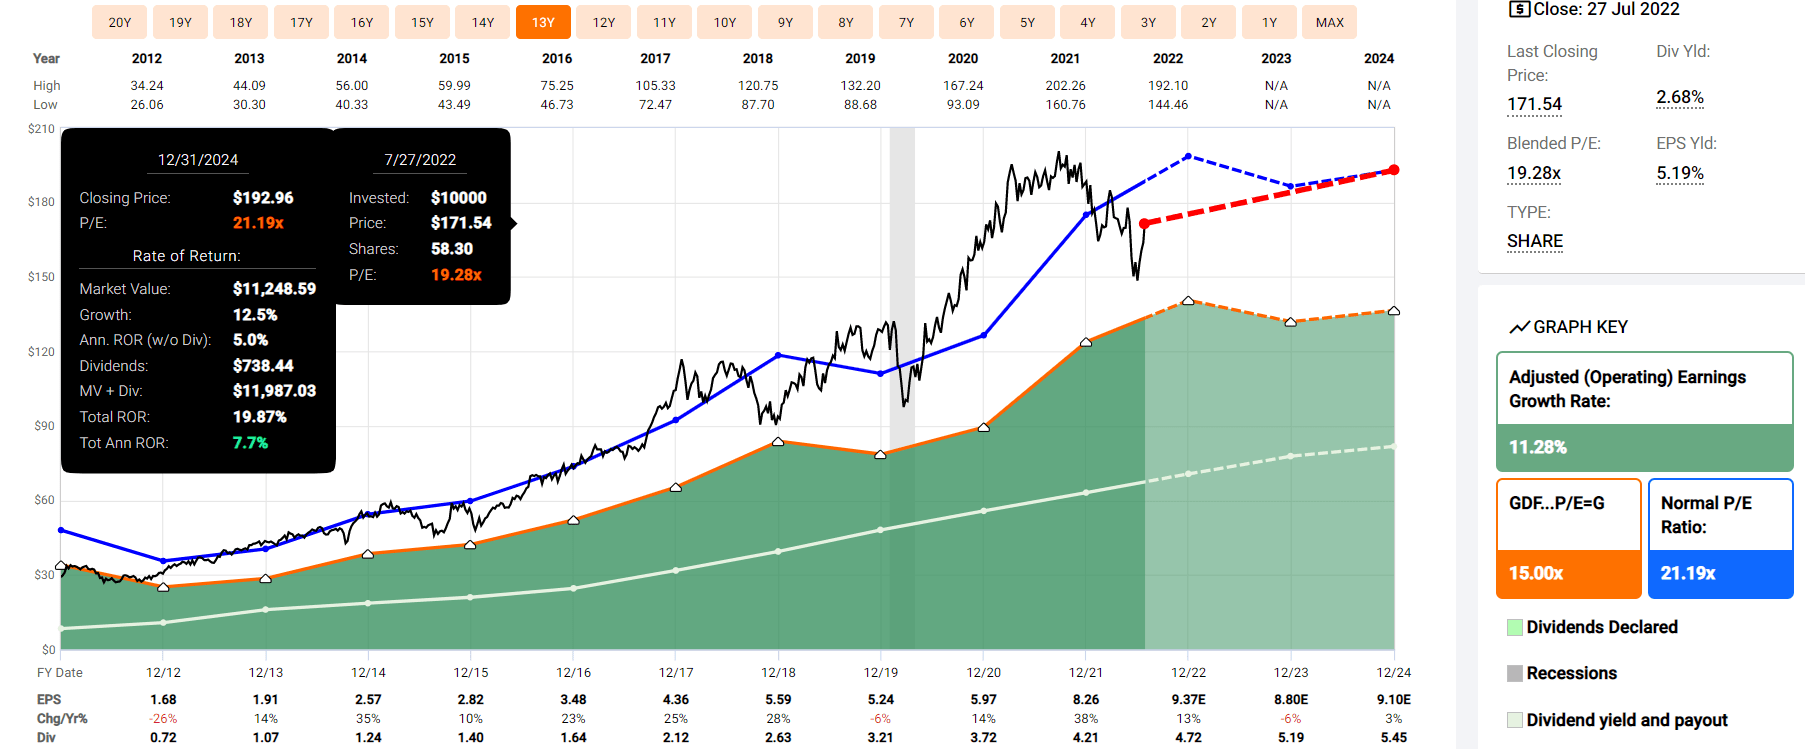
Texas Instruments 2027 Consensus Total Return Potential
(Source: FAST Graphs, FactSet)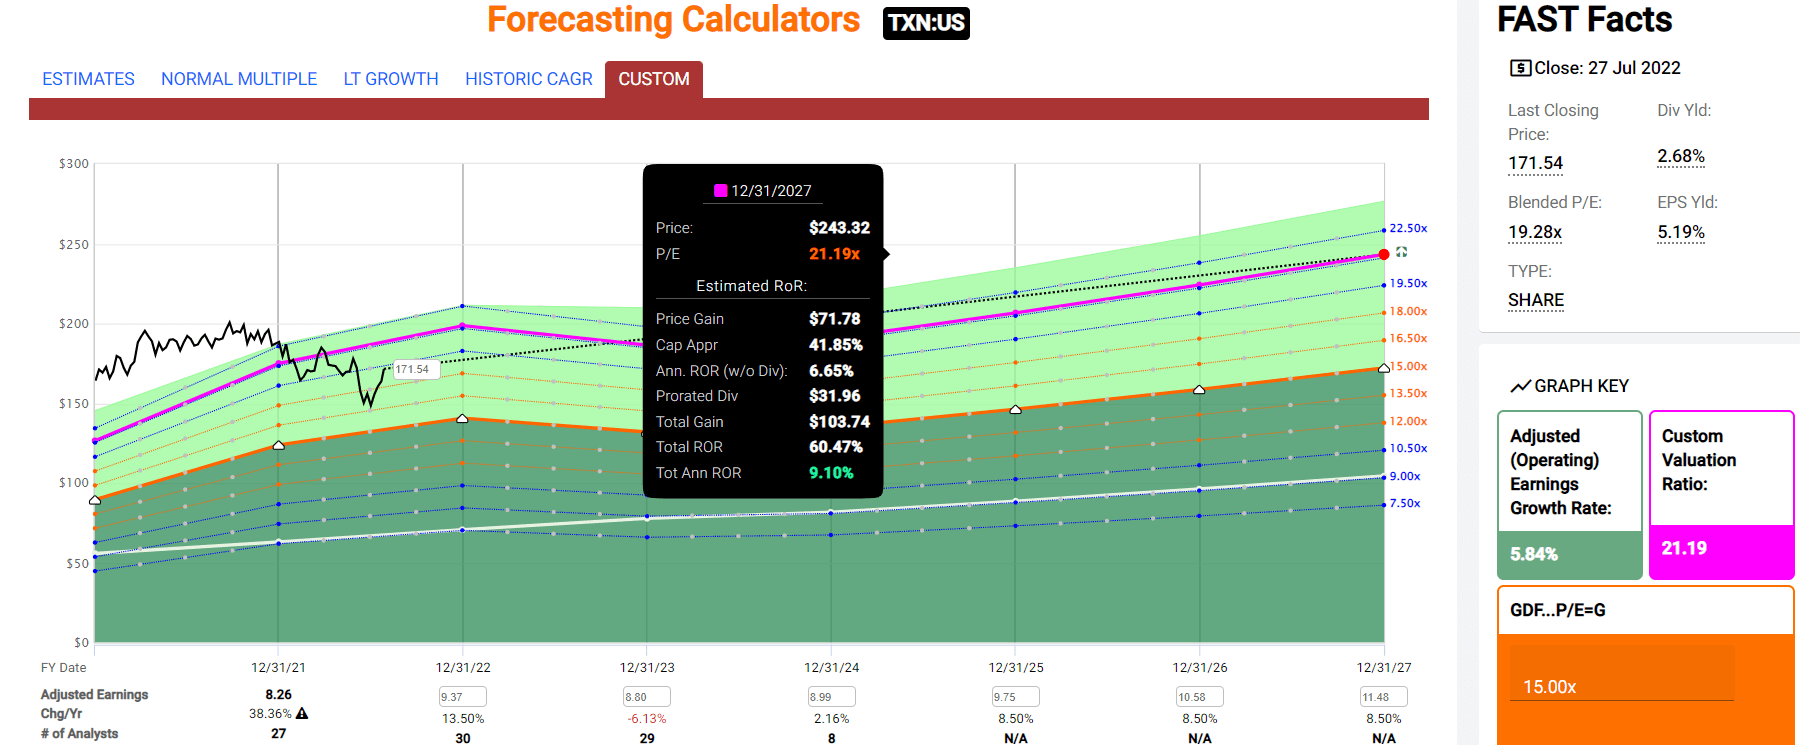
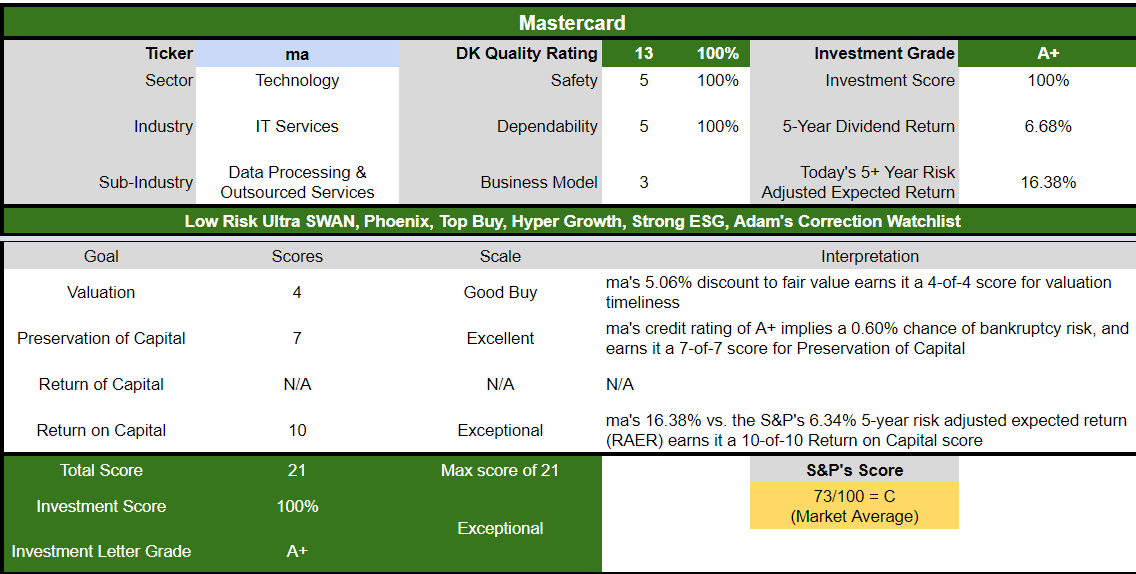
Mastercard 2024 Consensus Total Return Potential
(Source: FAST Graphs, FactSet)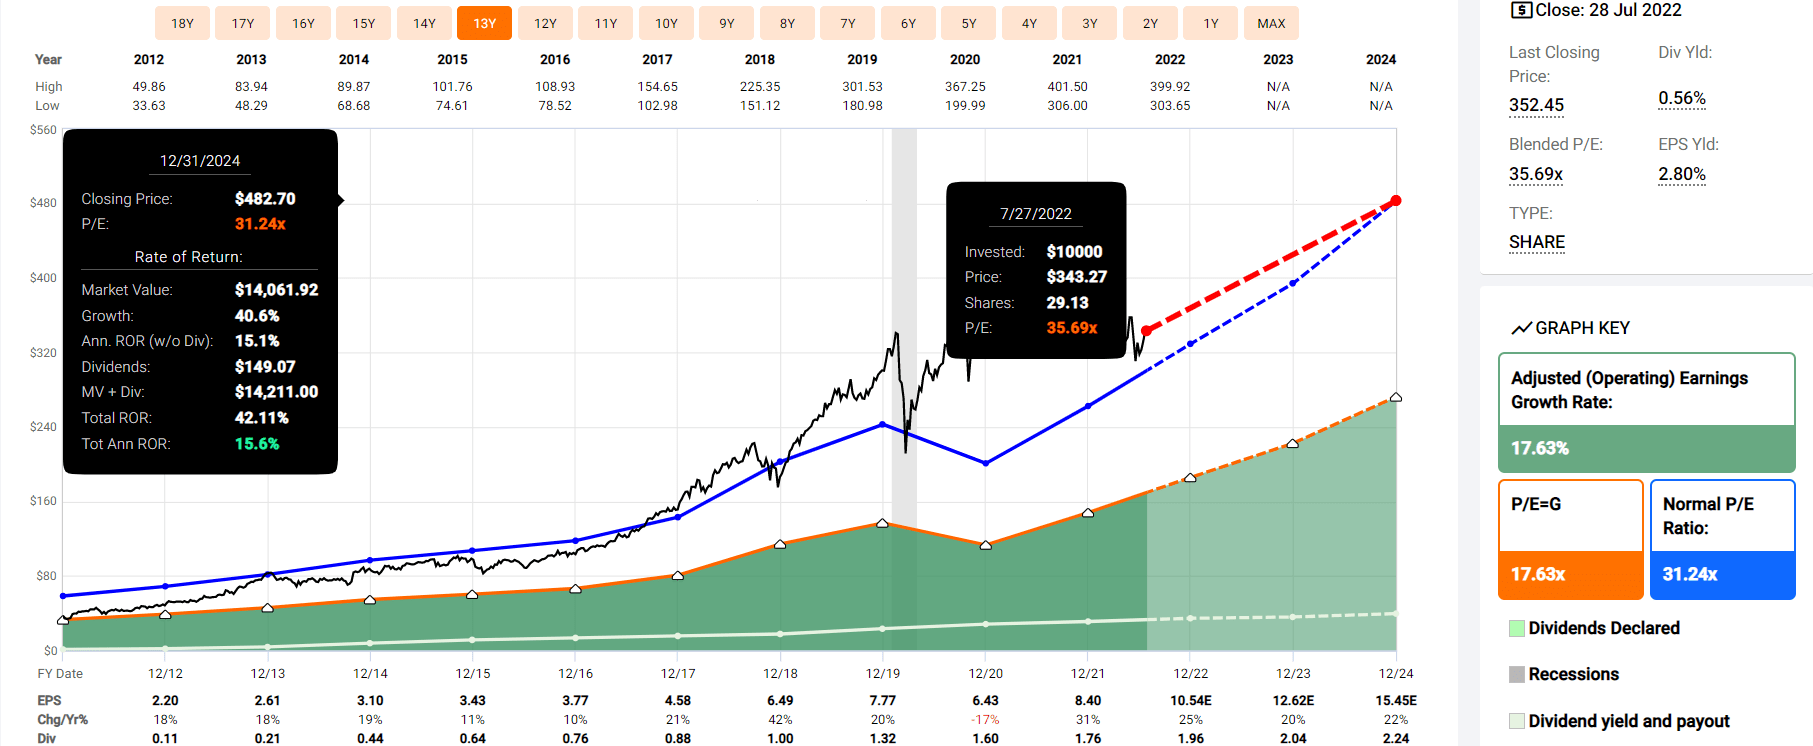
Mastercard 2027 Consensus Total Return Potential
(Source: FAST Graphs, FactSet)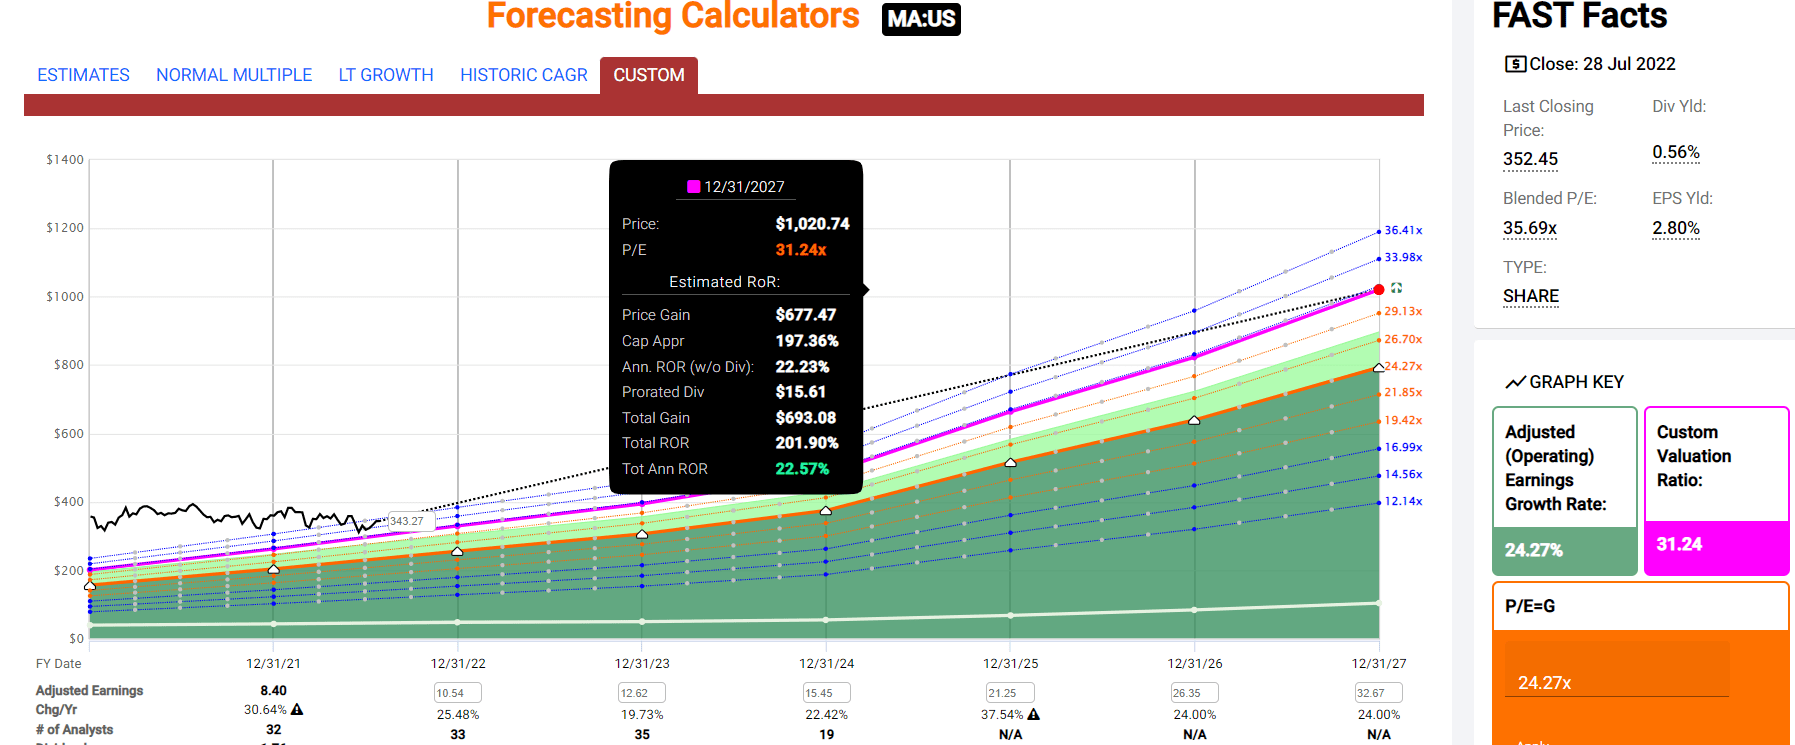
- Apple has -8% CAGR 2024 consensus return potential
- and 0% through 2027
- these blue-chip bargains have a 17% CAGR consensus return potential through 2024
- these blue-chip bargains have a 17% CAGR consensus return potential through 2027
And here’s how they compare against the S&P 500.
S&P 500 2024 Consensus Total Return Potential
(Source: FAST Graphs, FactSet)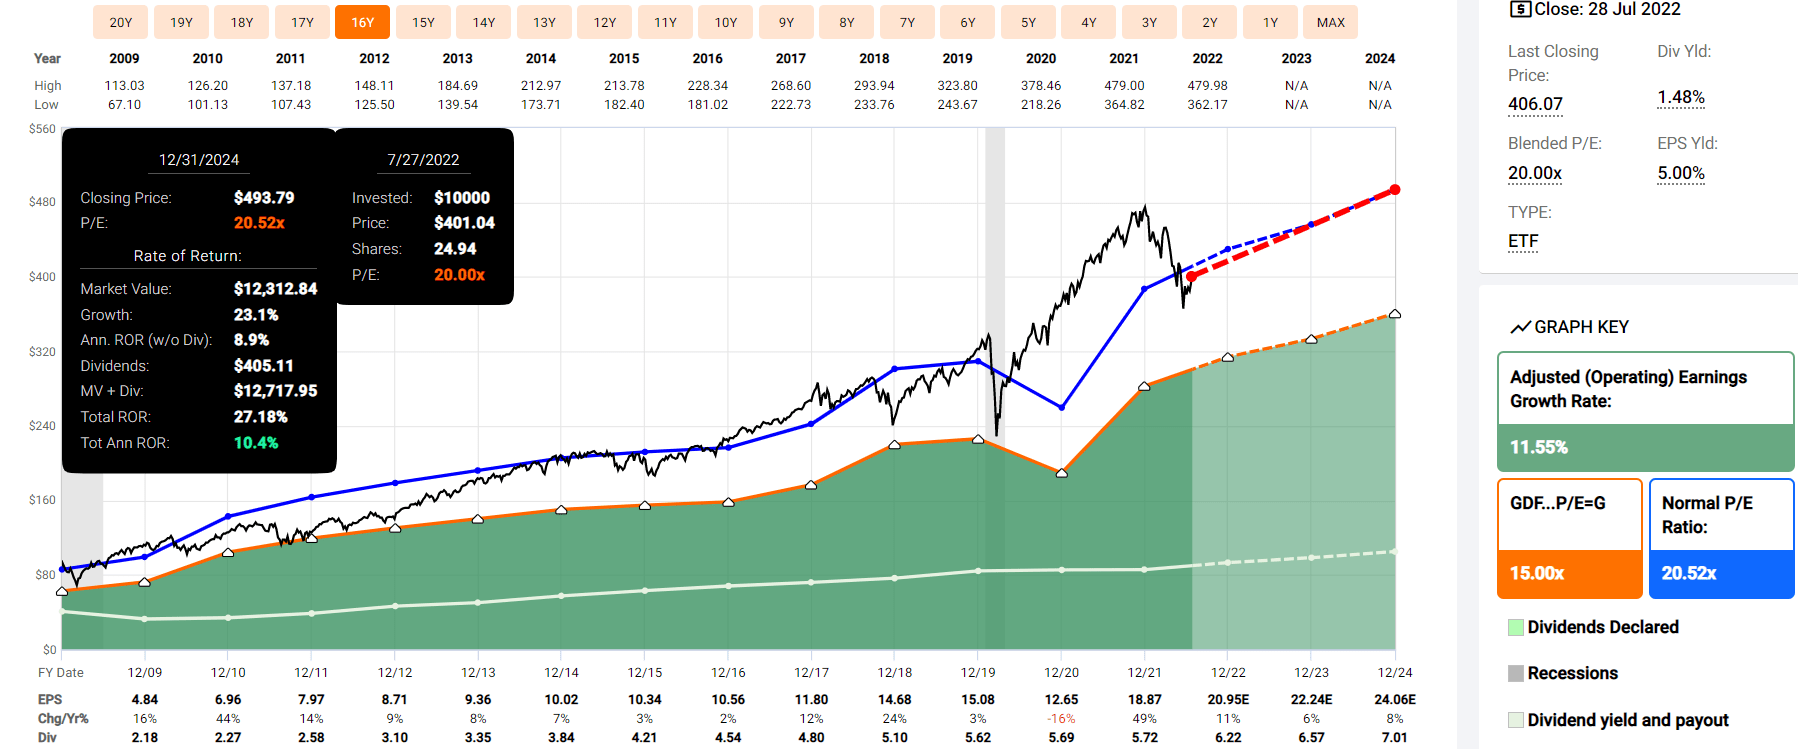
S&P 500 2027 Consensus Total Return Potential
| Year | Upside Potential By End of That Year | Consensus CAGR Return Potential By End of That Year | Probability-Weighted Return (Annualized) | Inflation And Risk-Adjusted Expected Returns | Expected Market Return Vs. Historical Inflation-Adjusted Return |
Conservative Years To Double |
| 2027 | 50.00% | 8.45% | 6.34% | 4.23% | 62.21% | 17.02 |
(Source: DK S&P 500 Valuation And Total Return Tool)
Analysts expect the market to deliver historically normal 10% annual returns through 2024 vs. AAPL’s -8% and 54% total returns over the next five years vs. AAPL’s 0%.
The S&P is a far better investment than Apple, and these six blue-chip bargains are better investments than the S&P 500.
Investment Decision Scores
DK Dividend Kings Automated Investment Decision Tool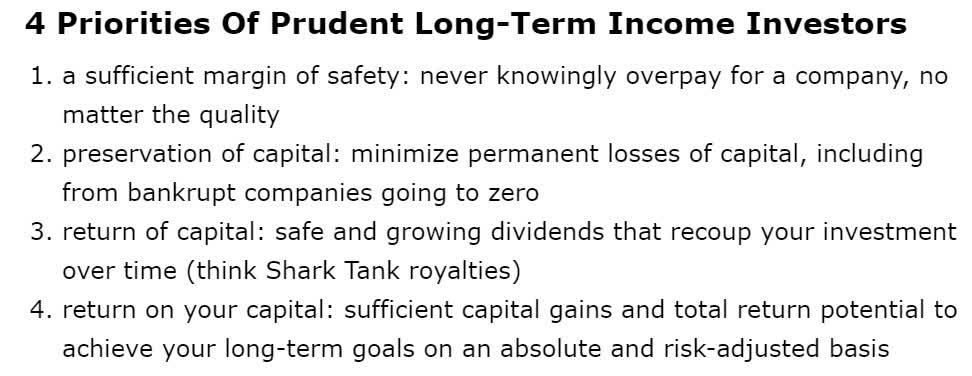
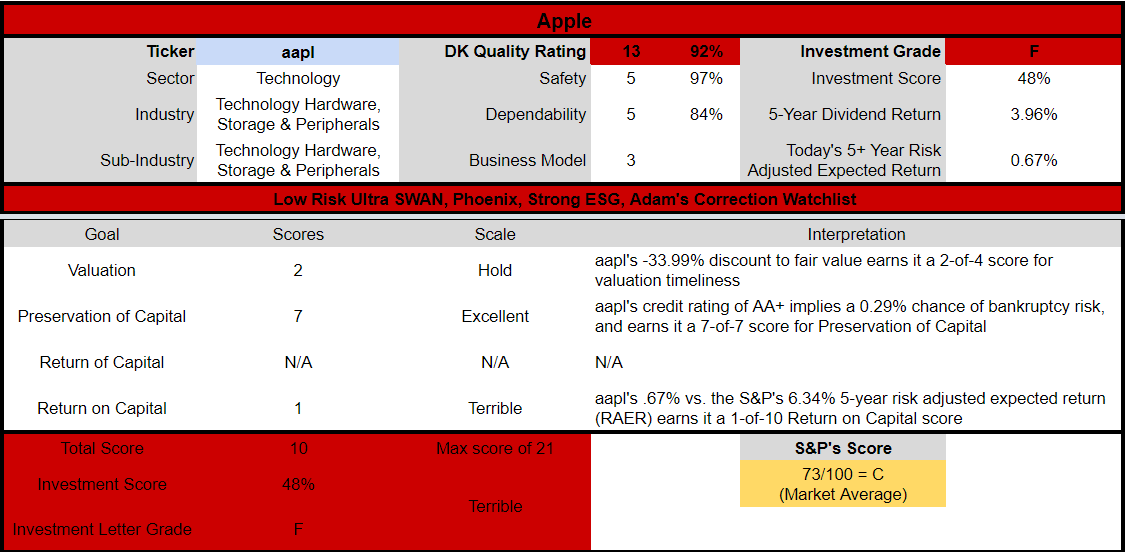
Apple’s risk-adjusted expected return over the next five years is just 0.7%. Compared to the S&P 500, Apple today is a terrible risk-adjusted investment opportunity.
Now compare it to our higher quality, faster-growing, and undervalued Ultra SWAN bargains.
Dividend Kings Automated Investment Decision Tool Dividend Kings Automated Investment Decision Tool Dividend Kings Automated Investment Decision Tool Dividend Kings Automated Investment Decision Tool Dividend Kings Automated Investment Decision Tool Dividend Kings Automated Investment Decision Tool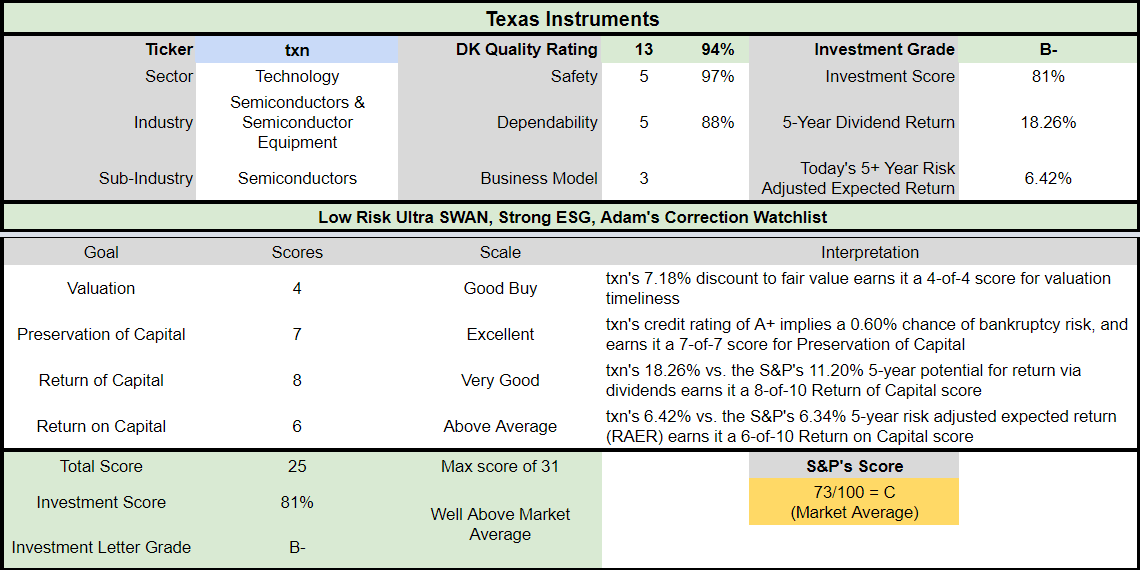
And what if we buy the top five highest growing Ultra SWANs?
5 Fastest Growing Apple Alternative Investment Decision Score
Dividend Kings Automated Investment Decision Tool, Combinator Tab Dividend Kings Automated Investment Decision Tool, Combinator Tab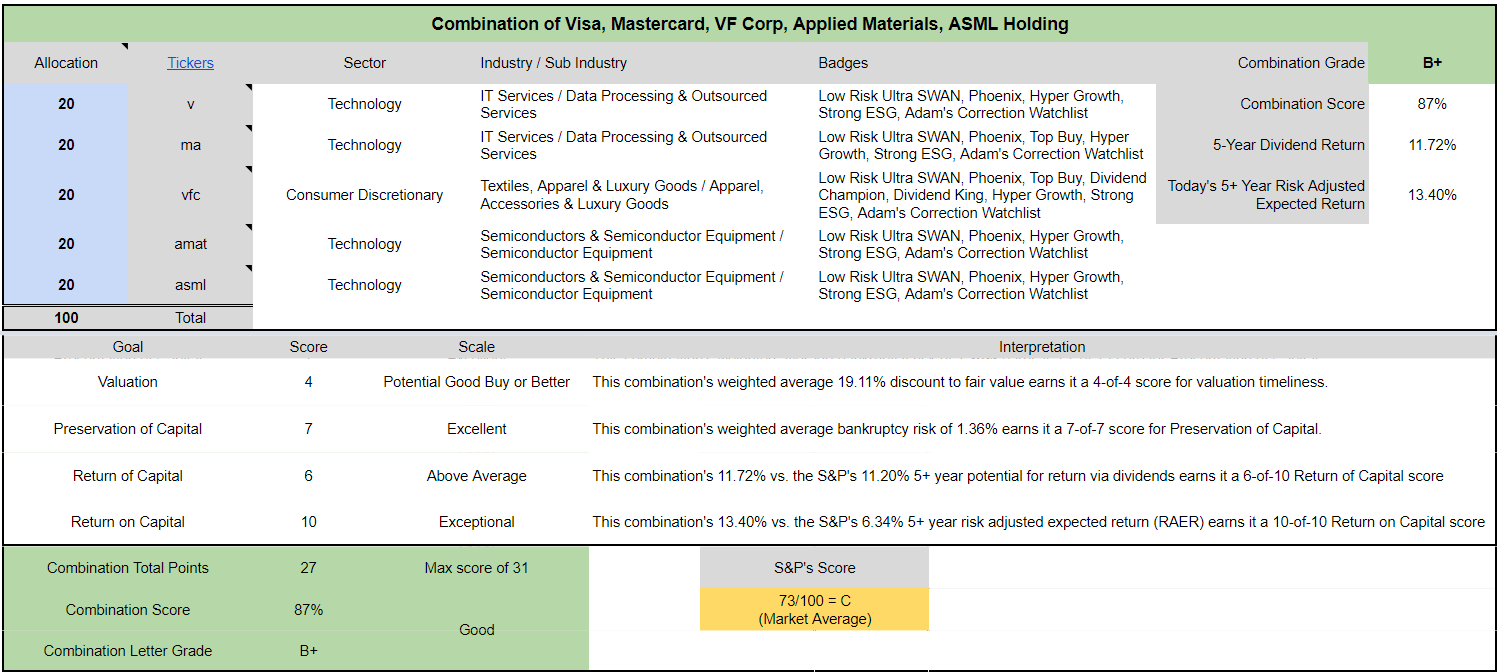
These Ultra SWANs are higher quality than Apple, with superior safety, especially since these dividends are being funded with cash flow from five companies in two sectors.
They have a 13.4% CAGR risk-adjusted expected return over the next five years vs. 0.7% for Apple.
What are risk-adjusted expected returns?
- start with the five-year analyst consensus
- and apply the companies’ historical margins of error (probability of not growing as expected)
- and apply the probability of not returning to fair value over the next five years
- and apply their bankruptcy risk (risk of going to zero)
Dividend Kings Automated Investment Decision Tool, Combinator Tab Dividend Kings Automated Investment Decision Tool, Combinator Tab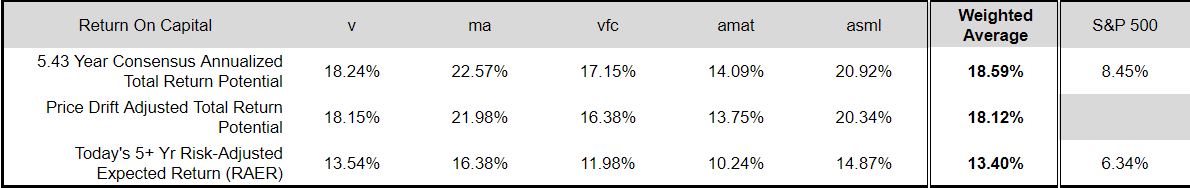
These five Ultra SWANs are 19% undervalued, while Apple is 33% overvalued.
Dividend Kings Automated Investment Decision Tool, Combinator Tab
They are all A-rated companies or better, with an average 30-year bankruptcy risk of 1.36% Vs. Apple’s 0.29%.
- the probability of all five going bankrupt is effectively zero
These five or six Ultra SWANs are all superior dividend growth opportunities to Apple today.
Bottom Line: Apple Is A Retirement Dream Stock But Buy These 3 Better Blue-Chip Bargains Today
If we get a recession in 2023, the market may fall 30% to 52%, and Apple becomes fairly valued or undervalued and becomes an incredible long-term buying opportunity. How like is a recession in 2023?
- Morgan Stanley estimates a 36% probability
- Goldman Sachs 34%
- Moody’s 45%
- Bloomberg 40%
Most blue-chip economists think the risk is rising, though slow but positive growth remains the base-case. If we do get a recession it’s likely to be mild.
How mild? Bank of America’s latest 2023 US GDP economic growth forecast:
- -0.2%
- vs. -0.5% Deutsche Bank
- vs. 2001’s -0.4% (the mildest recession in US history thus far )
Moody’s expects US job growth to fall steadily to 175K within 12 months.
- potentially the first recession ever to see falling unemployment
- Moody’s also expects US home prices to remain flat for 3 to 4 years
- no big housing crash
What does this mean for investors? That the most likely bear market bottom is around -30% to -40%, not the scary 60% to 90% crashes the prophets of doom keep predicting.
With Apple’s increasingly stable cash flows, mountain of cash, historic free cash flows, and AA+ credit rating, there’s very little for Apple investors to fear from any recession.
The world’s largest company will not deliver 30% returns in the future. That’s simply unrealistic. But around 11% long-term returns, about 1% higher than the S&P 500, are possible and what analysts expect.
From a fundamental risk-adjusted perspective, Apple, at fair value or better, is one of the most reasonable and prudent long-term dividend growth investments you can buy.
But from today’s 33% historical premium, Apple is literally pricing in the next five years’ worth of growth.
- US treasuries are expected to outperform Apple over the next half-decade
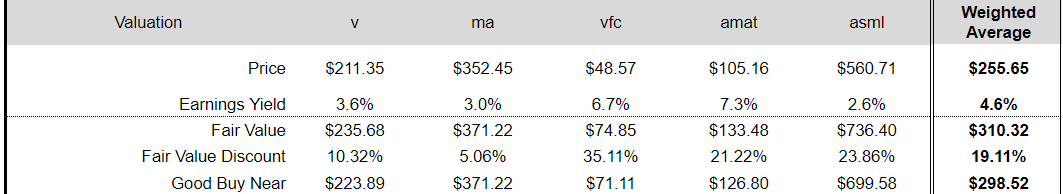
And that’s where superior Ultra SWAN dividend growth bargains like V, MA, VFC, AMAT, TXN, and ASML come in.
- 1.7% very safe yield (3X the yield of Apple and much safer dividends)
- 15.0% consensus growth = 50% more than Apple
- 16.7% long-term return potential = 55% better than Apple’s 10.8% CAGR
- 17% undervalued vs. Apple’s 33% premium
- 17% CAGR consensus return potential through 2024 and 2027 vs. 0% Apple
- 13.4% CAGR risk-adjusted expected returns, 2X better than the S&P 500 and 19X better than Apple
If you bought Apple at fair value or better, you can safely ignore the current overvaluation because you’ve locked in likely market-beating returns for decades to come.
If you’re considering buying Apple today, be aware that its 24.3 PE is historically very high and a speculative investment.
In contrast, V, MA, VFC, AMAT, TXN, and ASML are a potentially strong buy, representing some of the world’s highest quality, safest, and fastest growing dividend blue-chips.
No matter what the economy or market throws at us in the coming years, I can say with 80% confidence that anyone buying these Ultra SWAN blue-chips will be very happy with the results in 5+ years.
And over 10-plus years? They could deliver life-changing, rich retirement returns.
Because while your portfolio’s returns over two to three years are a crap shoot, over 20 to 30-plus years, they are destiny.
If you trust the world’s best companies with your savings and buy at reasonable or attractive valuations, then you don’t have to pray for luck on Wall Street because you’ll make your own.
Luck is what happens when preparation meets opportunity.” – Seneca the younger
This is how you practice hyper-dividend growth investing the smart way, the safe way, the Dividend Kings way.
This is how you harness the world’s best companies so they can work hard for you so that one day, you don’t have to.
Be the first to comment