

RuslanDashinsky/iStock via Getty Images
Self-Storage REITs have taken a beating this year, despite strong operating results. They have outperformed the REIT average, but that’s not saying much, in a year when the Equity REIT Index has lost (-25.01)% and lagged the dismal returns of both the Dow Jones (-7.17)% and the S&P 500 (-16.90)%. Storage REITs, by contrast, even after Thursday’s monster rally, have averaged a loss of “only” (-22.17)%.
Hoya Capital Income Builder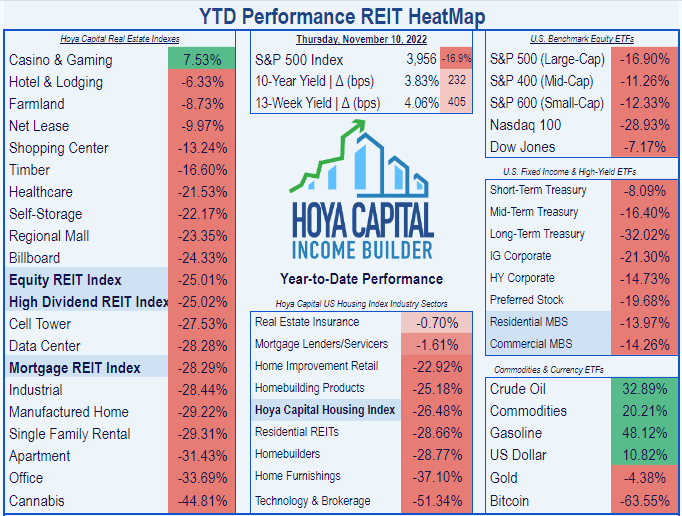
This has created an abundance of bargains in the Storage REIT sector. These are not struggling companies with dwindling revenues and mounting debts, but instead, healthy companies with strong balance sheets, bright prospects, low cap-ex needs, and brisk increases in revenue and cash flows, that just happen to be available at unusually low prices and unusually high Yields.
According to Hoya Capital’s latest report on this sector, after spiking sharply in 2021, Self-Storage rents have begun leveling off, but at rates much higher than pre-pandemic levels.
Hoya Capital Income Builder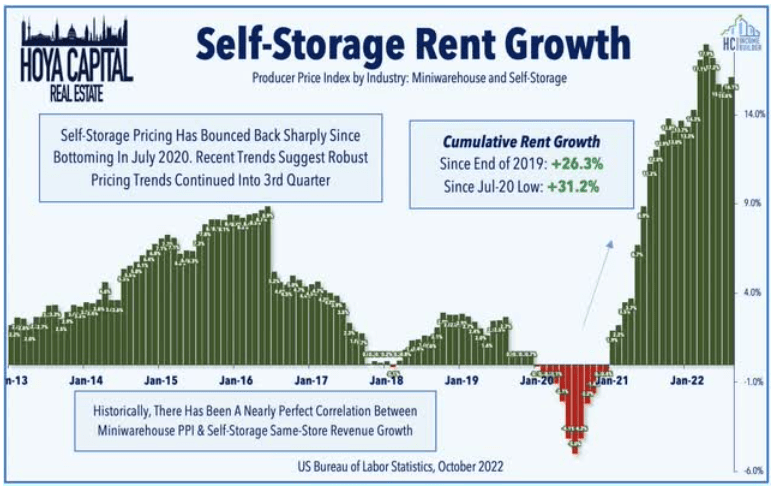
Average growth in Core FFO (funds from operations) for H1 2022, though down from the previous year, was still over 20%.
Hoya Capital Income Builder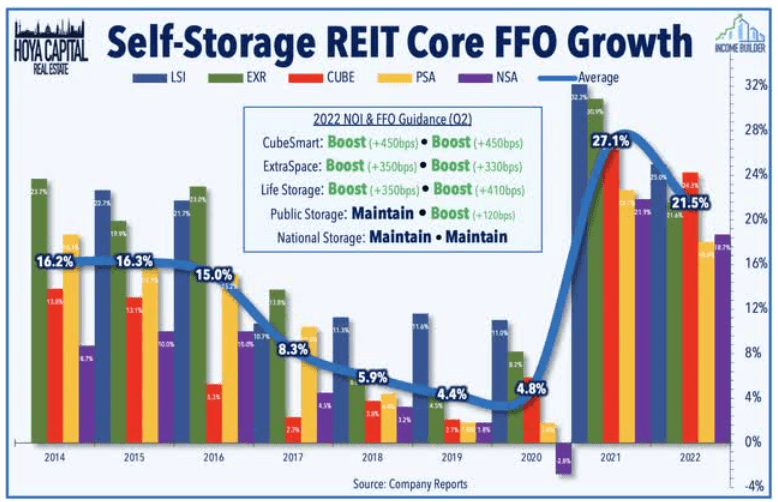
Three of the companies in this sector raised NOI guidance when reporting H1 2022 results, while the others maintained.
Hoya Capital Income Builder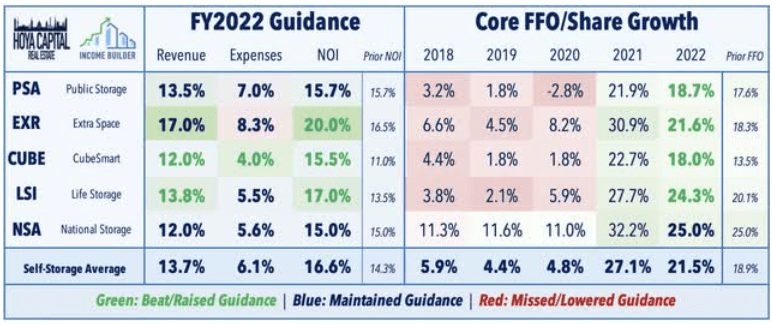
At the same time, same-store NOI across the sector, which spiked in 2021, has leveled off at an impressive 20.8%, far outstripping the REIT average of 8.3%.
Hoya Capital Income Builder
As Hoya Capital notes,
. . . with “full occupancy” across most facilities, rent growth will continue to be the primary driver of same-store performance in 2022. . . new lease rates have trended ahead of initial expectations throughout the year.
Demand has remained strong. One indication is that Google searches for “storage unit” remain 40% above pre-pandemic levels.
Hoya Capital Income Builder
Meanwhile, according to Hoya,
elongated construction timelines continue to suppress speculative development . . . construction spending data from the Census Bureau has indicated that the peak in development appears to have occurred in 2017 and declined by more than 10% in 2021, but soaring rents and record-high occupancy rates have spurred a rebound in starts over the past several quarters.
Hoya Capital Income Builder
Opportunities for external growth should be especially plentiful in the near term. Storage REITs acquired more than $10B in assets over the past year, yet publicly traded REITs still own only about 25% of all the storage facilities in the U.S.
Hoya Capital Income Builder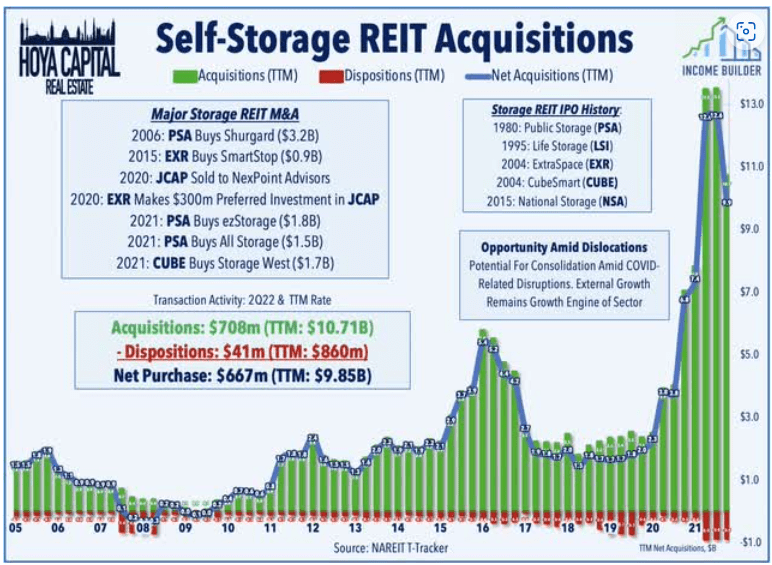
A note of caution: storage demand is driven mostly by housing market activity – specifically moving rates and household formations. If the rate-driven slowdown in home sales lingers deep into 2023, it could adversely affect Storage REITs.
Meanwhile, the brutal sell-off across the REIT sector has created some notable bargains. This article identifies 3 of the best companies available in the bargain-rich Storage REIT sector.
Life Storage, Inc.
Life Storage, Inc.
Life Storage, Inc. (LSI) operates more than 1100 stores in 36 states, concentrated more in the southern half of the U.S., with same-store occupancy of 93% as of August 31, and 25% same-store NOI growth in H1 2022.
Company investor presentation
LSI is different from other Storage REITs because of two important innovations:
- online, touchless self-service rentals (about 35% of rental revenue) and
- storage for e-commerce (“Warehouse Anywhere” program)
plus
- extensive use of third-party management (increasing revenue without increasing debt, augmenting the acquisition pipeline by spotting more profitable off-market opportunities, improving operational decision-making by capturing more customer data, and increasing LSI’s brand awareness), and
- extensive engagement in joint ventures (generating higher returns due to fee collection in addition to equity, including all the benefits of third-party management listed above; and lowering the company’s risk in acquiring recently built facilities in the early stages of lease-up).
The company’s Q3 2022 results showed a 26% increase in adjusted FFO (funds from operations) from the same period a year ago, and an increase of 18.4% in same-store NOI. In Q3 alone, LSI added 11 more wholly-owned stores, 15 stores through joint ventures, and 25 more through third-party management.
Here are LSI’s growth statistics over the past 3 years.
| Metric | 2019 | 2020 | 2021 | 2022* | 3-year CAGR |
| FFO (millions) | $266 | $277 | $400 | $563 | — |
| FFO Growth % | — | 4.1 | 44.4 | 40.1 |
28.6% |
| FFO per share | $3.75 | $3.97 | $5.07 | $6.36 | — |
| FFO per share Growth % | — | 5.9 | 27.7 | 25.4 | 19.4% |
| TCFO (millions) | $279 | $299 | $434 | $588 | — |
| TCFO Growth % | — | 7.2 | 45.2 | 35.5 | 28.4 |
Source: TD Ameritrade, Hoya Capital Income Builder, and author calculations
* Projected, based on results through Q3 2022.
LSI’s growth in FFO and cash flow has been nothing short of spectacular. In light of its strong balance sheet, this company is a bona fide FROG. FFO and TCFO for this company have accelerated every quarter of 2022.
The investment-grade balance sheet is rock-solid, with liquidity over 2.0, and low debt.
| Company | Liquidity Ratio | Debt Ratio | Debt/EBITDA | Bond Rating |
| LSI | 2.02 | 18% | 5.3 | BBB |
Source: Hoya Capital Income Builder, TD Ameritrade, and author calculation
Thanks to the sell-off, LSI now sports a very safe dividend Yield of 4.25%, and with its spectacular dividend growth rate of 17.4%, earns a Dividend Score of 6.88.
| Company | Div. Yield | 3-yr Div. Growth | Div. Score | Payout | Div. Safety |
| LSI | 4.25% | 17.4% | 6.88 | 69% | B |
Source: Hoya Capital Income Builder, TD Ameritrade, Seeking Alpha Premium
Dividend Score projects the Yield three years from now on shares bought today, assuming no change in the rate of dividend growth.
Meanwhile, the price/FFO on LSI has fallen slightly below the overall REIT average, which is unusual for this company, and shares sell at a (-21.7)% discount to NAV (net asset value).
| Company | Div. Score | Price/FFO ’22 | Premium to NAV |
| LSI | 6.80 | 16.0 | (-21.7)% |
Source: Hoya Capital Income Builder and Seeking Alpha Premium
CubeSmart
CubeSmart Self Storage
Headquartered in Malvern, Pennsylvania, and founded in 2004, CubeSmart (CUBE) owns and/or operates 1,289 properties in 155 markets, across 39 U.S. states, valued at $7.27 billion, with 94.4% same-store occupancy.
Company investor presentation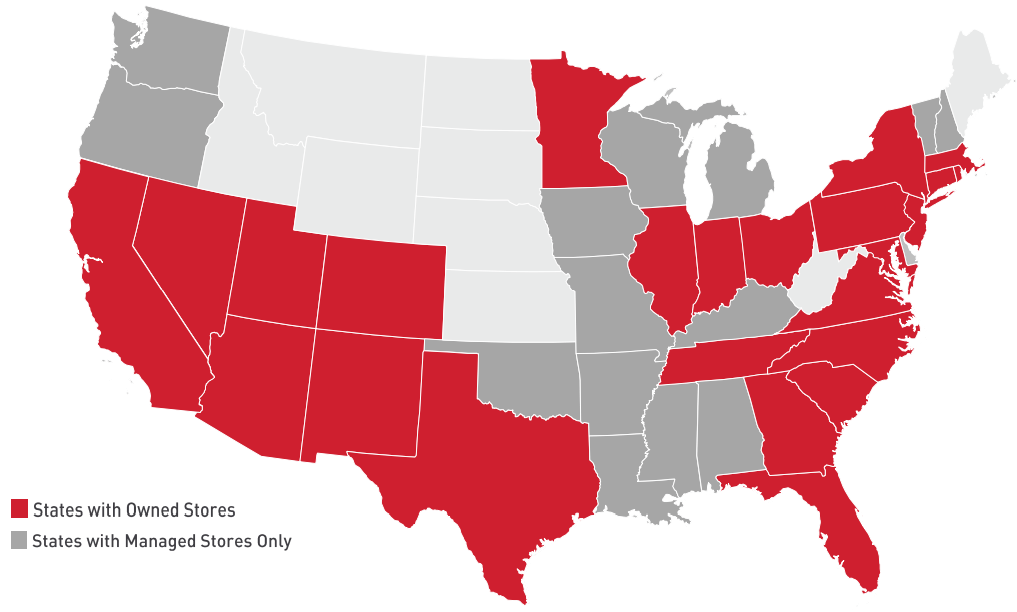
The company favors large urban centers, with locations in densely-populated areas. The larger the MSA (metropolitan statistical area), the more concentrated CUBE’s holding are, by NOI. Thus, the top 10 MSAs account for 59% of the company’s NOI, while the bottom 115 markets account for just 11%.
Company investor presentation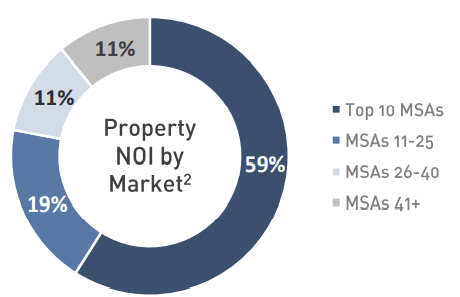
CUBE’s locations are in more densely-populated areas than any of its Storage REIT peers. The average number of people living within 3 miles of a CUBE location is about 175,000, compared to about 125,000 for runner-up Extra Space Storage (EXR).
Company investor presentation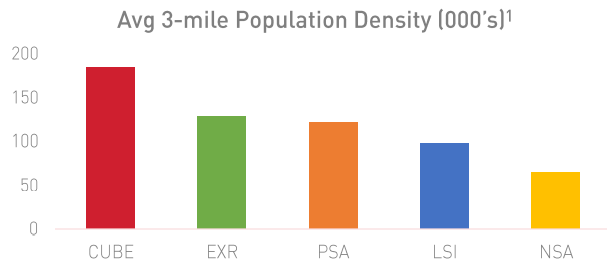
CubeSmart’s recently reported Q3 2022 results showed a 15.4% increase in same-store NOI compared to the same period last year, and an increase of 17.9% in FFO.
Here are CUBE’s growth statistics over the past 3 years.
| Metric | 2019 | 2020 | 2021 | 2022* | 3-year CAGR |
| FFO (millions) | $326 | $321 | $410 | $563 | — |
| FFO Growth % | — | (-1.5) | 2.7 | 37.3 |
20.1% |
| FFO per share | $1.69 | 1.72 | $2.11 | $2.50 | — |
| FFO per share Growth % | — | 1.8 | 22.7 | 18.5 | 14.0% |
| TCFO (millions) | $332 | $351 | $449 | $595 | — |
| TCFO Growth % | — | 10.5 | 27.9 | 32.5 | 21.6% |
Source: TD Ameritrade, Hoya Capital Income Builder, and author calculations
* Projected, based on results through Q3 2022.
CUBE has grown revenue and cash flow at double digit rates, across the board. Like LSI, this company is also a FROG.
CubeSmart’s investment-grade balance sheet shows a sturdy liquidity ratio of 1.81, with low debt ratio and Debt/EBITDA.
| Company | Liquidity Ratio | Debt Ratio | Debt/EBITDA | Bond Rating |
| CUBE | 1.81 | 20% | 4.8 | BBB |
Source: Hoya Capital Income Builder, TD Ameritrade, and author calculation
Always an above-average dividend payer, CUBE’s Yield has risen to 4.43%, and with strong, double-digit dividend growth, this company earns a Dividend score of 5.91, along with a nearly-ideal C+ for Dividend Safety.
| Company | Div. Yield | 3-yr Div. Growth | Div. Score | Payout | Div. Safety |
| CUBE | 4.43% | 10.1% | 5.91 | 70% | C+ |
Source: Hoya Capital Income Builder, TD Ameritrade, Seeking Alpha Premium
Yet despite its double-digit growth rate, strong balance sheet, and sturdy Yield, CUBE’s price/FFO has dropped noticeably below the REIT average, and shares sell for a whopping (-33.0)% discount to NAV.
| Company | Div. Score | Price/FFO ’22 | Premium to NAV |
| CUBE | 5.91 | 15.5 | (-33.0)% |
Source: Hoya Capital Income Builder and Seeking Alpha Premium
National Storage Affiliates
National Storage Affiliates
Headquartered in Greenwood Village, Colorado, and founded in 2013, National Storage Affiliates (NSA) owns 1,076 properties in 43 states, boasting 93% occupancy. Of these, 83% are wholly owned by NSA, and the other 17% are held in joint ventures. Assets are mostly in secondary markets, with the heaviest concentrations in Sunbelt states like Georgia, Florida, Texas, and California.
Company investor presentation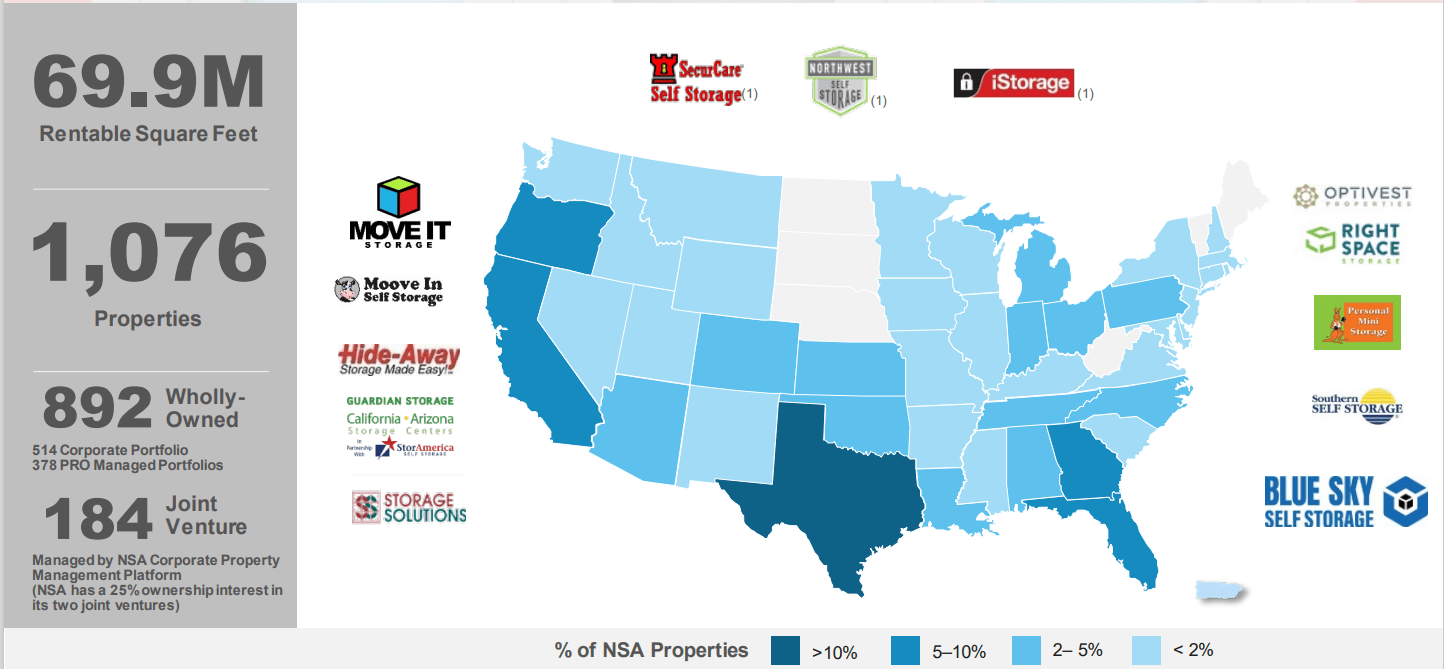
NSA grows by acquiring regional operators with 20 or more institutional-quality properties. Flexible purchase terms often include OP (operating partnership) units and SP (subordinated performance) units, which effectively bring the seller on as junior partners. OP and SP units typically account for about 25% of the acquisition price, which cuts down considerably on the debt necessary to finance the transaction. The result is what NSA calls PROs (Participating Regional Operators), which constitute 44% of the company’s holdings.
Quarterly results for Q3 2022 showed a 26.3% increase in Core FFO compared to Q3 2021, and same-store NOI up 12.1%, all while acquiring 23 more wholly-owned properties.
Here is what NSA’s growth statistics look like:
| Metric | 2019 | 2020 | 2021 | 2022* | 3-year CAGR |
| FFO (millions) | $139 | $167 | $255 | $352 | — |
| FFO Growth % | — | 20.1 | 52.7 | 38.0 |
36.6% |
| FFO per share | $1.54 | $1.71 | $2.26 | $2.83 | — |
| FFO per share Growth % | — | 11.0 | 32.2 | 25.2 | 22.7% |
| TCFO (millions) | $197 | $221 | $331 | $467 | — |
| TCFO Growth % | — | 12.2 | 49.8 | 41.1 | 33.6% |
Source: TD Ameritrade, Hoya Capital Income Builder, and author calculations
* Projected, based on results through Q3 2022.
NSA’s growth in revenues and cash flow have been downright stunning: not just double digits across the board, but over 20% in every category.
The company’s liquidity ratio of just 1.39 looks mediocre at first blush, but much of it is an artifact of their highly differentiated business model. The debt ratio of 29% and Debt/EBITDA of 6.7 are high for this sector, but well in line with the overall REIT average.
| Company | Liquidity Ratio | Debt Ratio | Debt/EBITDA | Bond Rating |
| NSA | 1.39 | 29% | 6.7 | — |
Source: Hoya Capital Income Builder, TD Ameritrade, and author calculation
NSA really shines when it comes to dividends. Few equity REITs can match the 5.88% Yield and 20% dividend growth rate, and shares bought today will yield over 10% three years from now, if this growth rate continues. With a payout ratio of 80%, NSA clearly leans toward paying cash to its investors.
| Company | Div. Yield | 3-yr Div. Growth | Div. Score | Payout | Div. Safety |
| NSA | 5.88% | 20.1% | 10.19 | 80% | D+ |
Source: Hoya Capital Income Builder, TD Ameritrade, Seeking Alpha Premium
Yet despite its spectacular growth and abundant Yield, NSA is truly bargain priced at just 13.2x FFO ’22 and a jaw-dropping (-37.6)% discount to NAV.
| Company | Div. Score | Price/FFO ’22 | Premium to NAV |
| NSA | 10.19 | 13.2 | (-37.6)% |
Source: Hoya Capital Income Builder and Seeking Alpha Premium
Investor’s bottom line
I don’t consider a weak company a “bargain,” just because it sells for a low price and pays a big Yield. In fact, that often signals a company that is struggling, or even dying.
But if a healthy company, that is growing briskly, maintaining a strong balance sheet, and executing sharply on a proven business model, starts to show those same characteristics, then it can be truly called a bargain.
Looked at in this way, these three bona fide FROGs are clearly bargains, offering rapid growth, strong balance sheets, elevated and safe Yields, and attractive prices. When inflation cools and the REIT sector resumes its upward march, investors in these three companies could benefit strongly.
Be the first to comment