

phuttaphat tipsana/iStock via Getty Images
This article highlights three Dividend Achievers with upside potential and forward yields above 5%.
Informally, the Dividend Achievers are companies that have increased their dividends for ten or more consecutive years. For this article, I considered 373 constituents as contained in the NASDAQ US Broad Dividend Achievers™ Index (DAA). To see how the index is calculated and maintained, please refer to the DAA Methodology document.
Of the 373 Dividend Achievers, only 23 have forward yields of at least 5%. I used Portfolio Insight’s screening feature to isolate stocks with 1-year upsides of at least 10% and identified three candidates matching my criteria.
Below, I list the three candidates in rank order based on the quality scores of DVK Quality Snapshots, along with key metrics and quality indicators:
Created by the author from a personal spreadsheet 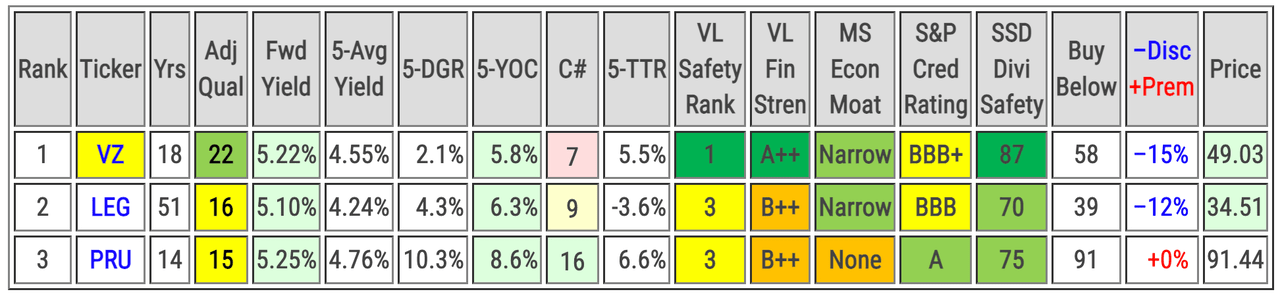
| Rank | Company (Ticker) | Sector | Supersector |
| 1 | Verizon Communications (VZ) | Communication Services | Sensitive |
| 2 | Leggett & Platt (LEG) | Consumer Discretionary | Cyclical |
| 3 | Prudential Financial (PRU) | Financials | Cyclical |
The first table presents the following metrics and indicators:
-
Yrs: years of consecutive dividend increases
-
Adj Qual: DVK Quality Snapshots adjusted quality score
-
Fwd Yield: forward dividend yield for a recent share Price
-
5-Avg Yield: 5-year average dividend yield
-
5-DGR: 5-year compound annual growth rate of the dividend
-
5-YOC: the projected yield on cost after five years of investment
-
C#: Chowder Number, a popular metric for screening dividend growth stocks
-
5-TTR: 5-year compound trailing total returns
-
VL Safety Rank: Value Line’s Safety Rank
-
VL Fin Stren: Value Line’s Financial Strength ratings
-
MS Econ Moat: Morningstar’s Economic Moat
-
S&P Cred Rating: S&P Global’s Credit Ratings
-
SSD Divi Safety: Simply Safe Dividends’ Dividend Safety Scores
-
Buy Below: my risk-adjusted buy below price
-
–Disc +Prem: discount or premium of the recent share Price to my Buy Below price
-
Price: recent share price
|
Color-coding
|
My risk-adjusted Buy Below prices allow premium valuations for the highest-quality stocks but require discounted valuations for lower-quality stocks:
Created by the author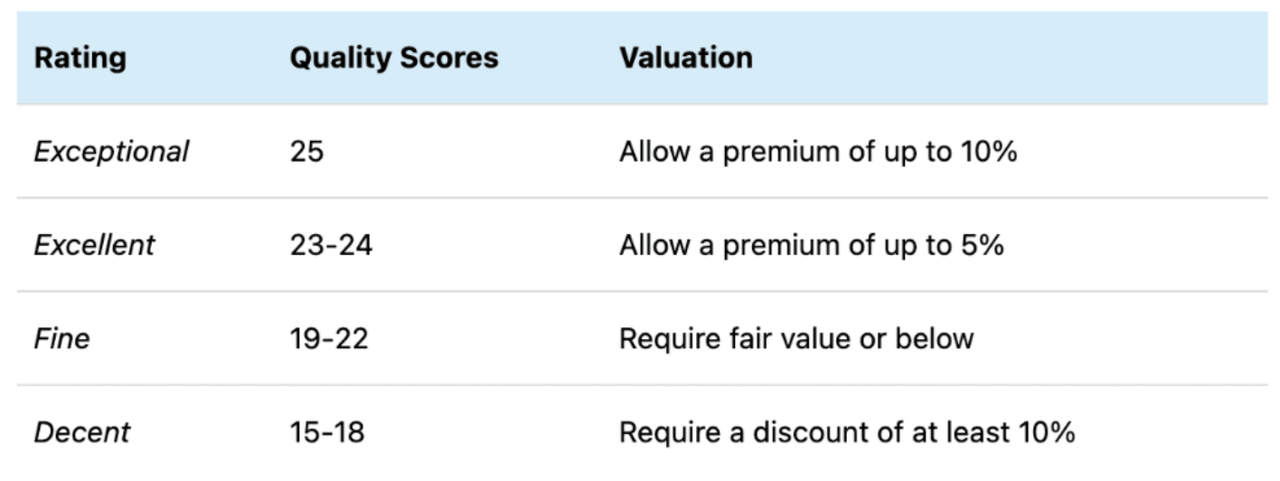
My Buy Below prices recognize that the highest-quality stocks rarely trade at discounted valuations. As a dividend growth investor with a long-term investment horizon, I’m more interested in owning quality stocks than getting a bargain on lower-quality stocks.
I use a survey approach to estimate fair value [FV] by collecting fair value estimates and price targets from several online sources, including Portfolio Insight, Morningstar, and Finbox. Additionally, I estimate FV by dividing each stock’s annualized dividend by its historical 5-year average dividend yield. With as many as 11 available estimates per stock, I ignore the outliers (the lowest and highest values) and use the average of the median and mean of the remaining values as my fair value estimate. Averaging the mean (average) and median (middle value) helps to adjust for skewness in the surveyed estimates.
Let’s now consider each candidate in turn.
Verizon Communications (VZ)
VZ provides communications, information, and entertainment products and services to consumers, businesses, and governmental agencies worldwide. Formerly known as Bell Atlantic Corporation, the company changed its name to Verizon Communications Inc in June 2000. VZ was founded in 1983 and is based in New York, New York.
With a dividend increase streak of 18 years, VZ is a member of the Dividend Contenders.
The stock yields 5.22% at $49.03 per share, a yield which is 16% higher than its trailing 5-year average yield of 4.5% (as of 17 June):
Portfolio-Insight.com 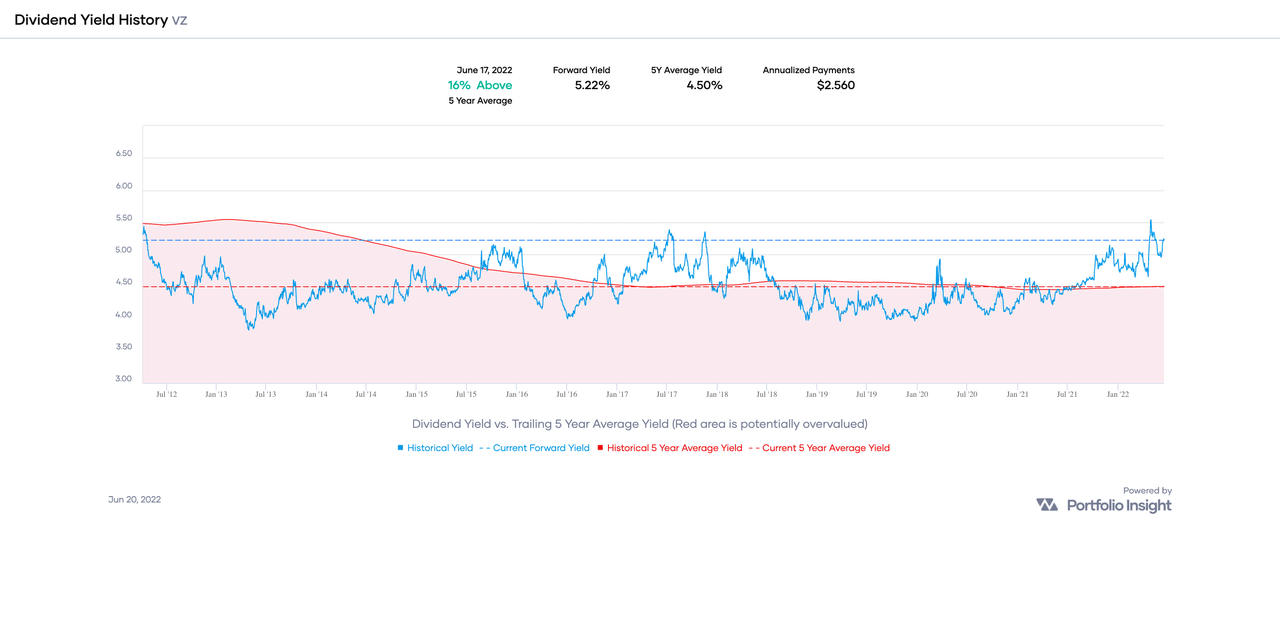
Over the past ten years, VZ has underperformed the SPDR S&P 500 ETF (SPY), an ETF designed to track the companies in the S&P 500:
Portfolio-Insight.com 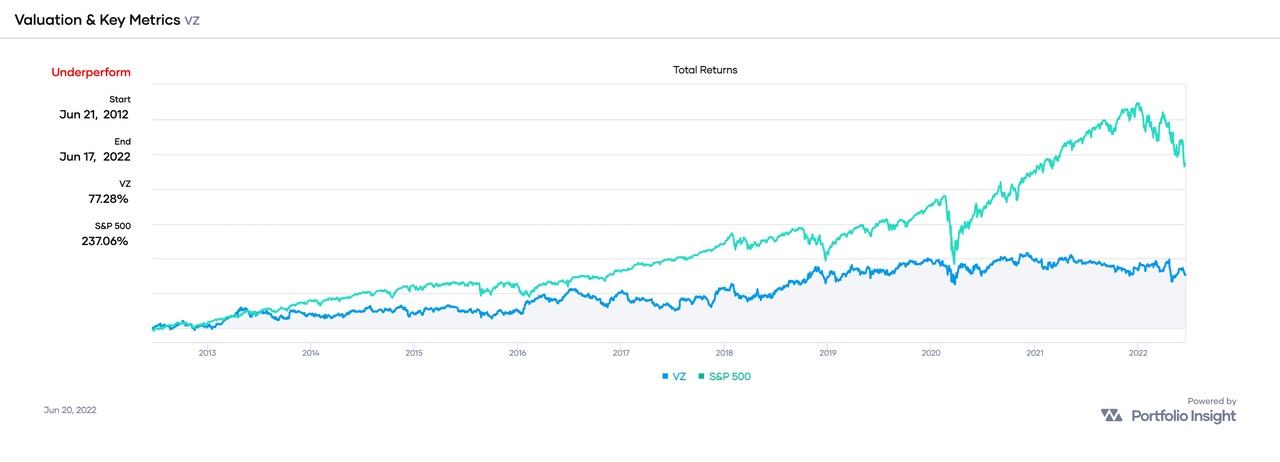
VZ returned 77% versus the SPY’s 237%, a margin of only 0.32-to-1.
If we extend the time frame of comparison to the past 20 years, VZ also underperformed SPY, with total returns of 214% versus SPY’s 450%, a somewhat better margin of 0.48-to-1.
The question is, what does a dividend growth investor get if they invest in VZ?
Here is a chart showing VZ’s dividend growth history through the end of 2021:
Portfolio-Insight.com 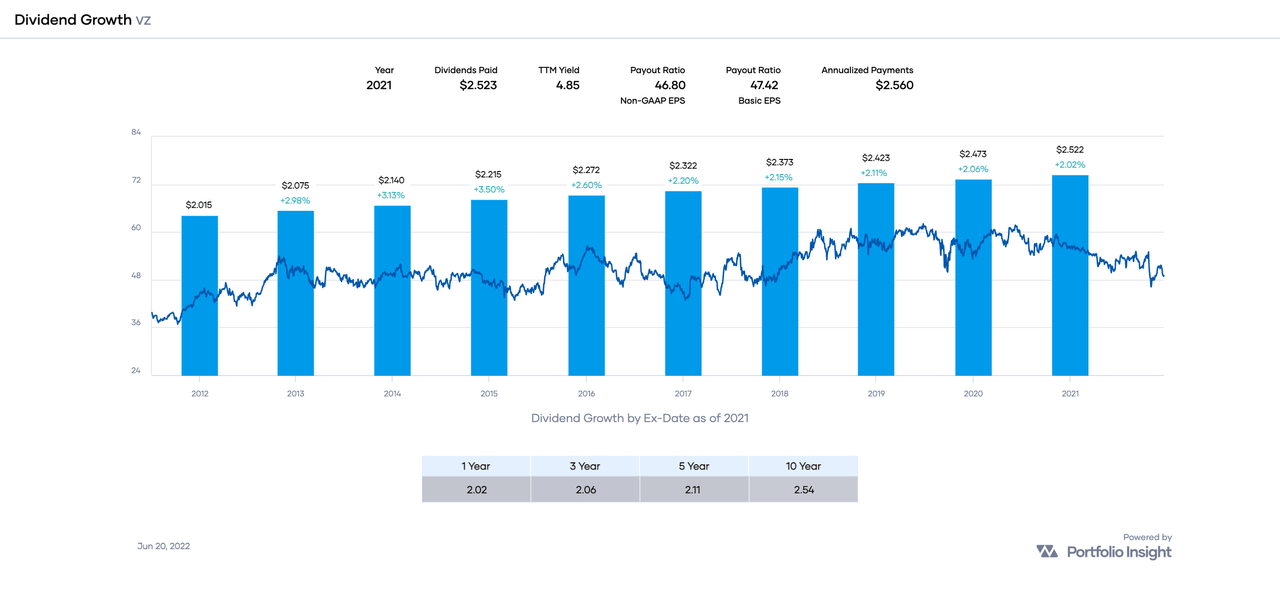
VZ is growing its dividend at a steady but decelerating rate. We can see this by dividing the 5-year dividend growth rate [DGR] by the 10-year counterpart: 2.11 ÷ 2.54 = 0.83. A ratio below 1.00 indicates deceleration.
VZ’s earnings are generally growing, with very modest increases of 0.29% and 3.13% expected for FY 2022 and 2023, respectively.:
Portfolio-Insight.com 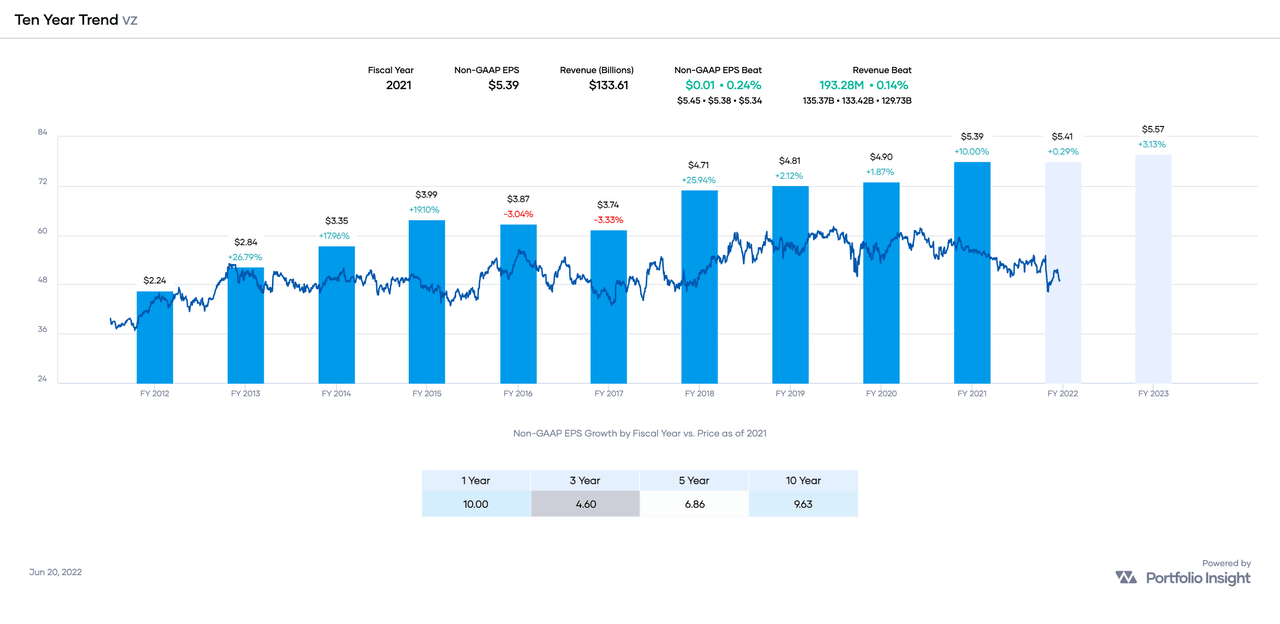
I’d like to see steady earnings increases at rates equal to or exceeding the stock’s DGR, as is the case with VZ. This gives me confidence that the company will continue to pay and periodically increase its dividend. It is likely that VZ will continue its modest dividend increases of about 2% per year.
VZ’s earnings payout ratio of 47% is “very low for telecoms,” according to Simply Safe Dividends:
Simply Safe Dividends 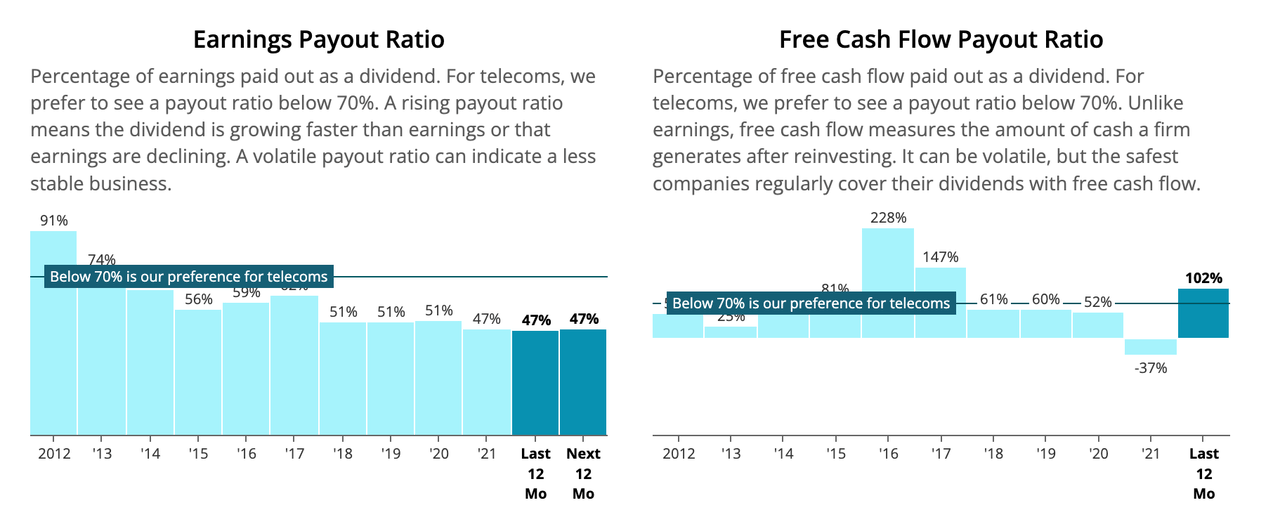
This means VZ has plenty of room to continue paying and increasing its dividend.
Portfolio Insight’s FV is $62.49, with a 12-month target price of $63.40 (29% upside):
Portfolio-Insight.com 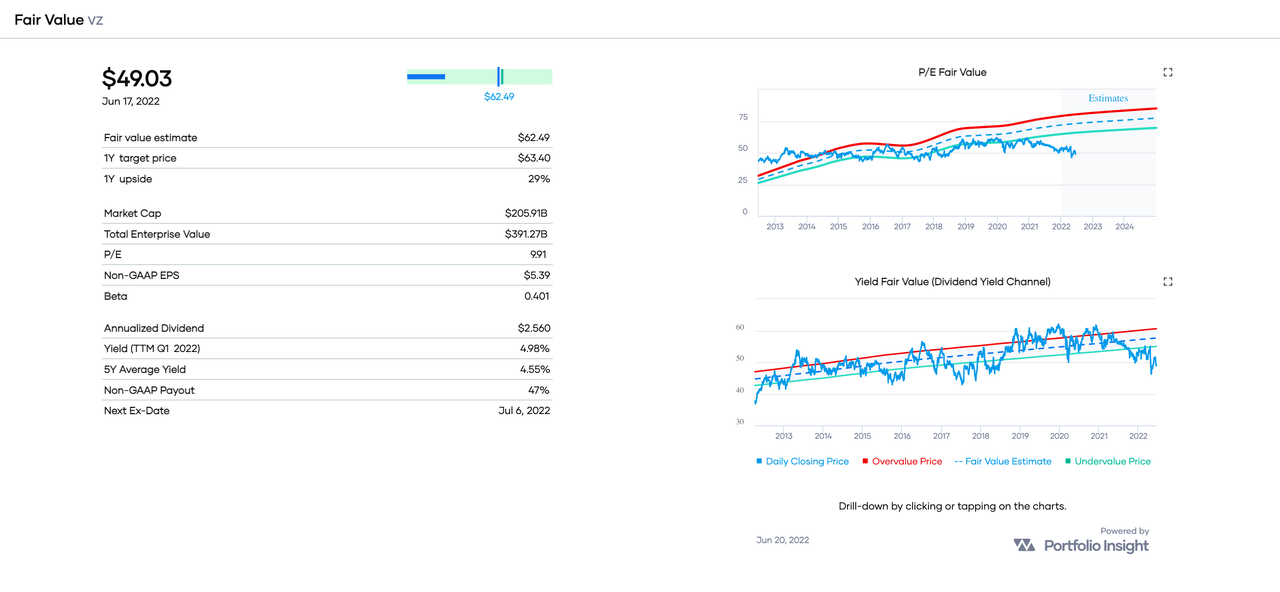
The P/E and Dividend Yield Fair Value charts indicate that VZ is trading well below the Undervalue Price.
My FV estimate of VZ is $58, so I think the stock is trading at a discount of about 15%. For stocks with quality scores in the range of 19-22, my Buy Below price equals my FV estimate. Therefore, my Buy Below price of VZ is $58.
For reference, CFRA’s FV is $45, Morningstar’s FV is $59, and Finbox.com’s FV is $63.
Leggett & Platt (LEG)
Founded in 1883 and based in Carthage, Missouri, LEG designs and manufactures a range of engineered components and products found in homes, offices, and automobiles. LEG operates through four segments, Residential Furnishings, Commercial Products, Industrial Materials, and Specialized Products. It serves manufacturers of finished bedding, upholstered furniture, mechanical springs, automobile seating, and more.
With a dividend increase streak of 51 years, LEG is a member of the Dividend Kings, the Dividend Aristocrats, and the Dividend Champions.
The stock yields 5.10% at $34.51 per share, a yield which is 36% higher than its trailing 5-year average yield of 3.74% (as of 17 June):
Portfolio-Insight.com 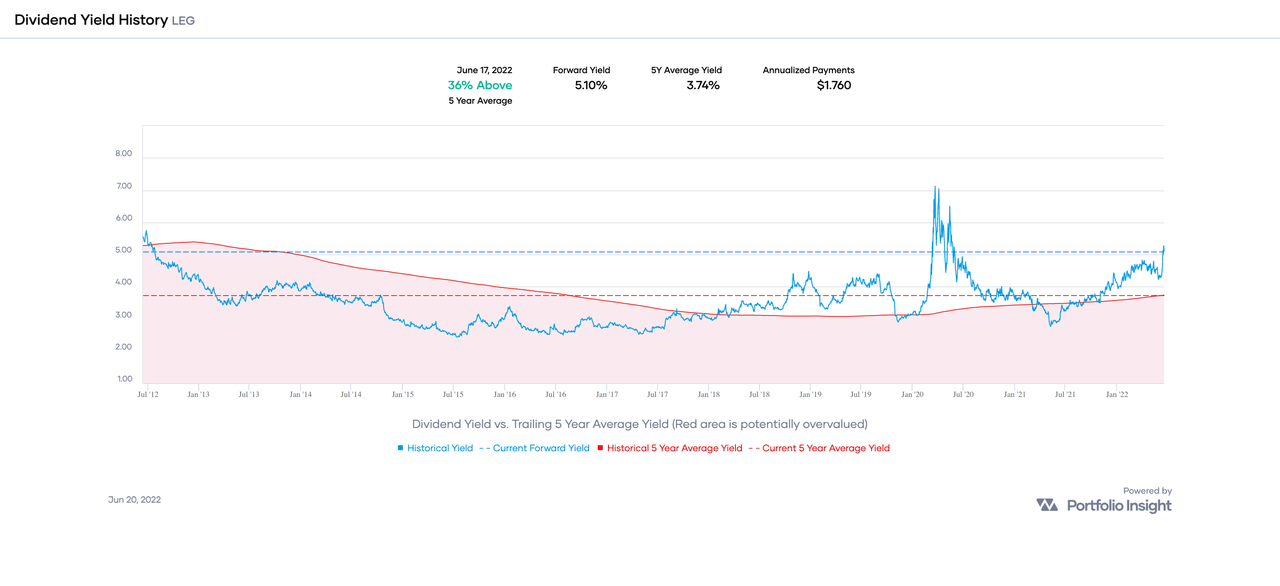
Over the past ten years, LEG has underperformed the SPDR S&P 500 ETF, an ETF designed to track the companies in the S&P 500:
Portfolio-Insight.com 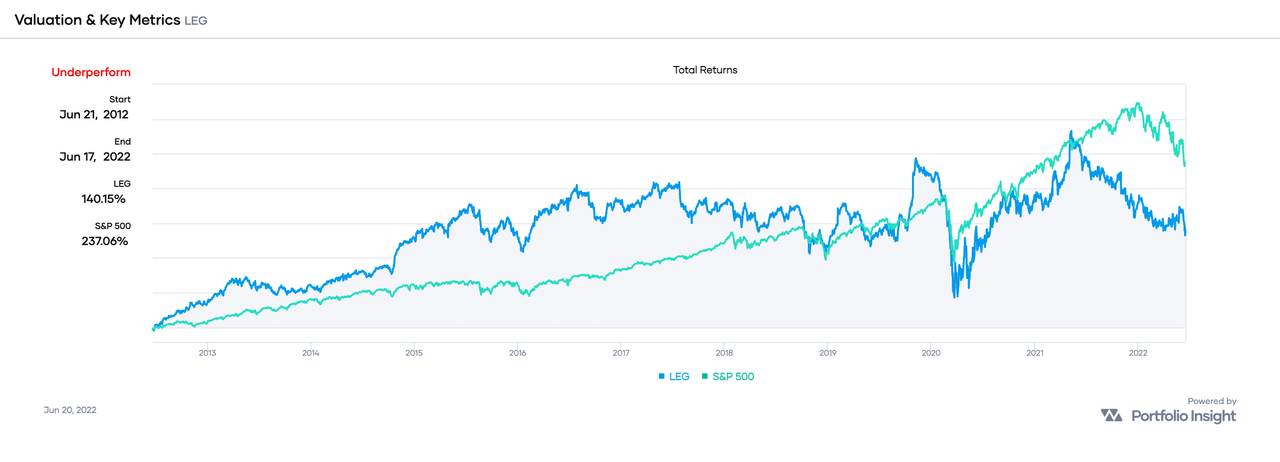
LEG returned 140% versus the SPY’s 237%, a margin of only 0.59-to-1.
If we extend the time frame of comparison to the past 20 years, LEG also underperformed SPY, with total returns of 194% versus SPY’s 450%, a margin of only 0.43-to-1.
Here is a chart showing LEG’s dividend growth history through the end of 2021:
Portfolio-Insight.com 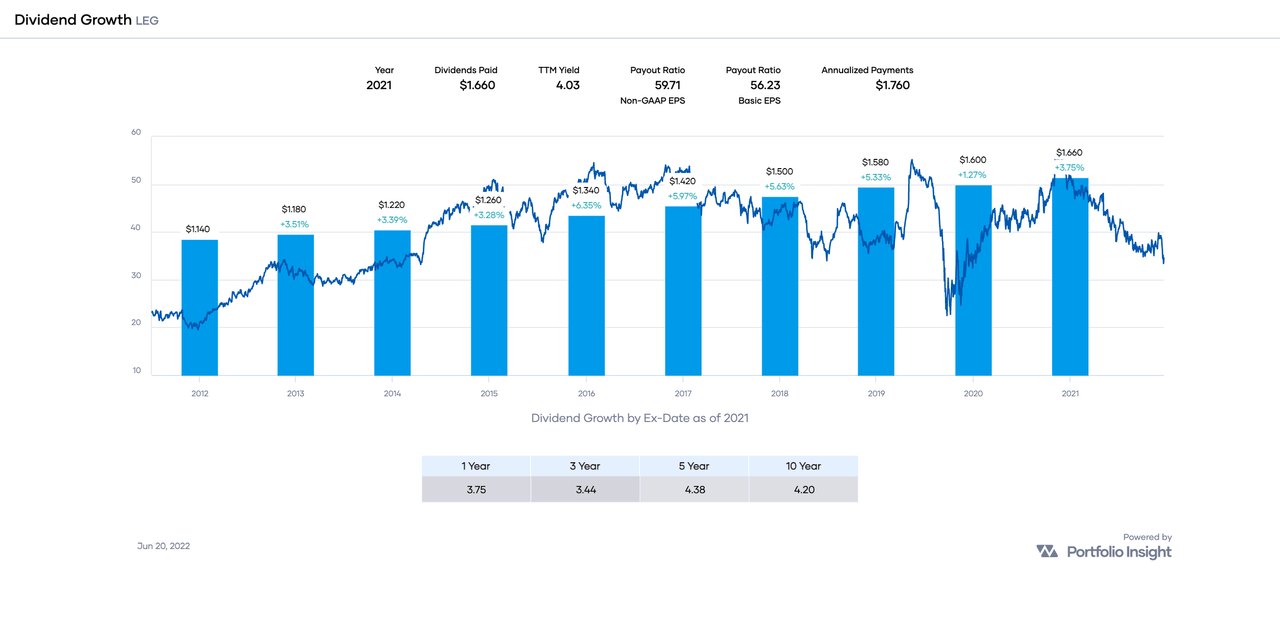
LEG is growing its dividend at a steady and accelerating rate. We can see this by dividing the 5-year DGR by the 10-year counterpart: 4.38 ÷ 4.20 = 1.04. A ratio above 1.00 indicates acceleration.
LEG’s earnings are generally growing, with very modest increases of 0.27% and 3.05% expected for FY 2022 and 2023, respectively:
Portfolio-Insight.com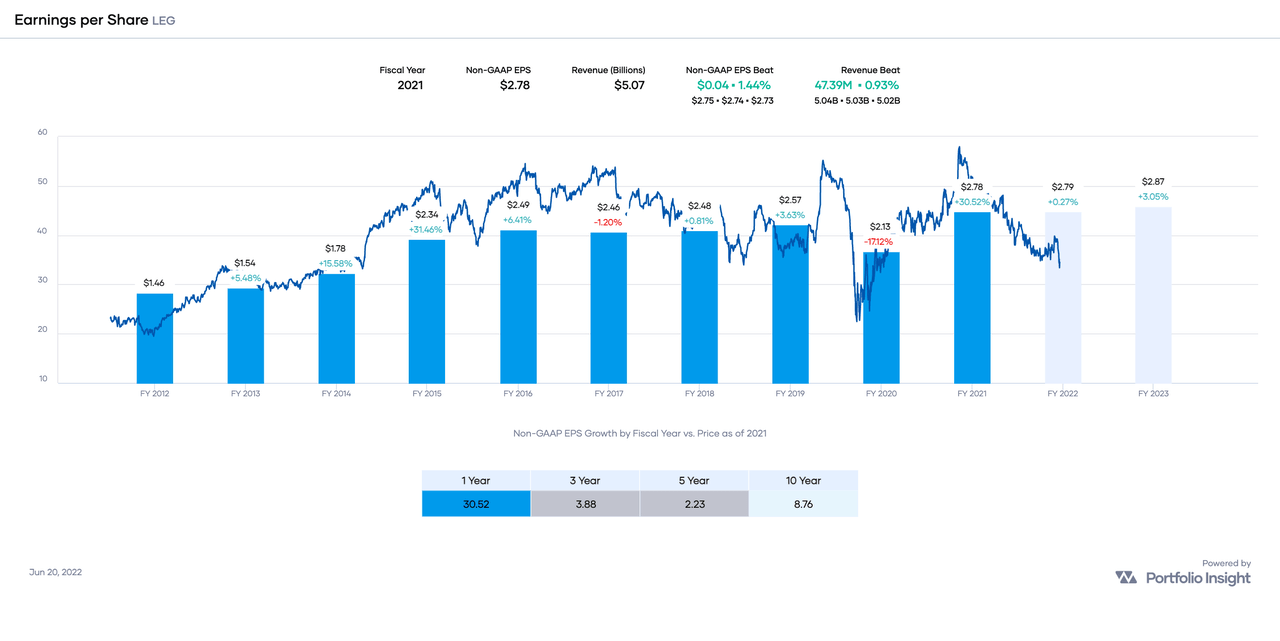
I’d like to see steady earnings increases over time, and LEG certainly is delivering, but the growth is fairly modest.
LEG’s earnings payout ratio of 60% is “low for most companies,” according to Simply Safe Dividends:
Simply Safe Dividends 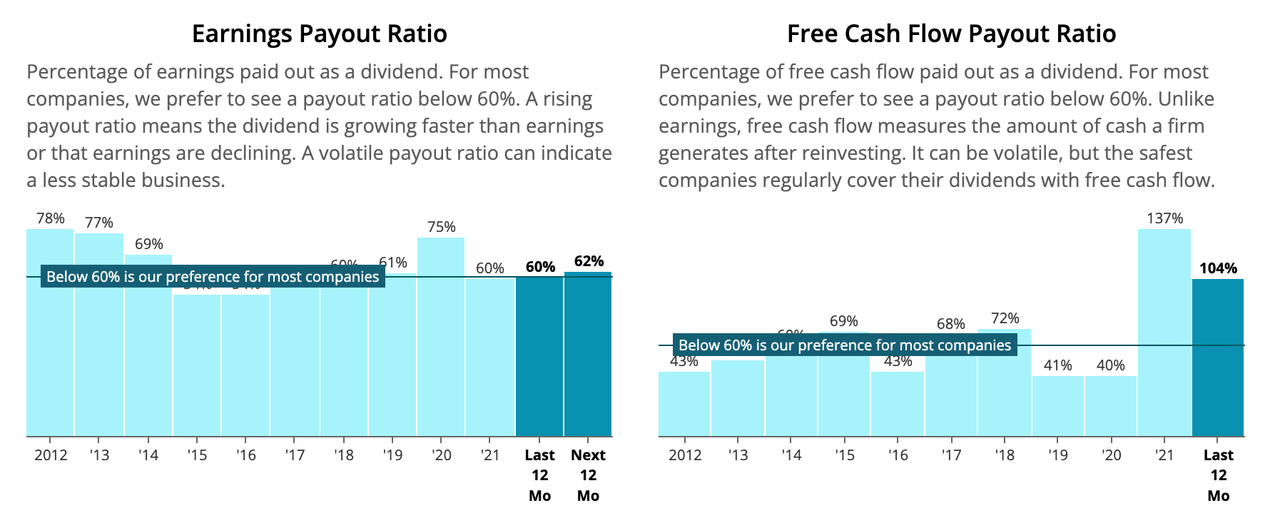
This means LEG has plenty of room to continue paying and increasing its dividend.
Portfolio Insight’s FV is $48.39, with a 12-month target price of $47.23 (37% upside):
Portfolio-Insight.com 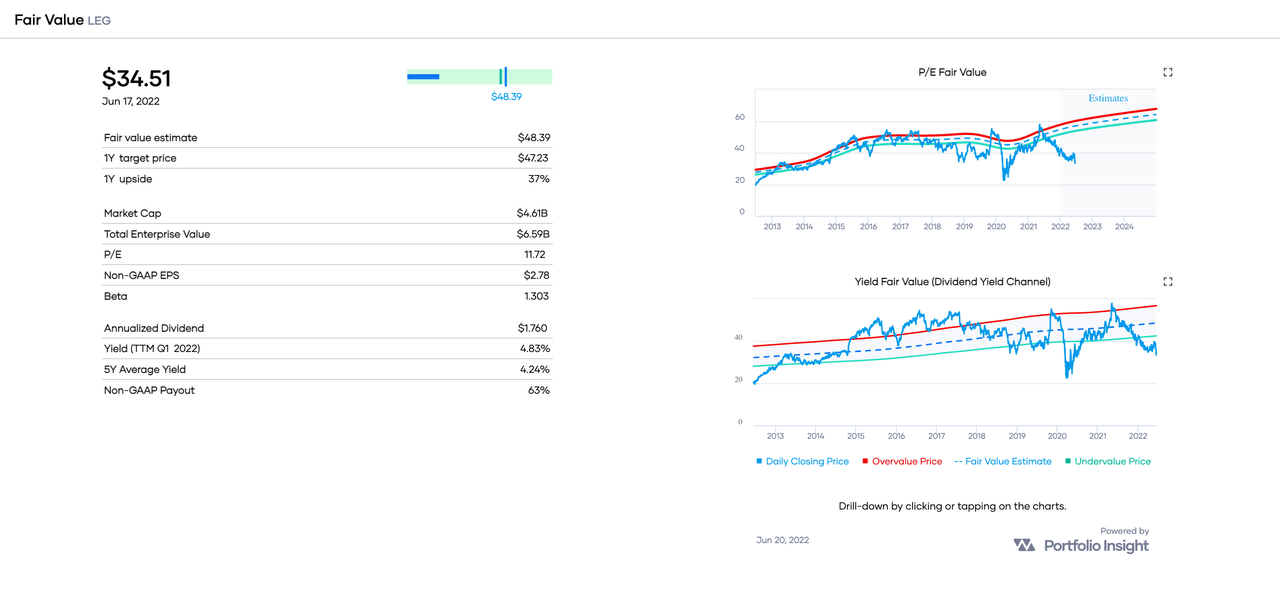
The P/E and Dividend Yield Fair Value charts indicate that LEG is trading well below the Undervalue Price.
My FV estimate of LEG is $43, so I think the stock is trading at a discount of about 21%. For stocks with quality scores in the range of 15-18, I require a discount of 10% to my FV estimate. Therefore, my Buy Below price of LEG is $39.
For reference, Morningstar’s FV is $45, Finbox.com’s FV is $49, and Simply Wall St’s FV is $65.
Prudential Financial (PRU)
PRU is a financial services company, which, through its subsidiaries and affiliates, provides a range of financial products and services, including life insurance, annuities, retirement-related services, mutual funds and investment management. The company has more than $1 trillion of assets under management. PRU was founded in 1875 and is headquartered in Newark, New Jersey.
With a dividend increase streak of 14 years, PRU is a member of the Dividend Contenders.
The stock yields 5.25% at $91.44 per share, a yield which is 17% higher than its trailing 5-year average yield of 4.48% (as of 17 June):
Portfolio-Insight.com 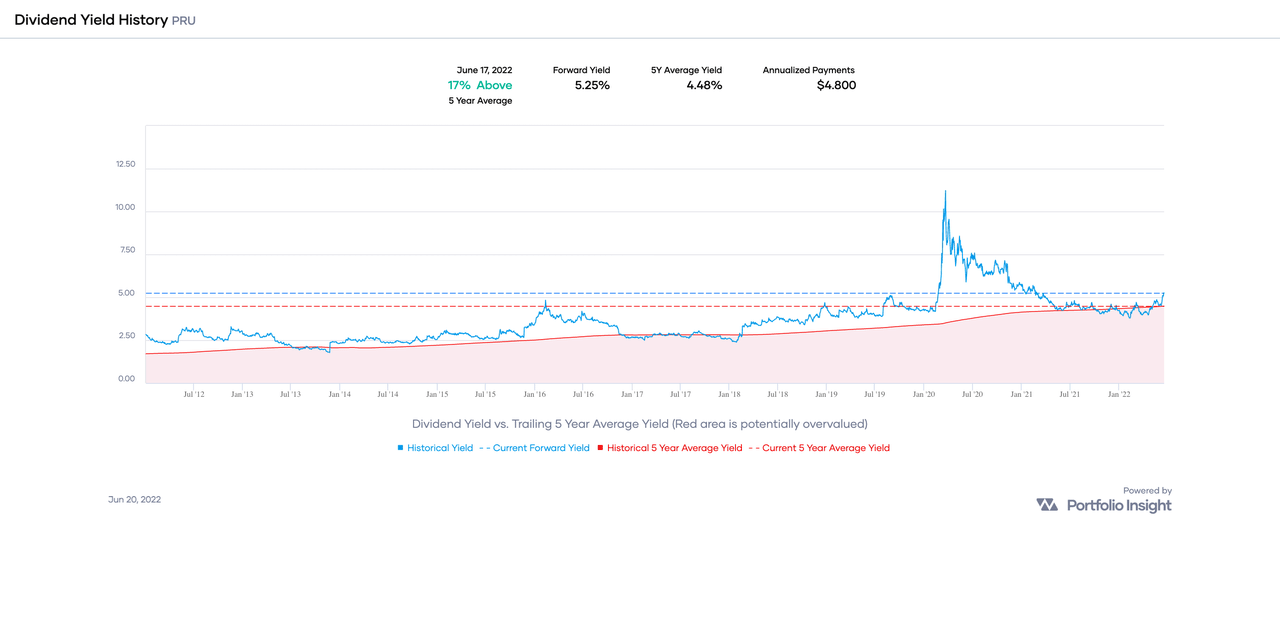
Over the past ten years, PRU has underperformed the SPDR S&P 500 ETF, an ETF designed to track the companies in the S&P 500:
Portfolio-Insight.com 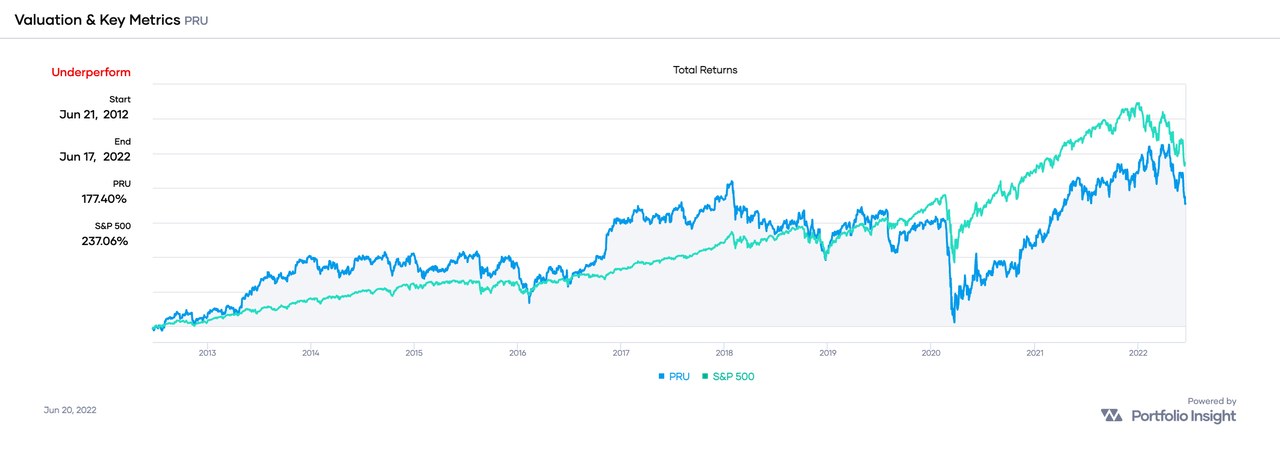
PRU returned 177% versus the SPY’s 237%, a margin of 0.75-to-1.
If we extend the time frame of comparison to the past 20 years, PRU also underperformed SPY, with total returns of 375% versus SPY’s 450%, a somewhat better margin of 0.83-to-1.
Here is a chart showing PRU’s dividend growth history through the end of 2021:
Portfolio-Insight.com 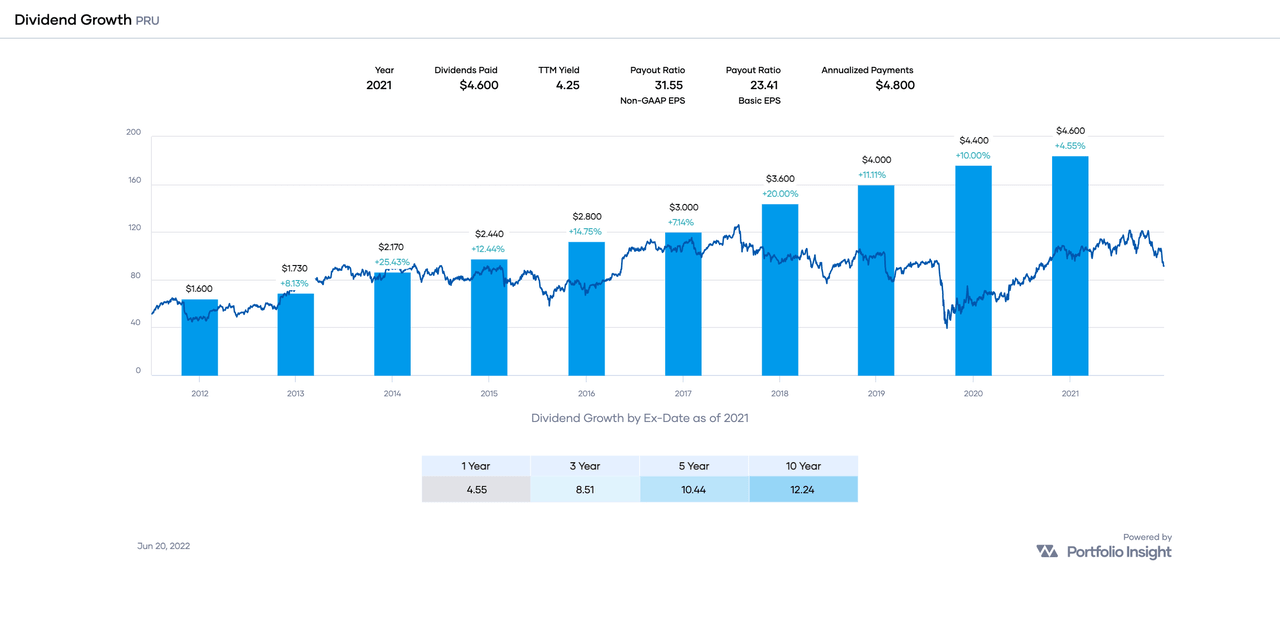
PRU is growing its dividend at an impressive but decelerating rate. We can see this by dividing the 5-year DGR by the 10-year counterpart: 10.44 ÷ 12.24 = 0.83. A ratio below 1.00 indicates deceleration.
PRU’s earnings are generally growing, but not so consistently. Earnings estimates for FY 2022 call for a decline of 20.84% after FY 2021’s spectacular increase of 42.8%.
Portfolio-Insight.com 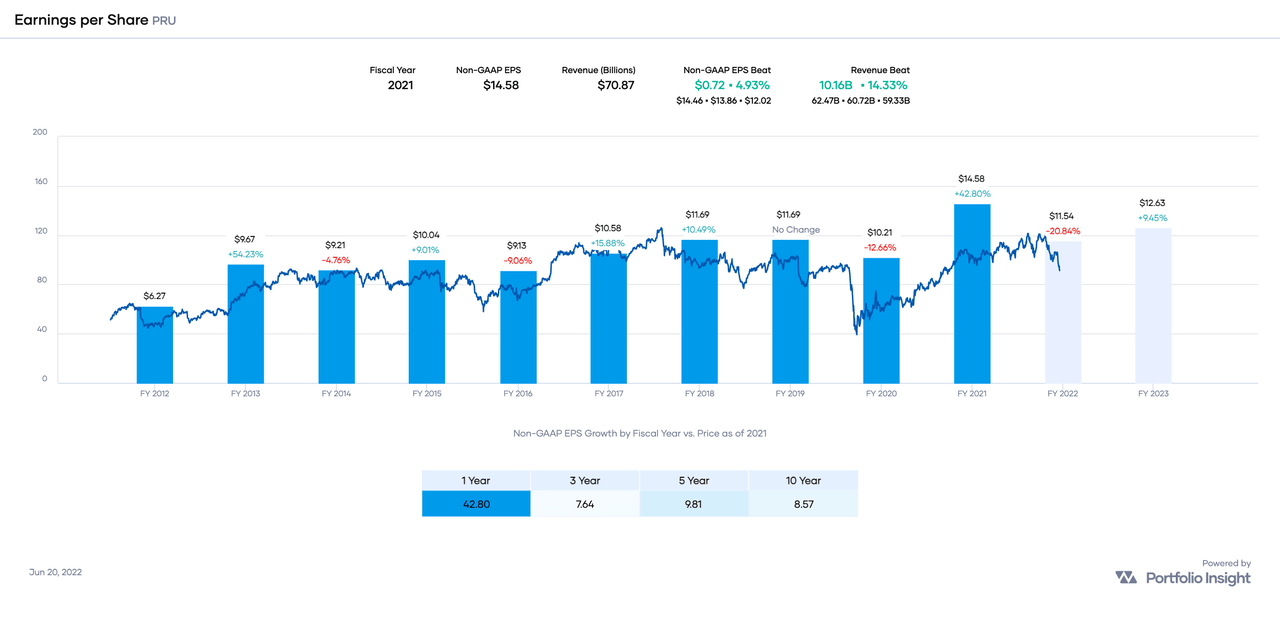
PRU’s earnings payout ratio of 33% is “low for insurers,” according to Simply Safe Dividends:
Simply Safe Dividends 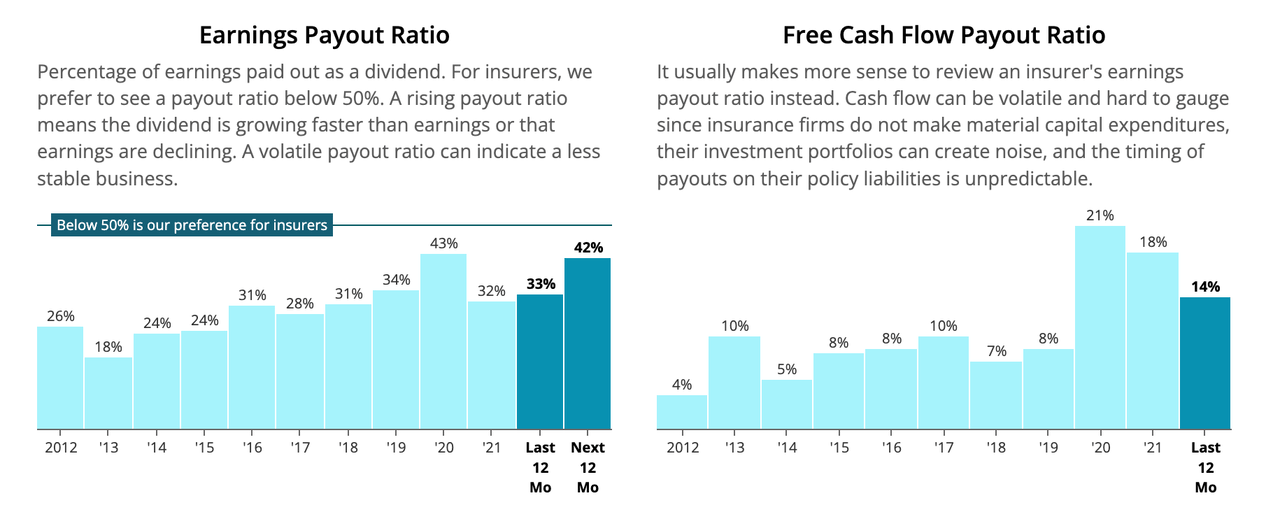
This means PRU has plenty of room to continue paying and increasing its dividend. It is possible that PRU will continue its pattern of generous dividend increases, likely high single digit percentage increases.
Portfolio Insight’s FV is $108.29, with a 12-month target price of $103.12 (13% upside):
Portfolio-Insight.com 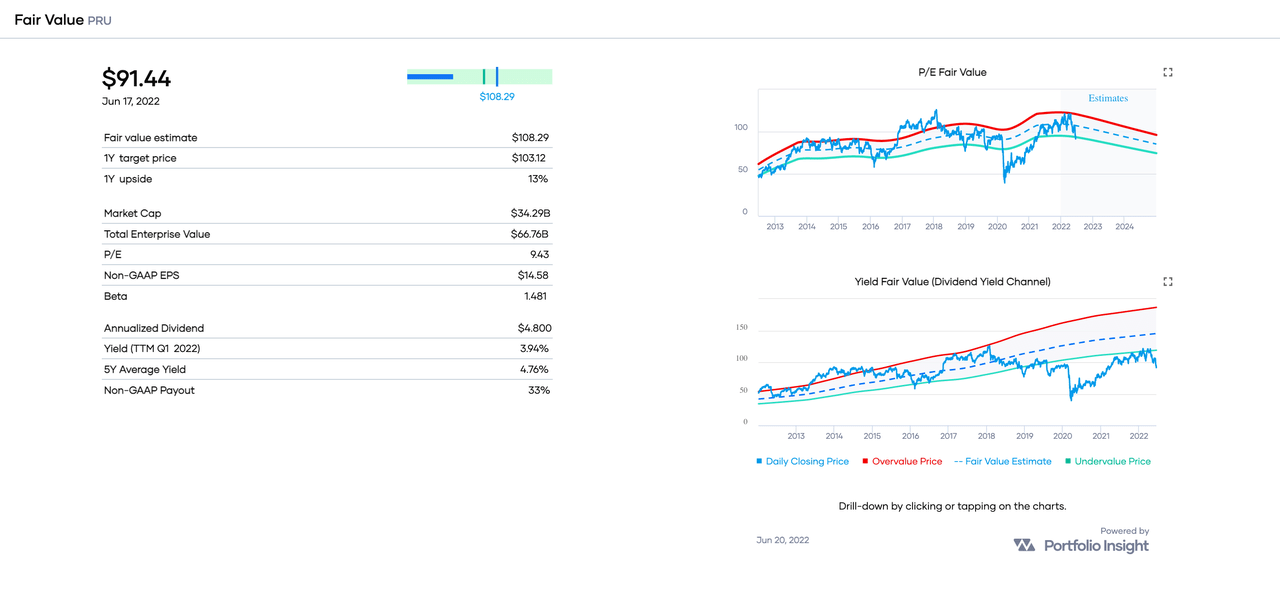
The P/E and Dividend Yield Fair Value charts indicate that PRU is trading below the Undervalue Price.
My FV estimate of PRU is $46, so I think the stock is trading at a discount of about 10%. For stocks with quality scores in the range of 15-19, I require a 10% discount to my FV estimate. Therefore, my Buy Below price of PRU is $91.
For reference, CFRA’s FV is $45, Morningstar’s FV is $97, and Finbox.com’s FV is $105, and Simply Wall St’s FV is $199. That’s quite a range of opinions!
Concluding Remarks
This article presented three Dividend Achievers with a forward yield above 5% and upside potential:
- VZ: 18 years • Forward Yield: 5.22% • 1-Year Upside: 29%
- LEG: 51 years • Forward Yield: 5.10% • 1-Year Upside: 37%
- PRU: 14 years • Forward Yield: 5.25% • 1-Year Upside: 13%
I own VZ in my DivGro Portfolio, but not LEG and PRU.
I always encourage readers to do their due diligence before buying any stocks I highlight.
Thanks for reading, and take care, everybody!
Be the first to comment