


Class in session.
Monica Click
Granite Point Mortgage Trust
GPMT is another reasonable choice. However, I see GPMT as a riskier choice. Rather than agency MBS, GPMT’s loans are taking on credit risk. That has backfired a few times in the last few quarters with GPMT taking losses on some of their loans.
They have access to the collateral, but in some cases the borrower simply didn’t have enough equity involved for project they were building. I don’t consider GPMT to be a master of risk management, but they should probably trade at a smaller discount than they do today.
Even if GPMT takes quite a few losses on their loans, trading at 39% of book value is a pretty significant cushion. There’s still dividend risk, despite GPMT’s dividend yield on Net Asset Value being quite low. This is a value play. When shares trade at a large discount, it creates the potential for a substantial gain.
The current dividend yield (if maintained, which is clearly uncertain) comes in at 17.3%. For contrast, the dividend yield on book value (rather than share price) is only 6.7%. While paying out 17.3% on book value would clearly be way too high, the payout on book value isn’t remotely high. If GPMT does decide to reduce the dividend, the 17.3% yield could be reduced quite a bit while still being a respectable yield.
We’re not going in for a huge position, but we do have a small position in GPMT for the potential gain. If GPMT doubled with no change in book value, the discount would still be greater than 20%. If book value dips significantly, the $5.78 share price would still be a huge discount.
Rithm Capital Corp
RITM offers investors a solid discount to book value. Shares trade at only 70% of our estimated book value. Their mortgage origination suffered from much higher rates, but the MSRs (mortgage-servicing rights) have been an excellent hedge for the portfolio.
As Treasury rates increased and the spreads between MBS and mortgage rates increased, mortgage originators needed to charge much higher rates to have mortgages that would sell for more than face value. If a mortgage can’t be sold for more than face value, the origination is losing money on producing the mortgage.
You can see the impact by looking at the pricing on a generic 30-year fixed-rate MBS (mortgage-backed securities) with a coupon rate of 5.5%:
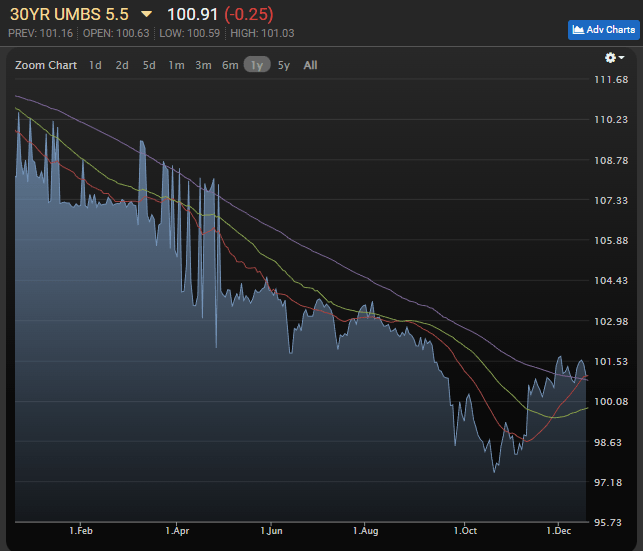
MBS Live
A rate of 5.5% would’ve caused the MBS to trade at very high prices prior to June 2022. In fact, these MBS were so rare that the liquidity was quite weak. That’s why you see those wild spikes before June 2022.
By June 2022, this was a typical rate for MBS. However, as 10-year Treasury rates climbed further the mortgage originators needed even higher rates. By October 20th this MBS would’ve sold for less than 98% of face value. However, today it’s trading at 100.91% of face value. That’s not enough to provide a respectable profit margin, but it’s showing some improvement.
Mortgage rates are still vastly higher than they were for the last decade, but a dip here still helps the originators.
Lower rates could increase the prepayment on mortgages (which is bad for MSRs), but rates are still high enough that refinancing would be extremely unattractive for most homeowners.
RITM went on a sudden sale late Friday afternoon. It didn’t last long though as the shares opened higher on Monday and quickly bounced back:
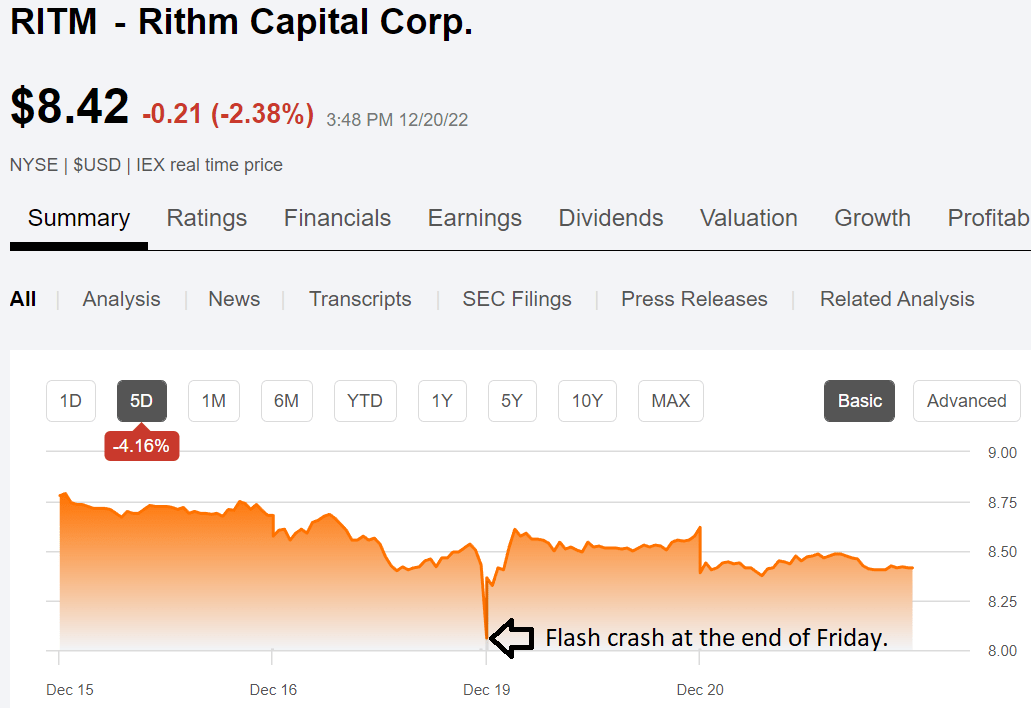
Seeking Alpha
RITM is one of our larger positions. The Friday crash was too quickly for us to get in. Didn’t see it until it was over. I was hoping to catch a few shares (about 1,000 shares) Monday morning with a lowball bid. I was bidding at $8.11, which turned out to be a bit too low for execution. Congratulations to those who got in with the Friday dip.
For a REIT that’s down so much year-to-date, it’s worth recognizing that book value started the year at $11.44. It ended Q3 2022 at $12.10 per share while paying out a $.25 dividend each quarter. That leaves shares at an 11.3% dividend yield today.
RITM already declared the Q4 2022 dividend, which also is $.25 per share. Shares should be ex-dividend 12/29/2022, based on the 12/30/2022 record date.
Shares currently trade at 71% of our estimated book value per share.
That’s an unusually large discount for RITM:

The REIT Forum
There have been times when RITM trades above or below book value, but the magnitude of the current discount is unusual.
Arlington Asset Investment Corp.
AAIC has the worst dividend yield in the sector at 0.0%. They won’t count towards our three high-yield picks for this article, though we’re taking a bullish view.
However, they’ve had a pretty good year. Strong performance on book value per share. While MBS spreads were widening out, they were investing in homes instead. That worked out remarkably well as they were able to avoid the damage from spread widening that hammered the sector.
While home prices are at risk today, AAIC closed out much of their portfolio in Q3 2022 and announced that they had signed a deal to sell the rest of their single-family rental properties in Q4 2022.
It’s part of AAIC’s strategy, which (despite the share price) has worked quite well over the last several quarters.
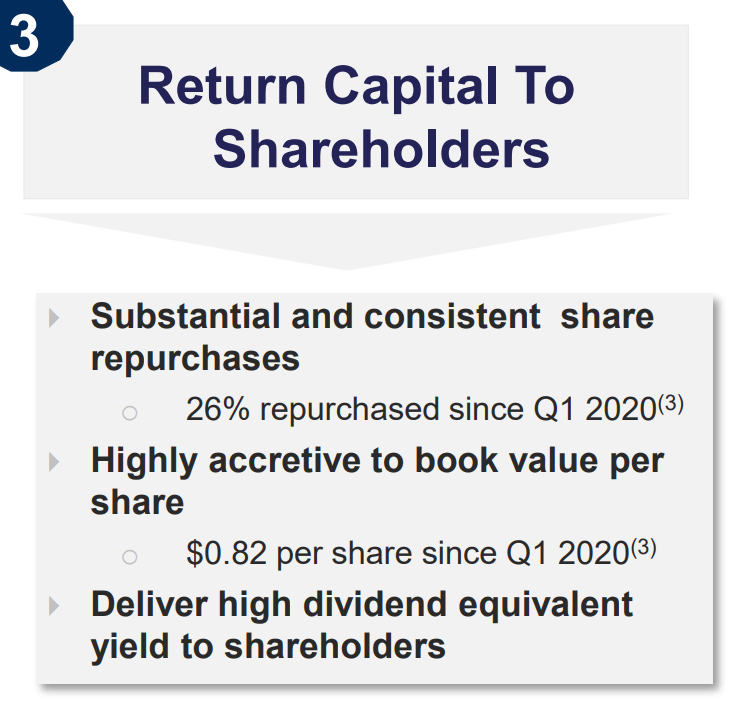
AAIC Q3 Presentation
The plan of repurchasing shares had a huge discount to book value was thoroughly accretive to book value per share and is a wise choice to use as long as shares trade at a massive discount.
We haven’t always been a fan of AAIC. I published more articles specifically bashing AAIC than any other analyst on Seeking Alpha. That was a reasonable choice because at the time shares were overvalued, the portfolio was overleveraged, and dividend cuts were on the way.
Today, that isn’t the case. The dividend is already at $0.00, so dividend cuts are no longer a risk. Further, leverage was dramatically reduced:
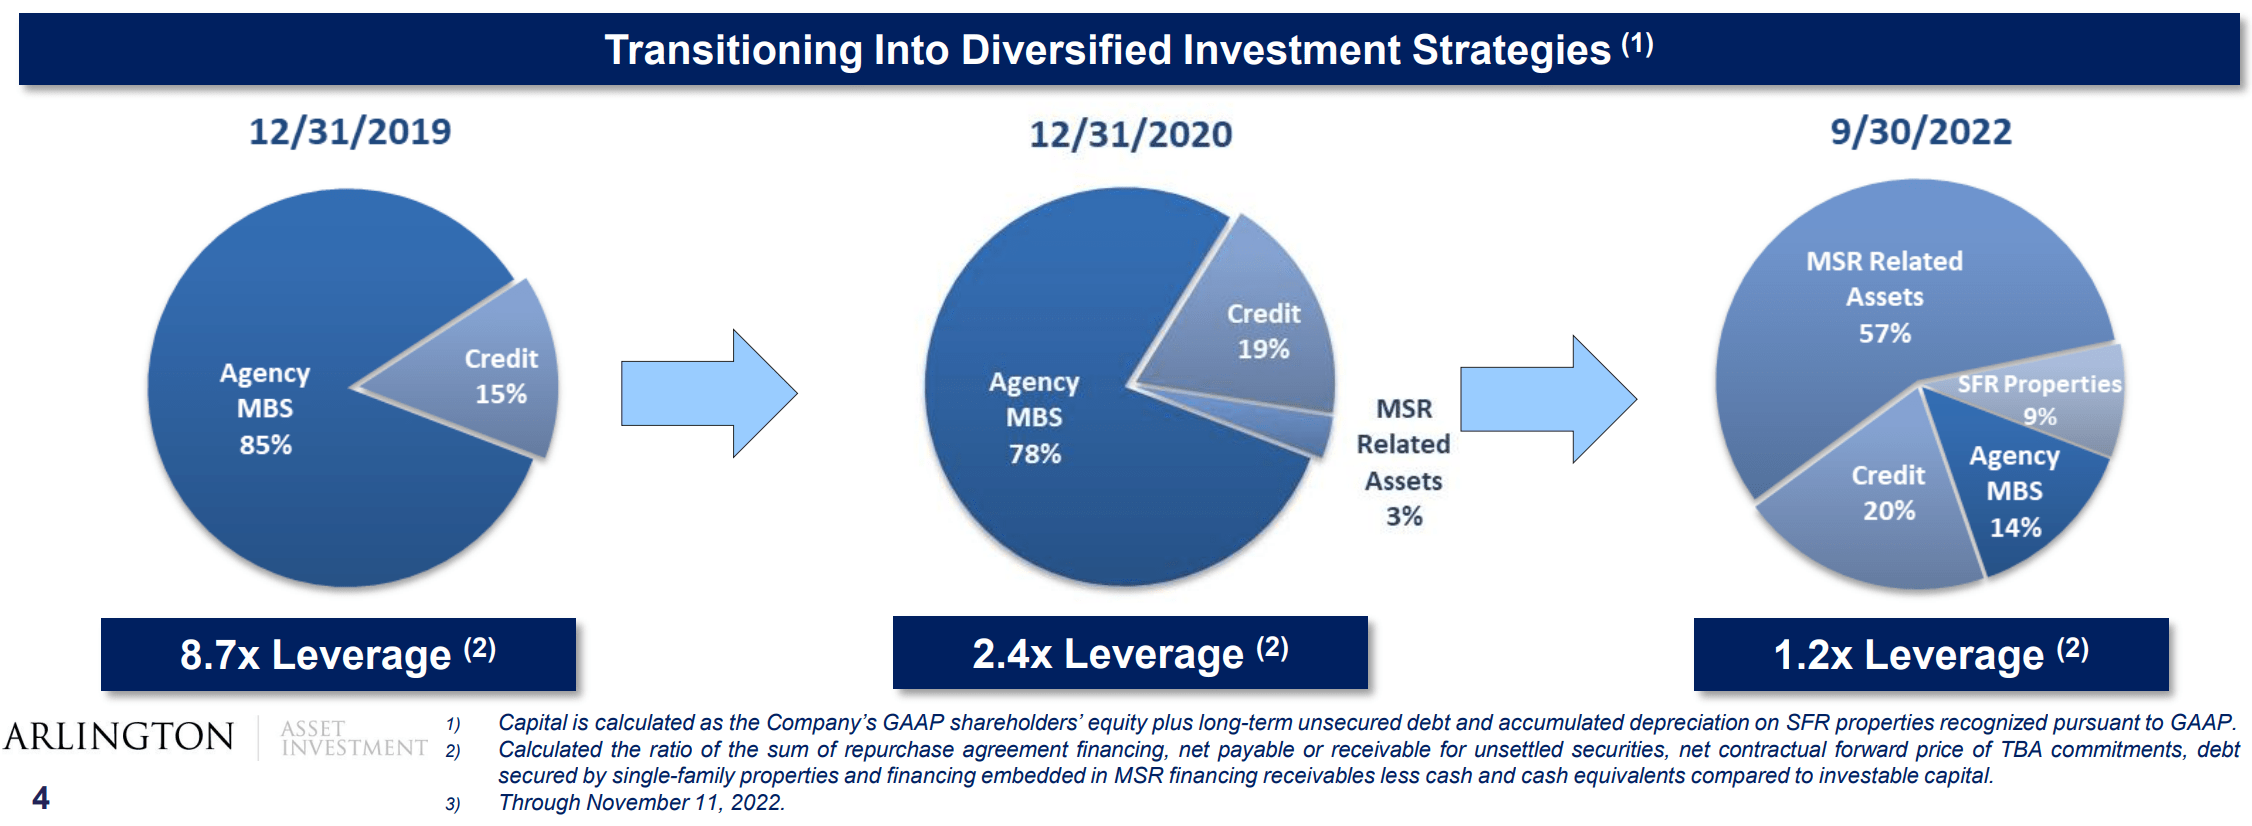
AAIC Q3 Presentation
The magnitude of the investment in MSRs seems high to me, but the dramatic reduction in leverage is great. It reduces the volatility from their operations while they can continue to drive accretion through buybacks.
AAIC is a very small mortgage REIT. Liquidity is a bit weaker and it’s a very small position in our portfolio.
One Preferred Share
RITM-D (RITM.PD) deserves a mention also. For investors who want go the preferred share route, RITM-D has a 9.82% stripped dividend yield. When shares become callable, the dividend rate will reset based on the 5-year Treasury yield plus 6.223%. If investors believe rates will still be high in late 2016, that would be a huge dividend increase. Based on the current share price and 5-year Treasury rate, the stripped yield would increase to 14.04%.
I’m not convinced rates will remain this level, but the 6.223% spread over the 5-year Treasury is good. The initial coupon rate was only 7%. It’s only a 9.82% stripped yield because the share price is so low.
Since the 6.223% spread isn’t that much higher than 7%, the 5-year Treasury rate only needs to above 0.777% for it to result in an increased dividend rate. At $18.15, I think RITM-D is a great choice and it qualifies as our third high yield pick for the article. Shares trade at less than 73% of call value. That gives investors substantial upside.
We have a pretty significant allocation to RITM-D.
Stock Table
We will close out the rest of the article with the tables and charts we provide for readers to help them track the sector for both common shares and preferred shares.
We’re including a quick table for the common shares that will be shown in our tables:
Let the images begin!
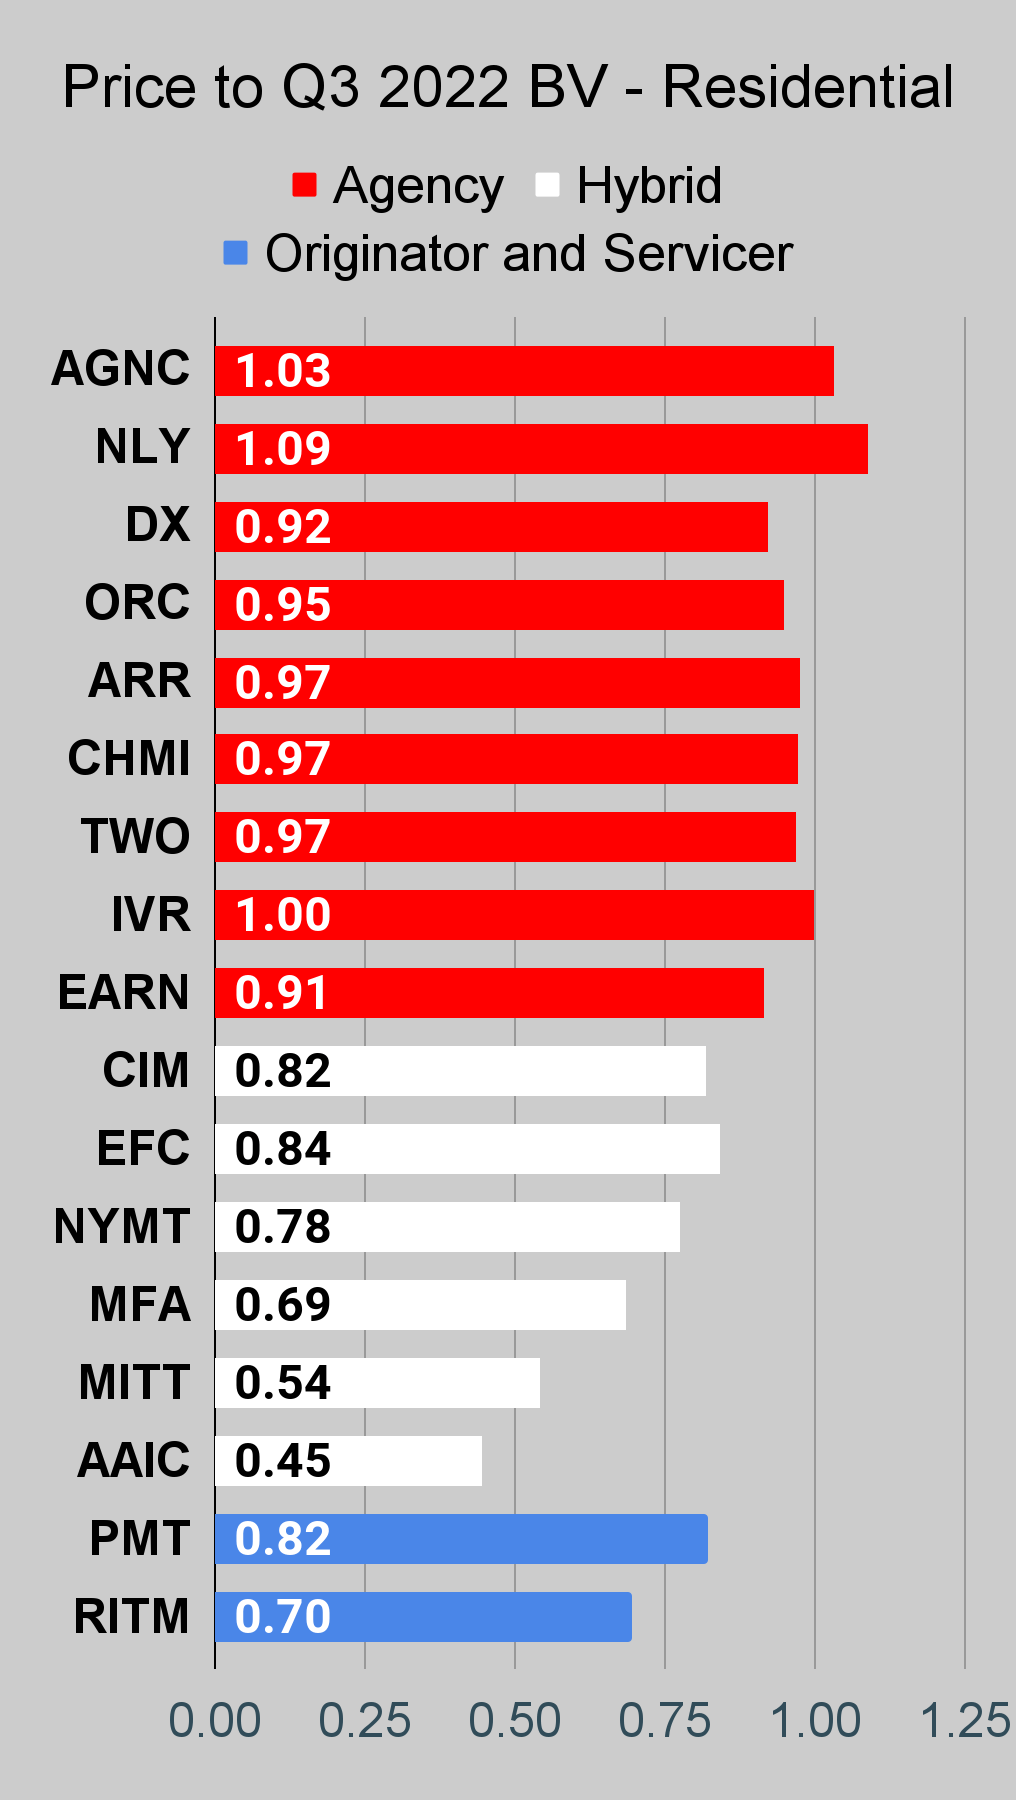
Residential Mortgage REIT Charts
Note: The chart for our public articles uses the book value per share from the latest earnings release. Current estimated book value per share is used in reaching our targets and trading decisions. It is available in our service, but those estimates are not included in the charts below. PMT and NYMT are not showing an earnings yield metric as neither REIT provides a quarterly “Core EPS” metric.
 The REIT Forum |
 The REIT Forum |
 The REIT Forum |
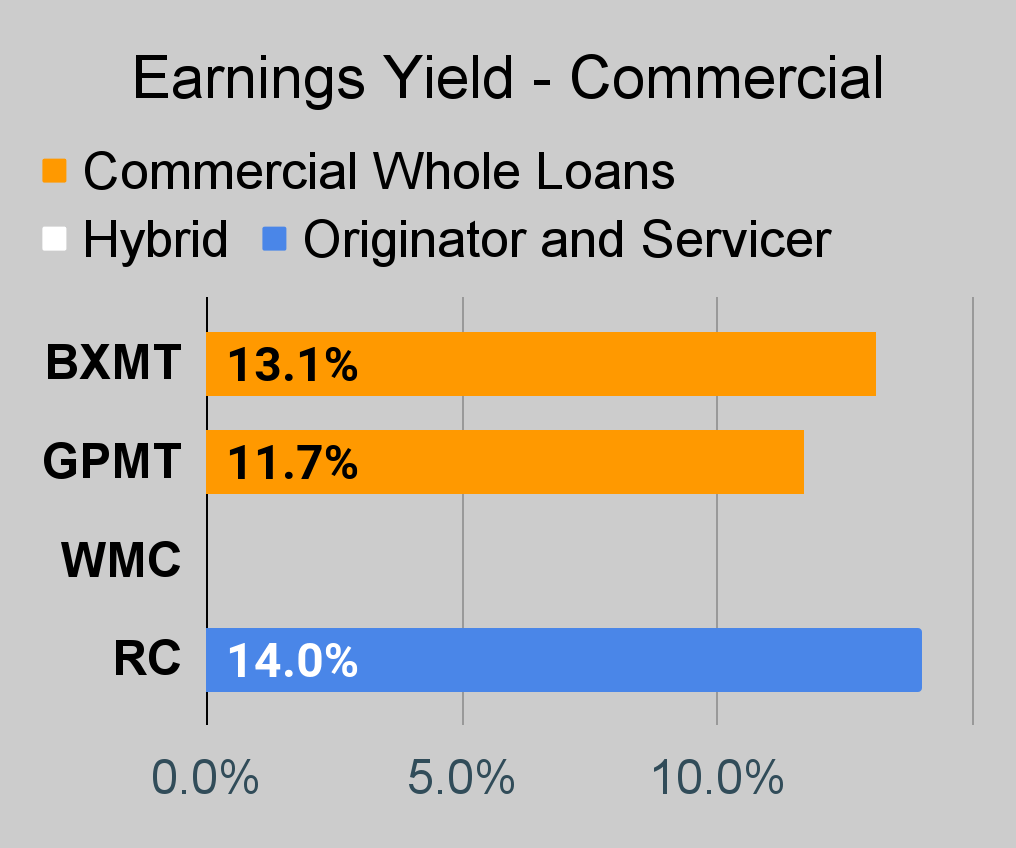
Commercial Mortgage REIT Charts
 The REIT Forum |
 The REIT Forum |
 The REIT Forum |
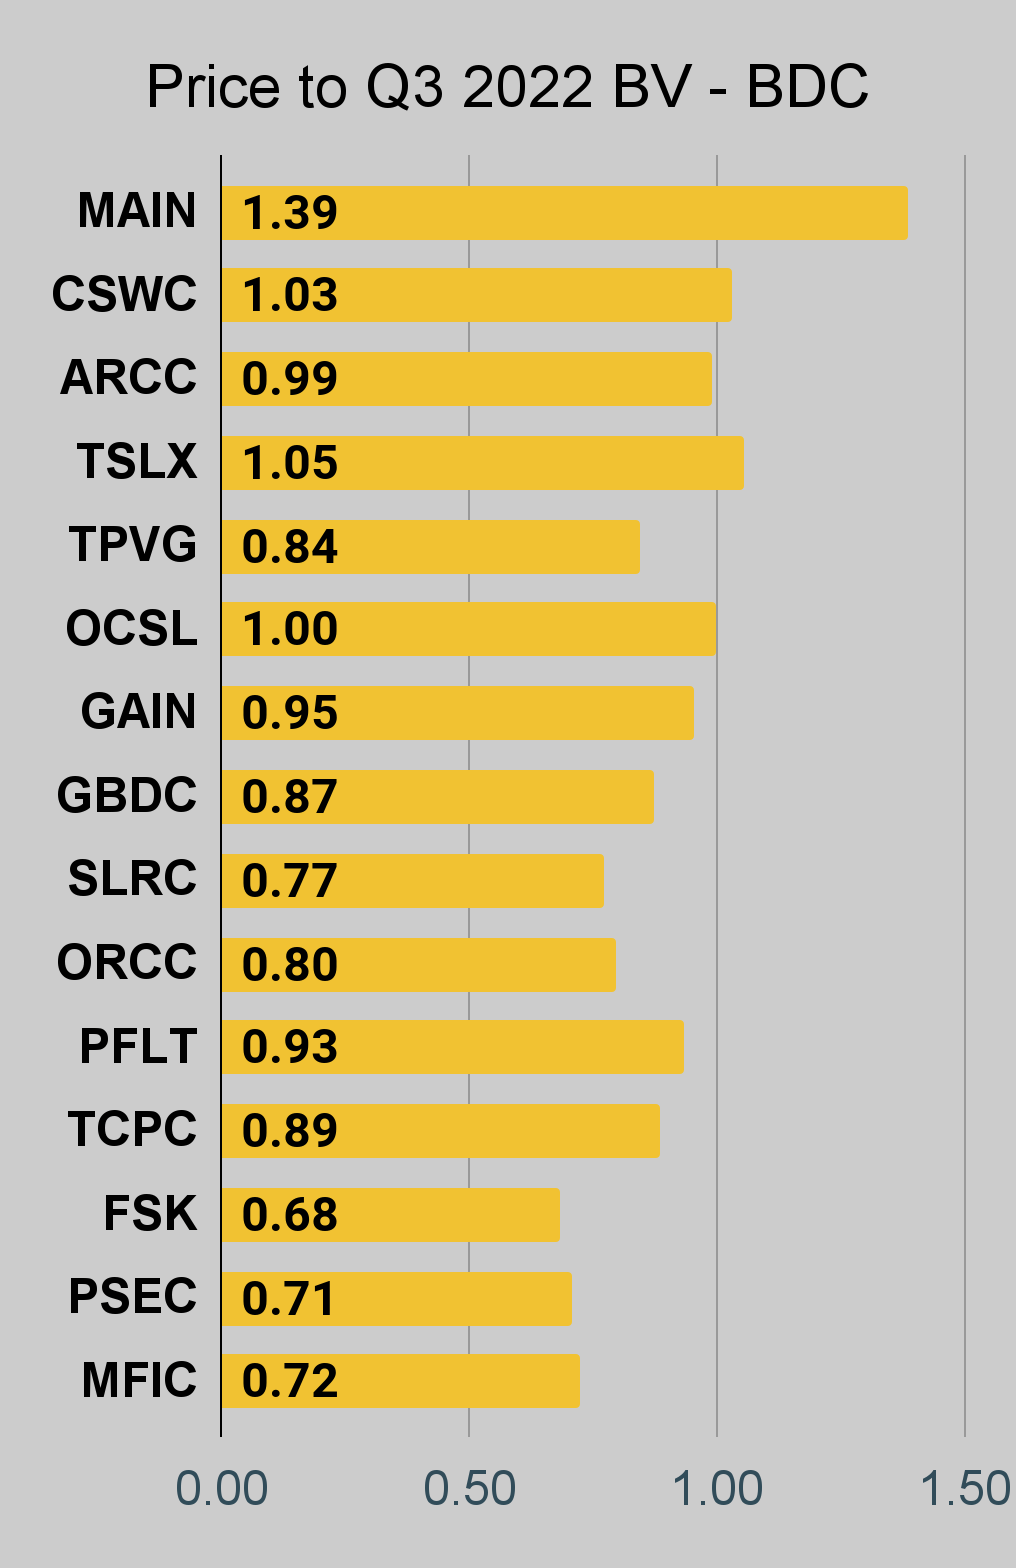
BDC Charts
 The REIT Forum |
 The REIT Forum |
 The REIT Forum |
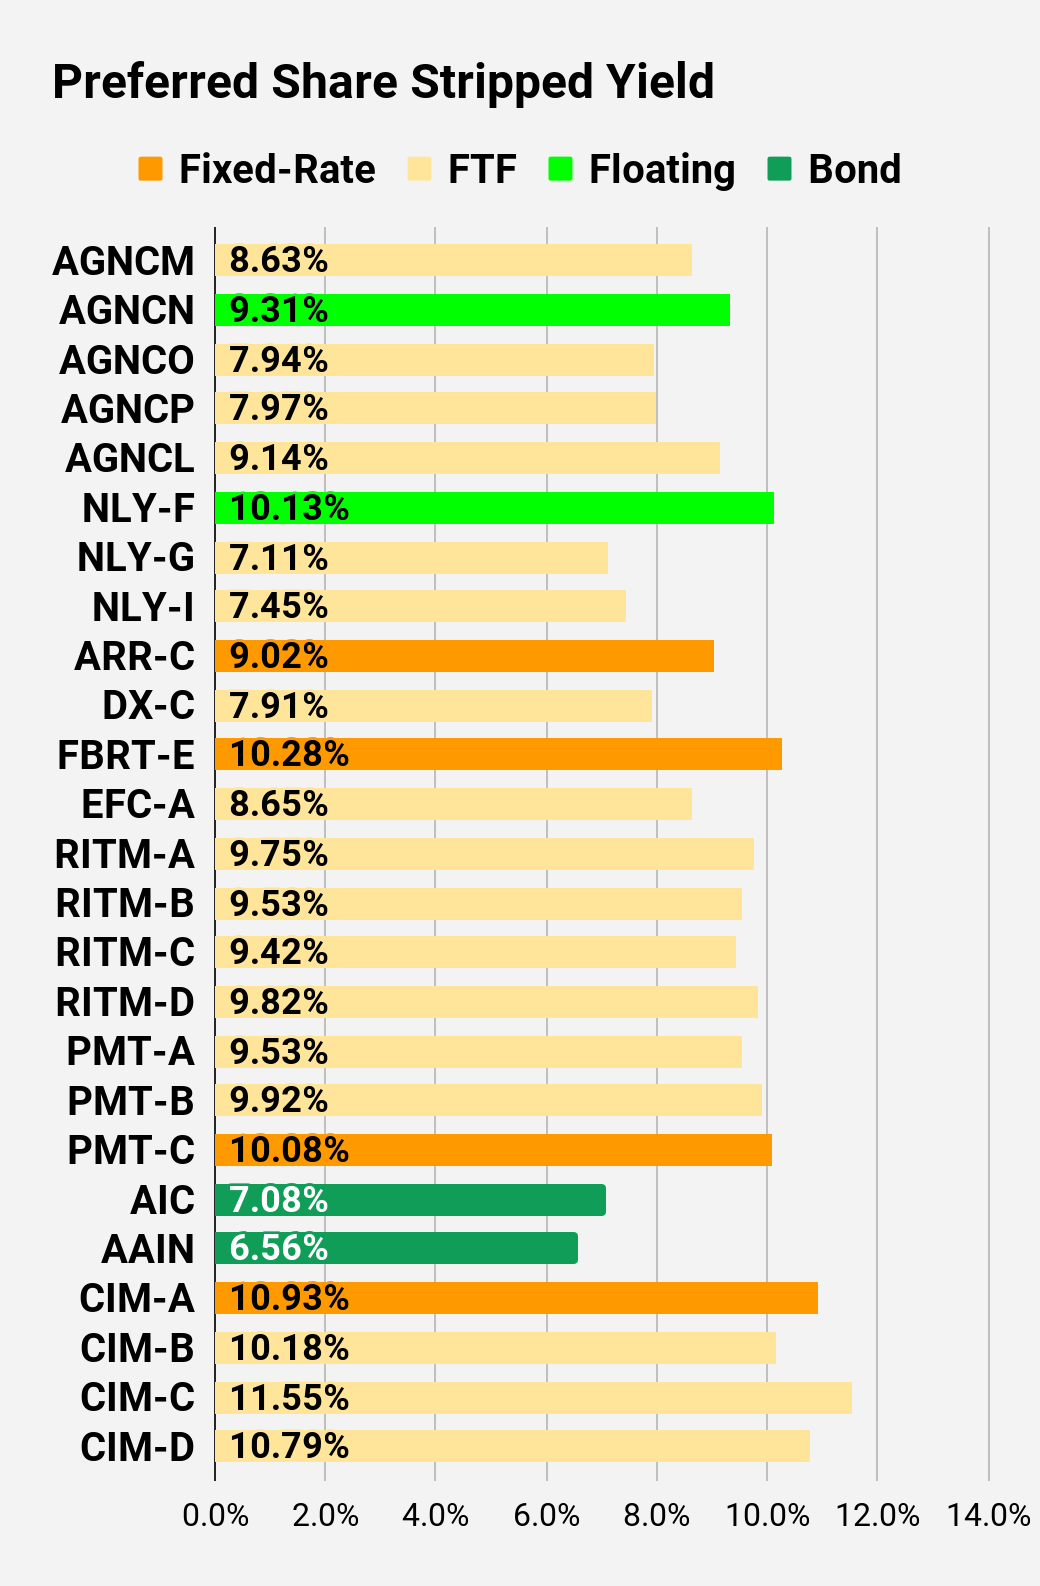
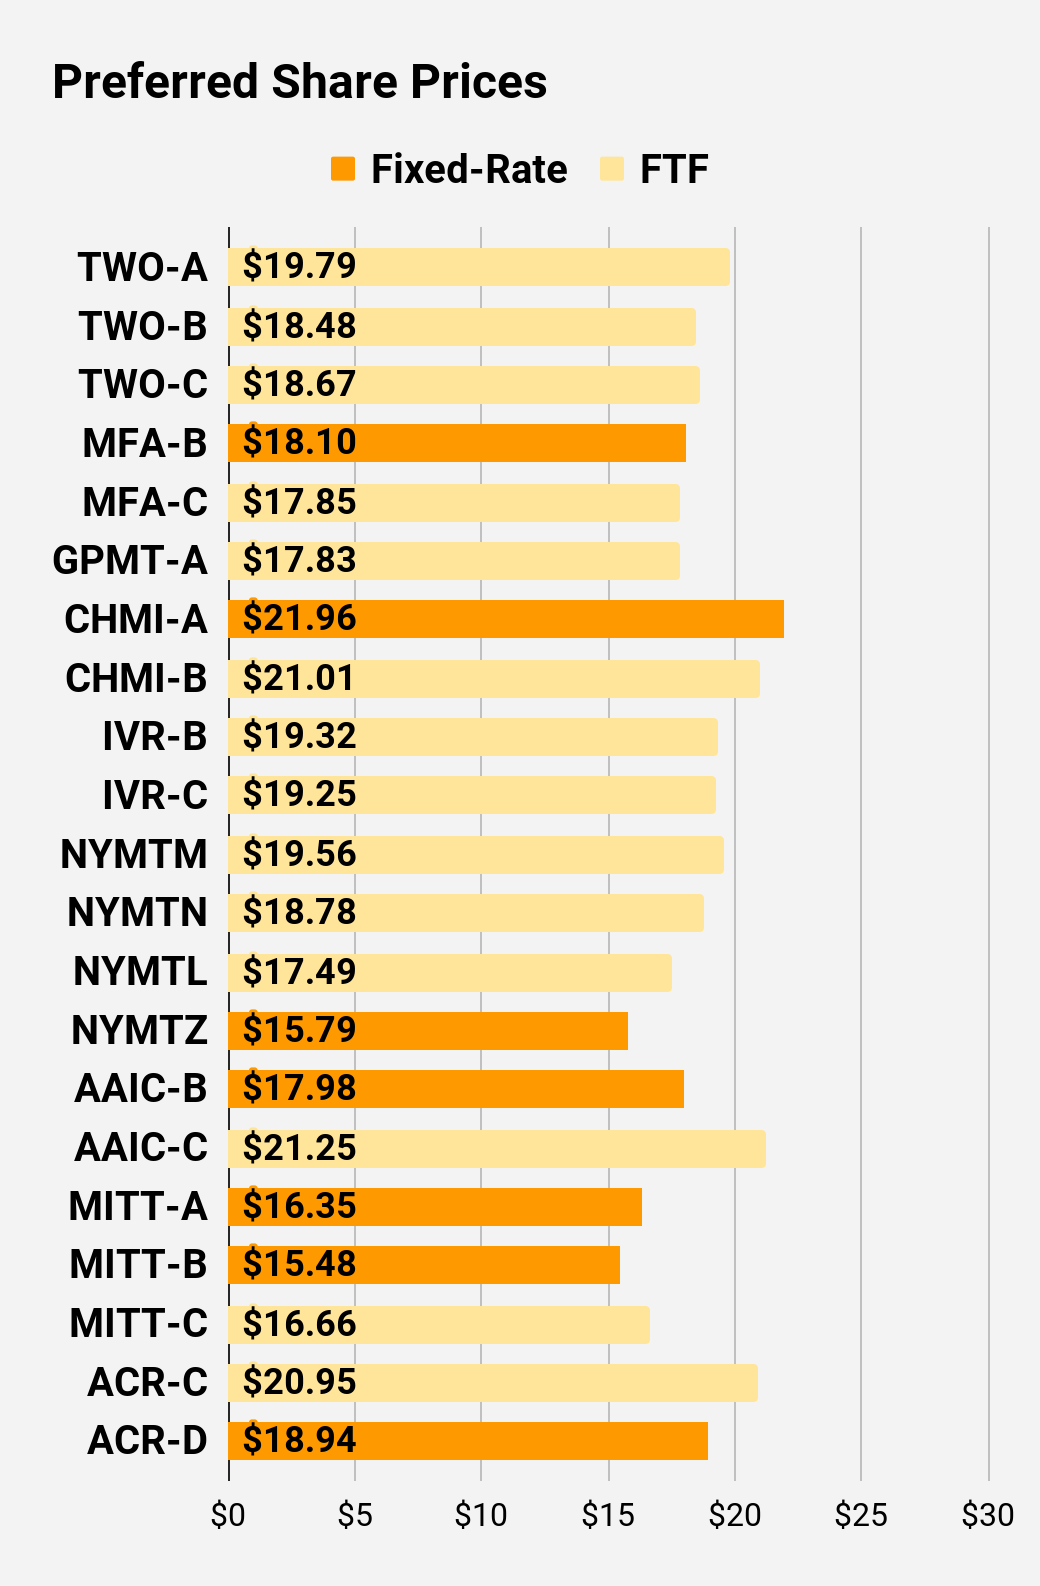
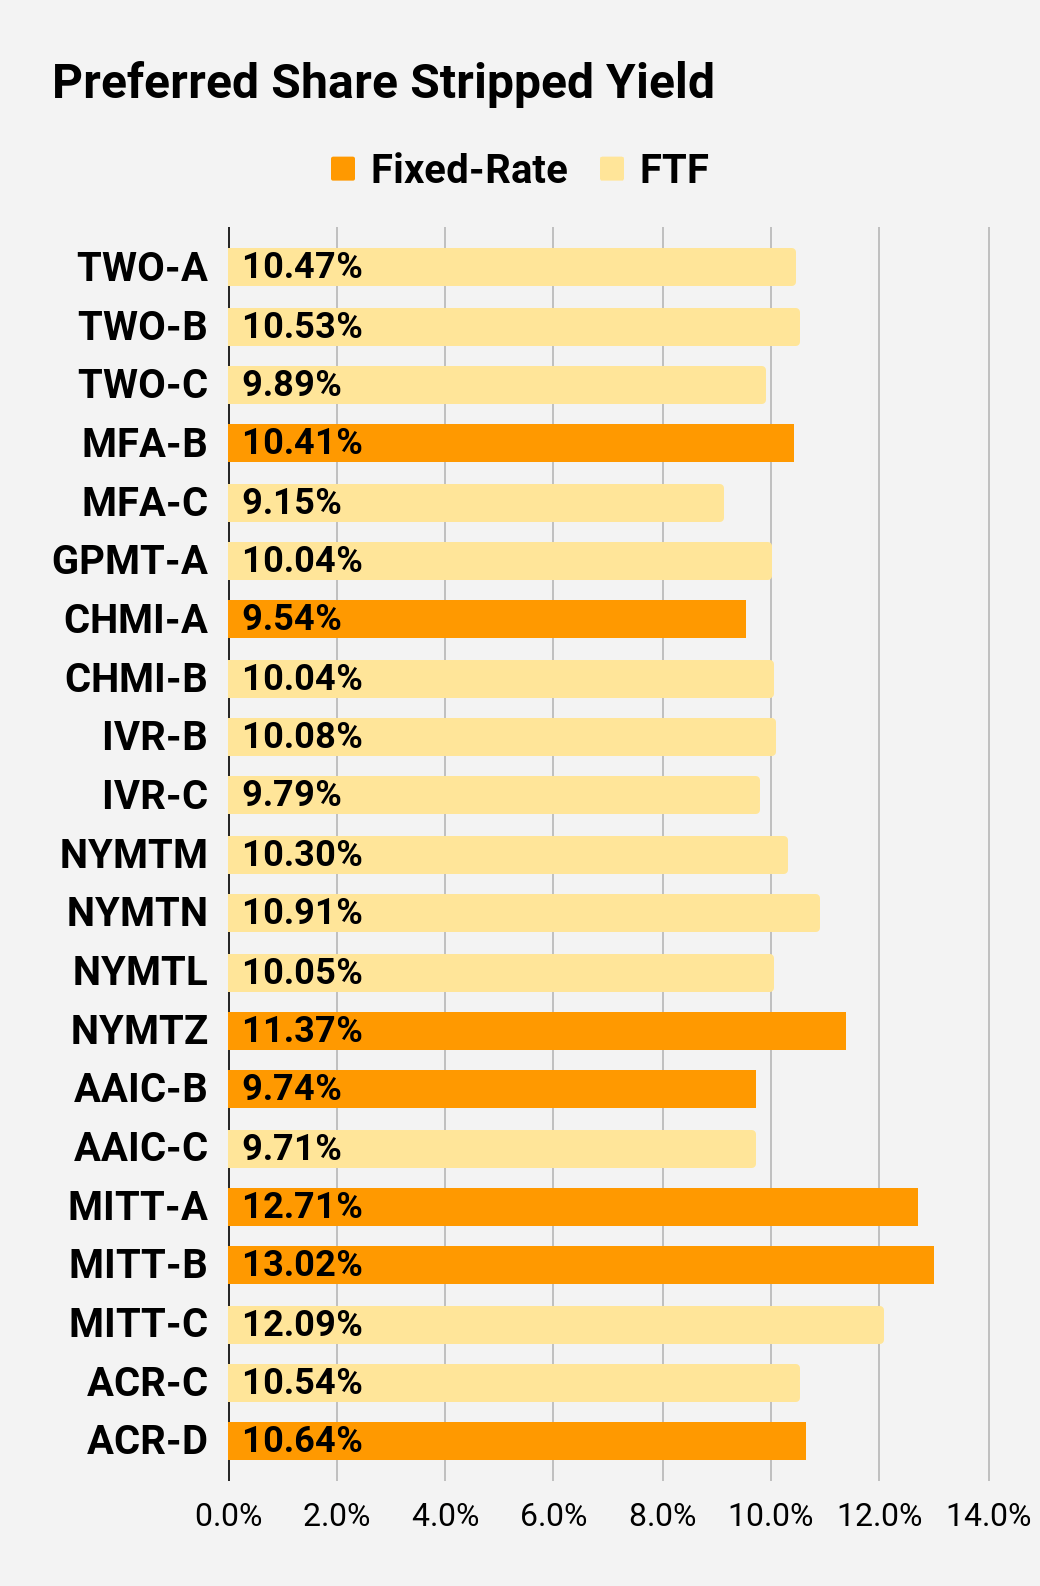
Preferred Share Charts
I changed the coloring a bit. We needed to adjust to include that the first fixed-to-floating shares have transitioned over to floating rates. When a share is already floating, the stripped yield may be different from the “Floating Yield on Price” due to changes in interest rates. For instance, NLY-F already has a floating rate. However, the rate is only reset once per three months. The stripped yield is calculated using the upcoming projected dividend payment and the “Floating Yield on Price” is based on where the dividend would be if the rate reset today. In my opinion, for these shares the “Floating Yield on Price” is clearly the more important metric.
 The REIT Forum |
 The REIT Forum |
 The REIT Forum |
 The REIT Forum |
 The REIT Forum |
 The REIT Forum |
Preferred Share Data
Beyond the charts, we’re also providing our readers with access to several other metrics for the preferred shares.
After testing out a series on preferred shares, we decided to try merging it into the series on common shares. After all, we are still talking about positions in mortgage REITs. We don’t have any desire to cover preferred shares without cumulative dividends, so any preferred shares you see in our column will have cumulative dividends. You can verify that by using Quantum Online. We’ve included the links in the table below.
To better organize the table, we needed to abbreviate column names as follows:
- Price = Recent Share Price – Shown in Charts
- BoF = Bond or FTF (Fixed-to-Floating)
- S-Yield = Stripped Yield – Shown in Charts
- Coupon = Initial Fixed-Rate Coupon
- FYoP = Floating Yield on Price – Shown in Charts
- NCD = Next Call Date (the soonest shares could be called)
- Note: For all FTF issues, the floating rate would start on NCD.
- WCC = Worst Cash to Call (lowest net cash return possible from a call)
- QO Link = Link to Quantum Online Page
Second Batch:
Strategy
Our goal is to maximize total returns. We achieve those most effectively by including “trading” strategies. We regularly trade positions in the mortgage REIT common shares and BDCs because:
- Prices are inefficient.
- Long term, share prices generally revolve around book value.
- Short term, price-to-book ratios can deviate materially.
- Book value isn’t the only step in analysis, but it’s the cornerstone.
We also allocate to preferred shares and equity REITs. We encourage buy-and-hold investors to consider using more preferred shares and equity REITs.
Performance
We compare our performance against four ETFs that investors might use for exposure to our sectors:
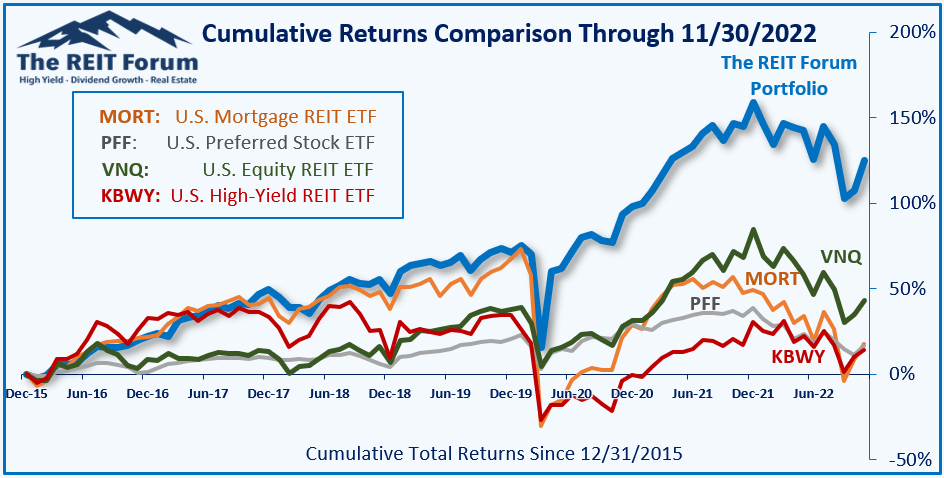
The REIT Forum
The four ETFs we use for comparison are:
|
Ticker |
Exposure |
|
One of the largest mortgage REIT ETFs |
|
|
One of the largest preferred share ETFs |
|
|
Largest equity REIT ETF |
|
|
The high-yield equity REIT ETF. Yes, it has been dreadful. |
When investors think it isn’t possible to earn solid returns in preferred shares or mortgage REITs, we politely disagree. The sector has plenty of opportunities, but investors still need to be wary of the risks. We can’t simply reach for yield and hope for the best. When it comes to common shares, we need to be even more vigilant to protect our principal by regularly watching prices and updating estimates for book value and price targets.
Ratings: Bullish on GPMT, AAIC, RITM, RITM-D
Editor’s Note: This article covers one or more microcap stocks. Please be aware of the risks associated with these stocks.
Be the first to comment