

Jonathan Kitchen
By Jay Jacobs
In 2023, the potential for performance dispersion among equities (i.e., some stocks doing quite well and some quite poorly) could mean it finally pays for growth and tech equity investors to consider getting selective again. Amidst a challenging economic outlook, from rates to potential recession, there are themes that may be poised to shine within growth and within technology. This means getting more precise about where to find opportunities that can navigate challenging near-term economic conditions, while seeking to capture exposure to long-term structural Megatrends.
Key Takeaways
- Dispersion returns: We believe dispersion across growth equities could return to historically higher levels, which means investors may want to be more selective to identify potential winners from losers than in years past.
- Fiscal policy could provide ballast: Trillions of new dollars in fiscal spending — ranging from the U.S. Inflation Reduction Act (IRA) to the U.S. Infrastructure Investment and Jobs Act (IIJA) to the European Union’s Global Gateway — should provide meaningful support specifically for clean energy, electric vehicles (EVs) and infrastructure in 2023 and beyond.
- Healthcare innovation continues: While investors have punished medical innovation of late, relative inelastic demand for medicine coupled with potential breakthroughs in genomics, immunology and neurology, may mean the space is being underestimated given recent challenged performance.
- Tech staples could separate from the pack: Tech is not a monolith. We believe cybersecurity and robotics have the potential to buck the economic cycle given cybersecurity has moved from niche to necessity and robots are mission-critical in fighting supply chain challenges, labor shortages and inflation.
With the potential for dispersion to return, it could help to get more precise
Dispersion Returns
2023 could well be the year to upend almost three years of growth and tech stocks moving in virtual unison.
The pandemic pulled forward demand for innovation. This, in combination with extremely loose financial conditions, led to broad blockbuster equity performance. The Russell 2000 Growth and the Nasdaq-100 Indexes surged a whopping 95% and 105%, respectively, from March 2020 to October 2021.1 In fact, over half of Nasdaq 100 firms were up over 90% in the period.2
In 2022, the script was flipped. Investors faced geopolitical conflict, supply chain disruption, monetary policy reversal and surging inflation, leading to a broad retreat. The Russell 2000 Growth and the Nasdaq-100 have declined 29% and 32%, respectively, through September 30, 2022.3 And half of Nasdaq-100 firms were down more than 30% during this period.4
These two periods look quite different on the surface, but they were both characterized by high correlation across growth and technology stocks, meaning these equities largely traded up or down together. We see this phenomenon as attributable to the fact that the drivers above — pandemic-induced tech adoption, unprecedented monetary policy loosening and then equally unprecedented tightening — were unilaterally moving markets.
Almost three years of heightened correlation between growth stocks
Pairwise correlation between stocks in the Nasdaq-100 Index
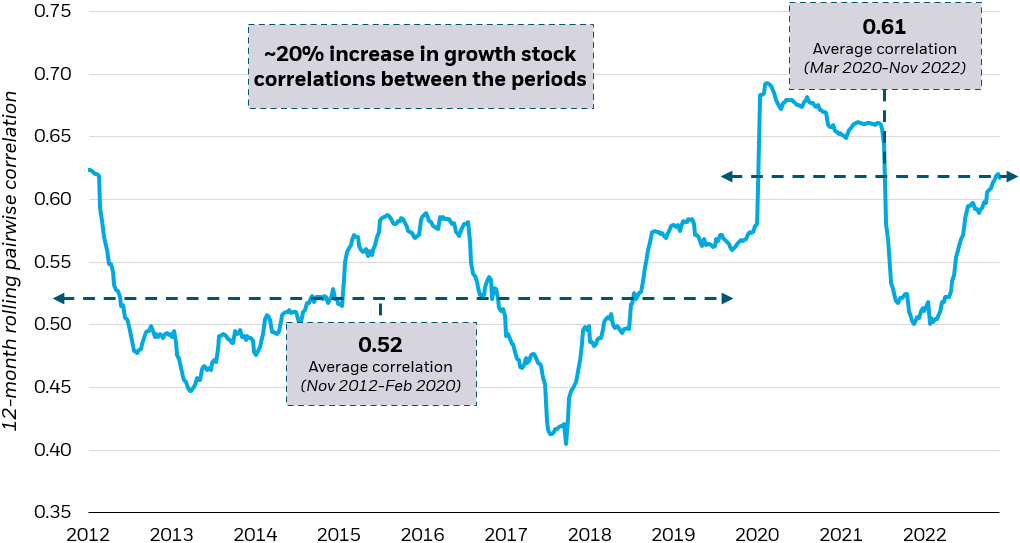
Source: BlackRock, Reuters. Daily average pairwise correlation on a 12-month rolling basis of the Nasdaq-100 Index from 11/6/2012 to 11/1/2022. Pairwise correlation is a statistic that measures the degree to which two securities move in relation to one another. The pairwise correlation between stocks is a value between -1 and 1. Two stocks that perform identically will have a value of 1, while two stocks that are perfectly inversely related will have a value of -1.
Index performance is for illustrative purposes only. Index performance does not reflect any management fees, transaction costs or expenses. Indexes are unmanaged and one cannot invest directly in an index. Past performance does not guarantee future results.
Chart description: Line chart showing the daily average pairwise correlation on a 12-month rolling basis of the Nasdaq-100 Index from 11/6/2012 to 11/1/2022. The chart shows that the average correlation from November 2012 to March 2020 was 0.52, and it increased about 20% to 0.61 from March 2020-November 2022.
While uncertainty abounds as we look to 2023, three things are clear to us.
- We do not believe heightened growth stock correlations are likely to persist. We anticipate a reversion back to historical norms given that recent developments, from the end of central banks’ “easy money” policies to the beginning of a multiyear deglobalization trend, may contribute to greater economic uncertainty and market volatility.
- Because of 2022’s headwinds, relative valuations may appear more attractive than in recent years. Although still elevated from historical averages, the Russell 2000 Growth and Nasdaq-100 price-to-earnings (P/E) ratios, which measure the relationship between a company’s stock price and earnings per share (EPS), were at 10.4x and 21.6x on September 30, 2022, near their lowest points since March 2020.5 In other words, growth and technology stocks may currently be undervalued relative to recent valuations.
- We believe economic weakness and persistent inflation are likely to continue to impact the economy unevenly, presenting unique challenges and opportunities.
Because of these three factors, we believe investors may not be well-served by simply “buying growth” or “buying tech.” While more attractive valuations may compel investors to revisit growth stocks in 2023, investors may want to structure their portfolio allocations with greater precision.
We focus our 2023 thematic outlook on three areas that appear primed to both potentially weather the difficult economic and monetary policy environment in the near term and that could benefit from powerful structural forces over the long term, specifically: beneficiaries of fiscal spending, areas of healthcare innovation, and counter-cyclical segments of the technology sector.
Government spending provides a steady buyer and could help accelerate growth
Themes in focus: infrastructure, clean energy, electric vehicles
Over $1.5 trillion of U.S. government spending will be directed towards infrastructure, clean energy and electric vehicles in 2023 and beyond. An additional €300 billion from the European Union’s Global Gateway will also support these themes.6 As projects come online, the magnitude of fiscal spending should help accelerate these themes and uncover great synergies.
Infrastructure
The Infrastructure Investment and Jobs Act (IIJA) directs $1.2 trillion to U.S. infrastructure.7 $110 billion across 4,300 projects has been announced for 2023. Across the country, from California to Illinois to New York, $21.6 billion in announced spending8 includes purchasing battery-electric buses in Los Angeles,9 modernizing air traffic control in Peoria10 and improving rail connection through the East River Tunnel into Manhattan.11
Map of infrastructure projects funded by federal grants
IIJA funding is impacting communities across the United States

Source: Agency Press Releases, Build.gov Publicly Announced IIJA Funding (Formula and Discretionary) as of September 6, 2022.
Graphic description: Map of the United States illustrating the scope of the IIJA. Data points represent announced funding for projects (formula and discretionary) as of September 6, 2022. All data represented on this map, including project locations, is preliminary and non-binding.
Nationwide, infrastructure enablers — from construction to materials — could be the first to benefit from this spending boom. Meanwhile, elevated inflation and interest rates could help infrastructure owners, notably power, water and sanitation, appear attractive given inflation-linked revenues, long-term fixed debt and the provision of services, such as lights, water and trash collection, that are typically less sensitive to recession.
Clean energy and electric vehicles
The Inflation Reduction Act (IRA), which became law in August, built on the IIJA’s strong foundation — directing $370 billion to clean energy and EVs — dollars that will flow for a decade.12 While $370 billion is the Congressional Budget Office’s (CBO) projection, tax credits may be utilized far more, and spending may well double to as much as $800 billion.13 This is where synergies could come into play. The IIJA and the IRA work in tandem and reinforce one another, creating a virtuous cycle for clean energy and EVs.
A virtuous cycle
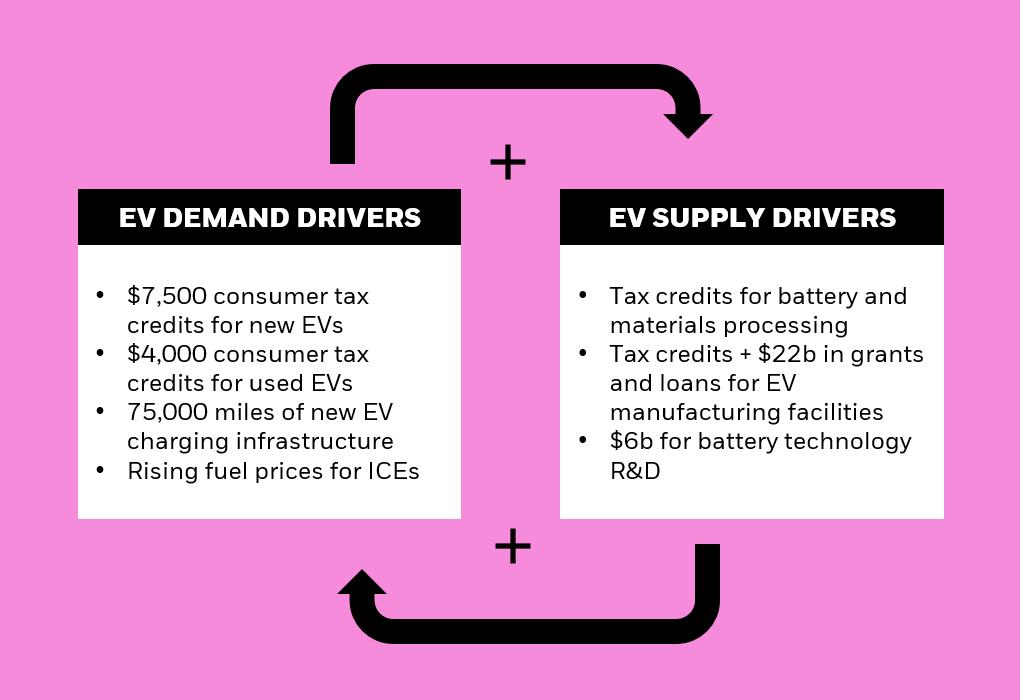
More consumer demand for EVs could drive more use of government incentives for suppliers that lower EV costs, resulting in yet more demand.
Virtuous cycle of EV supply and demand drivers
EV supply and demand drivers, including IIJA and IRA incentives, reinforce and create synergies
Source: Senate Democrats, “Summary of the Energy Security and Climate Change Investments in the Inflation Reduction Act of 2022,” accessed on November 4, 2022. U.S. Department of Transportation, “Historic Step: All Fifty States Plus D.C. and Puerto Rico Greenlit to Move EV Charging Networks Forward, Covering 75,000 Miles of Highway,” as of September 27, 2022. U.S. Senator Ben Cardin, “Bipartisan Infrastructure Investment and Jobs Act Summary,” as of September 2022.
Graphic description: Illustration depicting the virtuous cycle between the EV demand and supply drivers. The arrows indicate that the bulleted lists of EV demand drivers and EV supply drivers impact one another, and the plus symbols indicates where the impact could be positive. Taken together, this could be a positive reinforcing loop — a virtuous cycle.
With the IIJA and the IRA, one plus one equals a lot more than two. For example, the IIJA includes $7.5 billion for 500,000 EV chargers;14 $1.5 billion is already fully available to states and expected to extend EV charging infrastructure across 75,000 miles of highways.15 At the same time, the IRA’s expanded $7,500 tax credit for the purchase of new EVs and a new $4,000 credit for used EVs went into immediate effect.16 These help bring upfront EV purchase costs closer towards price parity with internal combustion engine (ICE) counterparts alongside already lower lifetime ownership costs. The “spending” in the IRA on tax credits, loans and grants depend on voluntary uptake of firms in financing new facilities and production. As a result, we believe that with the potential for increased consumer demand, driven by better charging and lower costs for EVs, will increase manufacturer uptake of these programs significantly. This is likely to supercharge both the IRA’s total spend and impact — that could benefit the entire electric vehicle value chain in the short and mid term.
We believe government spending could directly benefit infrastructure, clean energy and electric vehicles — which we have long seen as Megatrend themes that may be poised for long-term structural growth. In our view, investors looking to gain exposure to these themes may want to consider targeted ETFs that employ a tailored construction process to capture each theme’s respective value chain.
Medical Breakthroughs could continue as health spending continues to increase and promising drug pipelines accelerate
Themes in focus: genomics, immunology, neuroscience
Healthcare remains an appealing area for targeted growth opportunities, given relative inelastic demand and many late-stage trials across genomics, immunology and neuroscience. U.S. healthcare spending has increased in all but one of the last 50 years, demonstrating resilience across the economic cycle.17 Although healthcare innovation had challenged performance in 2022 due to low current profitability, this could be underestimating just how groundbreaking the next 12 to 24 months could be.
GENOMICS
Gene therapies
Gene therapies, which replace disease-related genes, saw approvals double in 2022. New drugs, each treating rare diseases, could potentially generate significant and immediate revenues if past lessons hold true. One approved gene therapy for spinal muscular atrophy (SMA), a rare hereditary disease, made waves after it dramatically improved outcomes for those with the disease. This therapy generated $1.4 billion in 2021 alone, just two years after approval.18 Further, new approvals indicate an accommodative regulatory environment that could open the door for a surge in new therapies. For example, there are two therapies for hemophilia under review and 9+ others waiting to file.19
Increasingly mature gene therapy pipeline signals upcoming approvals
Cumulative AAV gene therapy trials completed by year
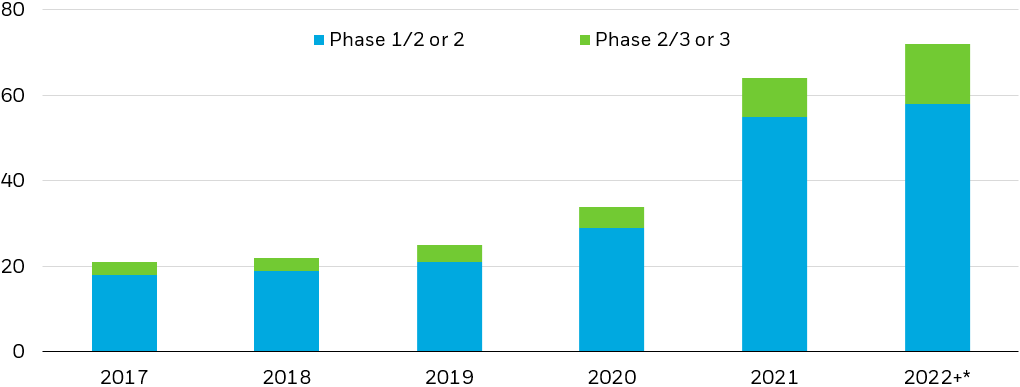
*Forecast
Source: Edna et al. Frontiers in medicine, 2022.
Chart description: Stacked column chart showing the number of adeno-associate virus (AAV) gene therapy trials completed per year across clinical trial stages. The chart shows how the number of completed trials have accelerated in recent years.
mRNA therapeutics
In mRNA (messenger RNA) therapeutics, which stimulate our immune systems, we are witnessing a robust, late-stage pipeline targeting influenza, brain cancer, HIV, and hepatitis. The mRNA flu vaccine, which entered phase 3 trials in June, could see accelerated approval– potentially disrupting a $10 billion market and upending the seasonal flu as we know it.20, 21
Genetic medicines have experienced rapid sales growth following first wave of approvals and after decades of R&D made the concept viable
Global genetic medicine sales ($b) ex COVID-19 vaccines
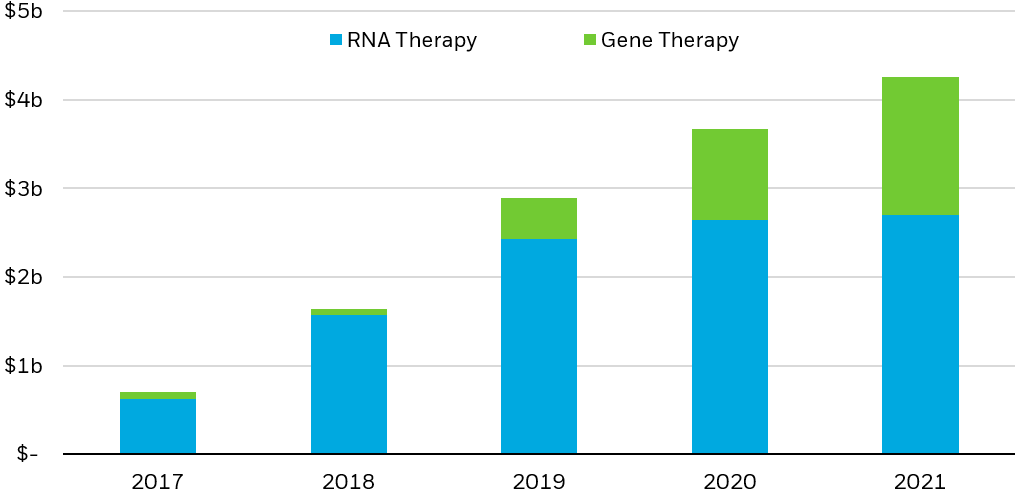
Note: RNA therapies include siRNA & ASO drugs in addition to mRNA.
Source: IQIVIA, 2022.
Chart description: Stacked column chart showing global genetic medicine sales in billions of US dollars (excluding COVID-19 vaccines) across RNA and gene therapies. The chart shows that the genetic medicine market has experienced rapid growth from 2017 to 2021.
Immunology
Adoptive cell therapies (ACT)
ACTs fight disease using reengineered immune cells. CAR T-cell therapies, a type of ACT, are proving effective at fighting cancer. 2022 saw a new CAR T therapy approved, bringing the total to six, while two previous approvals were given the green light as second-line cancer treatments.22 Approved CAR T cell therapies could generate $2.3 billion in sales in 2023, 32% more than in 2021.23, 24 Meanwhile, many major pharmaceuticals are investing heavily in developing their own CAR T platforms, making involved companies attractive as potential targets for acquisition or revenue-generating collaborations.
Antibody drug conjugates (ADCs)
ADCs, which use antibodies to destroy cancer cells, saw record demand in 2022. This followed 2021 introducing three new ADCs, bringing approvals to 12. Erin Xie, lead portfolio manager for BlackRock’s Health Sciences Team, sees further opportunity in this innovative class of drugs: “Targeted antibody drug conjugates, or ADCs, have disrupted cancer progression, with less adverse effects than traditional chemotherapy. This technology is being developed for the treatment of breast and lung cancers, but also has the potential for much broader adoption.” Already seeing greater use, ADCs could soon become first-line cancer treatments and see sales benefit as a result. In 2023, ADC sales are expected to grow 39% year-over-year.25
Neuroscience
Neurology is expected to see the fourth most drug spending across therapeutics, potentially reaching $151 billion by 2026,26 and neuroscience drugs currently represent 10% of the global late-stage pipeline.27 Groundbreaking phase 3 clinical trial results were recently announced for an Alzheimer’s-fighting monoclonal antibody that could receive FDA approval as soon as next year.28 There has not been a successful new treatment for Alzheimer’s released in two decades — the drug could become an immediate success. Even now, it offers evidence of the improving ability to treat neurological conditions; the potential antibody treatments could help fight unaddressed conditions.
Oncology, immunology, and neurology lead other therapeutic areas significantly when it comes to future spending
Projected 2026 spending ($b)
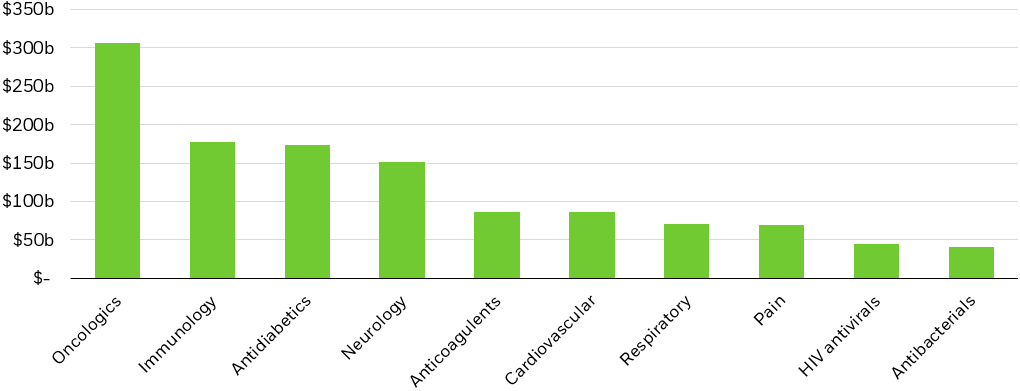
Note: Genetic medicines span most therapeutic areas. There is no guarantee these forecasts come to pass.
Source: IQIVIA, “The Global Use of Medicines 2022: Outlook to 2026,” 2022.
Chart description: Column chart showing expected 2026 spending by therapy area. The chart shows that oncology, immunology, and neurology are expected to experience significantly more spending than other areas in the future.
Medical breakthroughs are bringing about an age of precise and preventative medicine that is transforming our approach to care and driving positive outcomes across the healthcare system. Investors seeking exposure to advances in healthcare innovation may want to consider ETFs targeting companies that generate the majority of their revenue from related therapeutics and technologies.
Not all tech is the same, as tech-staples could prove resilient amid tighter wallets
Themes in focus: cybersecurity, robotics
If in 2020 and 2021, everything in technology seemed to work for investors, 2022 was the year that nothing worked. This year, a huge proportion of gains have been given back on the unified belief that technology, as a whole, could suffer from high rates and the end of the economic cycle. We believe that cybersecurity and robotics could be better positioned for a slowdown than this year’s indiscriminate selloff would indicate.
Cybersecurity
Cyberattacks are up 81% over pre-pandemic levels29 and the economic costs they inflict are set to reach $10.5 trillion.30 With firms paring back discretionary spending amid economic uncertainty, cybersecurity is being viewed as anything but discretionary by chief technology officers (CTO), so we view it as the least likely tech expense to be cut in a downturn.
Cybersecurity is a top priority
Areas of technology spending least likely to be cut (%)
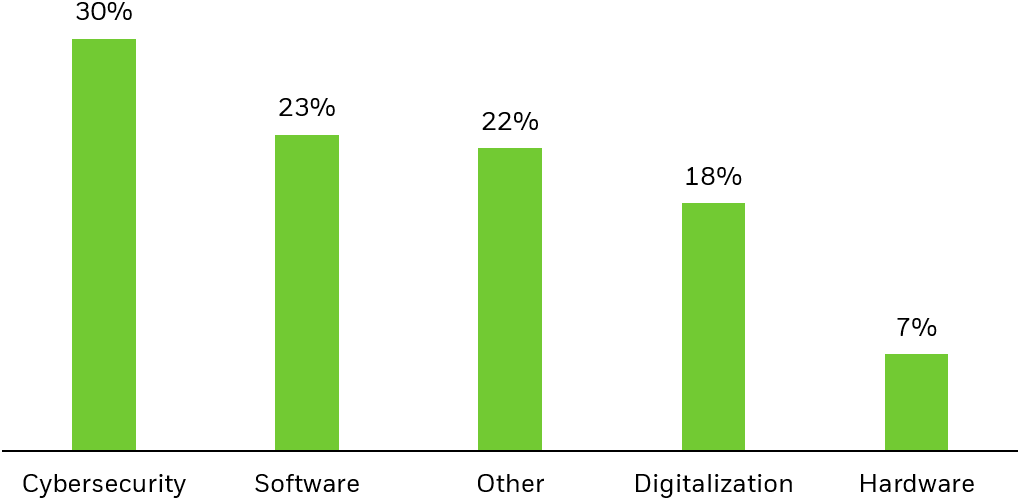
Source: Morgan Stanley Research, 6/24/22, “2Q22 CIO Survey Macro Flash” of 100 respondents. “Other” reflects categories such as artificial intelligence, quantum computing and blockchain.
Chart description: Bar chart highlighting areas of technology spending that are least likely to be cut, per a survey of CIOs by Morgan Stanley Research. The chart shows that 30% of CIOs surveyed believe that cybersecurity is the least likely area of technology to be cut.
Policy is also immediately supportive: in March 2022, President Biden signed the “Cyber Incident Reporting for Critical Infrastructure Act of 2022,” requiring hacks be reported to the Department of Homeland Security,31 while the European Union has proposed rules for cyber hygiene.32
We expect cybersecurity spending to stand strong — with firms’ Software-as-a-Service (SaaS) contracts being extended and enhanced — in addition to new capital expenditure on cybersecurity hardware solutions for data centers and servers, as well as biometric security, with a 14.1% projected compound annual growth rate (CAGR) through 2027.33 Despite this, the price-to-sales (P/S) ratio, a valuation metric that compares a company’s share price to its revenue, for the S&P 500 tech sector remains significantly higher than for cybersecurity, at 4.8x versus 2.7x.34 A relatively lower P/S ratio indicates that investors are currently willing to pay less per dollar of annual revenue for cybersecurity stocks than they are for technology stocks broadly, meaning that this could potentially be an attractive entry point for investors.
Robotics
Robots represent one of the most powerful tools in fighting today’s economic challenges. Open jobs in the U.S. exceed unemployed workers by 5 million,35 annual wage growth is 6%,36 supply chain pressures are a standard deviation above historical averages,37 and a record number of jobs may be near- or re-shored.38
Supply-chain shifts get more attention during U.S. corporate presentations
Mentions of supply-chain shifts
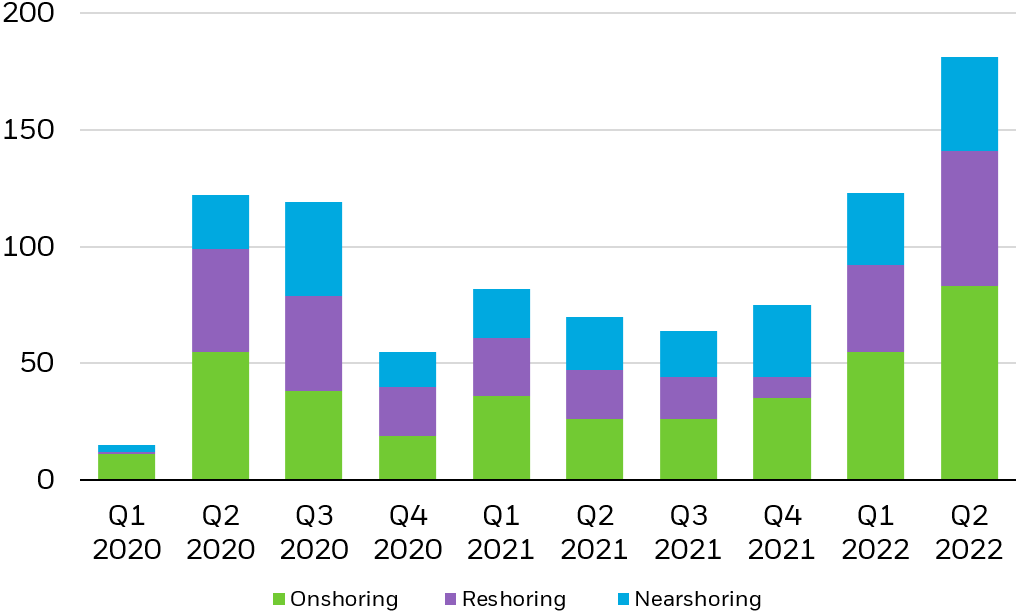
Source: Bloomberg data, as of July 2022. Data from a review of earnings calls and conference presentations transcribed by Bloomberg.
Chart description: Stacked bar chart showing the mentions of supply-chain shifts during U.S. earnings calls and conference presentations. Onshoring is the relocation of processes to a location inside national borders. Reshoring is the process of transferring processes that were moved overseas back to the country from which they were originally relocated. Nearshoring is the outsourcing of processes to companies in a nearby country, often sharing a border with the target country.
Greater usage of robots in logistics, warehouses, manufacturing, health care, and services industries could help alleviate these pressures; for every dollar of increased wages, the investment in robotics becomes increasingly attractive. Moreover, we see ongoing robotics growth being driven not just by rising labor costs but also falling robotics prices.
The cost of automation has fallen in comparison with labor costs
Index of average robot prices and labor compensation in manufacturing in the U.S., 1990=100%
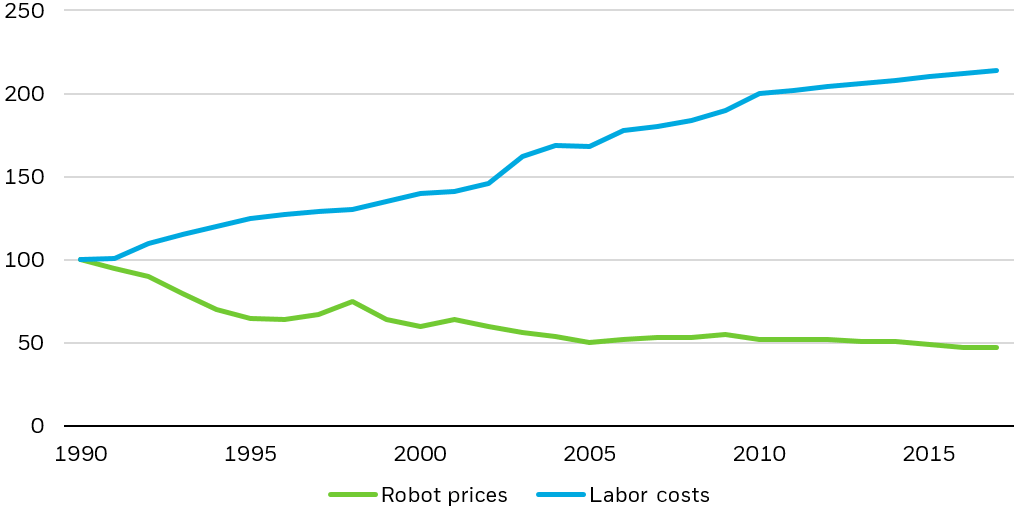
Source: McKinsey, “Automation, robotics and the factory of the future,” 2017. For illustrative purposes only.
Chart description: Line chart showing the index of average robot prices and labor compensation in manufacturing in the U.S. from 1990 to 2017, starting at an origin of 100%. The chart shows that the average robot price has fallen by half in real terms, and even further relative to labor costs, over the past 30 years.
In our view, robotics companies have the potential for future growth. However, valuations do not reflect this growth; the P/E ratio of the NYSE FactSet Global Robotics and Artificial Intelligence Index is half of the P/E of the S&P 500 Technology Index (11.2x vs. 22.1x).39
Innovation matters too. Robotics as a service (RaaS) is beginning to ease the costs of adoption, as subscription-based rentals enable employers to scale usage as they do software and cloud — with uptake projected at 17% CAGR through 2028.40 Many businesses that experience seasonal demand increases will use RaaS to scale production without having to make permanent, year-round investments. Look also in 2023 for autonomous mobile robots (AMRs) to proliferate. AMRs, unlike their more common cousins, autonomous guided vehicles (AGVs), do not require predefined paths or human oversight. AMRs are particularly helpful in healthcare settings, where cleaning robots are leveraging UV light to sanitize surfaces while navigating crowded spaces with large, physical equipment and multiple moving pieces.41 Economic conditions and innovation together are why the market estimates a CAGR for robotics of 22.8% through 2030.42
Impact of deglobalization
Deglobalization continues to impact tech
Beyond Megatrends, we think it is critical for any discussion of technology in 2023 to note that deglobalization efforts are likely to remain in focus, impacting the entire sector. For example, the CHIPS and Science Act (CHIPS)’s $53 billion to support American semiconductor production “will lead to the geographical realignment of manufacturing capacity away from Asia,” according to Tony Kim, portfolio manager for Fundamental Active Equity who manages over $30 billion in tech assets at BlackRock. Here and in other sensitive technologies, like batteries, quantum computing, and artificial intelligence, government intervention through carrots (fiscal spending) and sticks (tariffs and regulations) will only continue. Jeff Shen, Co-CIO of Systematic Active Equities, is looking towards alternative data sources to monitor developments in company actions as a result, noting that “the location of critical value chain activities and labor force decisions are less likely to be focused on reducing production costs alone, with companies emphasizing reliability alongside cost-efficiency.” This presents a compelling case for tech firms that are more domestically focused across production and sales and less at risk of getting caught in the crosshairs of geopolitics.
We expect cybersecurity and robotics spending to increase at an accelerated clip, regardless of economic conditions, offering possible growth potential for cybersecurity and robotics ETFs. Investors looking for exposure to these themes via public equities may want to consider looking at ETFs invested in companies that generate a majority of their revenues from related activities.
Conclusion
Ladies and gentleman, start your electric engines
In 2023, we anticipate the return of dispersion to growth equity investing. Higher dispersion, in a challenging phase of the economic cycle, means that the themes present in broad growth and technology benchmarks may no longer move in lockstep. Attractive relative valuations could be capitalized on with opportunities driven by fiscal spending, near-term medical innovation and counter-cyclical technology. Investors should consider getting choosey again. All of this comes together in thematic strategies, which are built using a tailored construction process to best capture each theme’s or multiple themes’ value chain. Owning a targeted basket of securities that are poised to benefit from the emergence of a theme, regardless of sector or geography, can solve this challenge and allow investors to seek outperformance.
© 2022 BlackRock, Inc. All rights reserved.
1 BlackRock, Bloomberg. Total returns of the Russell 2000 Growth Index and the Nasdaq-100 Index are for the holding period assuming that dividends were reinvested at the spot price. Monthly data from 3/31/2020 to 10/29/2021. Past performance does not guarantee future results.
2 BlackRock, Bloomberg. 52 of the 102 companies in the Nasdaq 100-Index had a total return of more than 90% from 3/31/2020 to 10/29/2021. Total returns are for the holding period assuming that dividends are were reinvested at the spot price. Past performance does not guarantee future results.
3 BlackRock, Bloomberg. Total returns of the Russell 2000 Growth Index and the Nasdaq-100 Index are for the holding period assuming that dividends were reinvested at the spot price. Monthly data from 12/31/2021-9/30/2022. Past performance does not guarantee future results.
4 BlackRock, Bloomberg. 51 of the 102 companies in the Nasdaq 100-Index had a total return less than -30% from 12/31/2021-9/30/2022. Total returns are for the holding period assuming that dividends are were reinvested at the spot price. Past performance does not guarantee future results.
5 BlackRock, Morningstar. Price-to-earnings ratios for the Russell 2000 Growth Index and the Nasdaq-100 Index as of 9/30/22. Past performance does not guarantee future results.
6 European Commission, “Global Gateway,” December 1, 2021
7 U.S. Congress, November 2021.
8 General Services Administration, Data to Decisions, “Bipartisan Infrastructure Law (BIL) Maps Dashboard,” as of October 25, 2022.
9 U.S. Department of Transportation, Federal Transit Administration, “FY22 FTA Bus and Low- and No-Emission Grant Awards,” as of October 24, 2022.
10 U.S. Department of Transportation, Federal Aviation Administration, “Bipartisan Infrastructure Law – Airport Terminals Program,” accessed on November 3, 2022.
11 U.S. Department of Transportation, “Biden Administration, USDOT Announce Over $233 Million in Grants to Upgrade Intercity Passenger Rail Service,” as of August 18, 2022.
12 US Senate, “Summary of the Energy Security and Climate Change Investments in the Inflation Reduction Act of 2022,” July 2022.
13 Credit Suisse Research, September 2022.
14 U.S. Department of Transportation, “President Biden, Department of Transportation Releases Toolkit to Help Rural Communities Build Out Electric Vehicle Charging Infrastructure,” February 2, 2022.
15 U.S. Department of Transportation, “Historic Step: All Fifty States Plus D.C. and Puerto Rico Greenlit to Move EV Charging Networks Forward, Covering 75,000 Miles of Highway,” as of September 27, 2022.
16 US Senate, “Summary of the Energy Security and Climate Change Investments in the Inflation Reduction Act of 2022,” July 2022.
17 U.S. Centers for Medicare & Medicaid Services, National Health Expenditure Accounts Database, accessed Oct 10, 2022.
18 FactSet, accessed October 18, 2022.
19 Prime Therapeutics, “Gene/Cell Therapy Quarterly Update: September 2022,” Sep 30, 2022.
20 Moderna, “Moderna announces first participants dosed in phase 3 study of seasonal influenza vaccine candidate (mrna-1010),” June 7, 2022.
21 BioSpace, “With 34 Vaccine Programs in Development, Moderna Eyes Global Launches,” Sep 9, 2022.
22 Fierce Pharma, “Bristol’s Breyanzi wins broader FDA nod, bringing CAR-T showdown with Gilead to earlier lymphoma,” Jun 24, 2022.
23 Research & Markets, “Global $6+ Billion CAR-T Therapy Market Opportunities and Strategies to 2030,” Jan 29, 2021.
24 Research & Markets, “Global CAR-T Cell Therapy Markets, Competition, Forecast and Opportunities, 2027 – Rapidly Growing Clinical Trial Activities, Proliferative M&A Activities, and Lucrative IPOs,” April 4, 2022.
25 Grand View Research, “Antibody-Drug Conjugates Market Size, Share & Trends Analysis Report Application (Blood Cancer, Breast Cancer, Urothelial/Bladder Cancer), By Technology (Cleavable, Non-cleavable), By Payload Technology, And Segment Forecasts, 2022 – 2030,” Apr 2022.
26 IQVIA, “The Global Use of Medicines 2022,” Jan 2022.
27 IQVIA, “Global Trends in R&D,” Feb 2022.
28 Biogen, “Lecanemab Confirmatory Phase 3 Clarity Ad Study Met Primary Endpoint, Showing Highly Statistically Significant Reduction of Clinical Decline In Large Global Clinical Study Of 1,795 Participants With Early Alzheimer’s Disease,” Sep 2022.
29 FBI, “Internet Crime Report 2021”, 2022
30 Cybersecurity Ventures, Nov 2020
31 Jones Day Insights, March 2022
32 European Commission, March 2022
33 Markets and Markets, “Biometric System Market by Authentication Type (Single Factor, Fingerprint, Iris, Face, Voice; Multi-factor), Type (Contact-based, Contactless, Hybrid), Offering Type, Mobility, Vertical & Region (2022-2027),” March 2022.
34 BlackRock, FactSet, as of 10/31/2022. The S&P 500 tech sector is represented by the S&P 500 Information Technology Sector Index. Cybersecurity is represented by the NYSE FactSet Global Cyber Security Index. Past performance does not guarantee future results.
35 Bureau of Labor Statistics, August 2022
36 Atlanta Fed Wage Growth Tracker
37 NY Fed, Global Supply Chain Pressure Index
38 WSJ – U.S. Companies on Pace to Bring Home Record Number of Overseas Jobs, 8/23/22
39 BlackRock, FactSet, trailing twelve-month price-to-earnings ratio as of 10/31/22. Past performance does not guarantee future results.
40 Facts and Factors, RaaS Market by Service Type, 3/14/22
41 Intel.com, Autonomous Mobile Robots and Autonomous Viral Killing Robots
42 Market Research Future, “Global Robotics Market Research Report,” August 2021.
Carefully consider the Funds’ investment objectives, risk factors, and charges and expenses before investing. This and other information can be found in the Funds’ prospectuses or, if available, the summary prospectuses, which may be obtained by visiting the iShares Fund and BlackRock Fund prospectus pages. Read the prospectus carefully before investing.
Investing involves risk, including possible loss of principal.
International investing involves risks, including risks related to foreign currency, limited liquidity, less government regulation and the possibility of substantial volatility due to adverse political, economic or other developments. These risks often are heightened for investments in emerging/ developing markets or in concentrations of single countries.
Funds that concentrate investments in specific industries, sectors, markets or asset classes may underperform or be more volatile than other industries, sectors, markets or asset classes and than the general securities market.
Technologies perceived to displace older technologies or create new markets may not in fact do so. Companies that initially develop a novel technology may not be able to capitalize on the technology.
Companies in the healthcare sector may be affected by government regulations and programs, changes in the cost of medical products and services, changes in the demand for medical products and services among other factors. Healthcare companies are subject to competitive forces that may result in product obsolescence.
Actively managed funds do not seek to replicate the performance of a specified index. Actively managed funds may have higher portfolio turnover than index funds.
This material represents an assessment of the market environment as of the date indicated; is subject to change; and is not intended to be a forecast of future events or a guarantee of future results. This information should not be relied upon by the reader as research or investment advice regarding the funds or any issuer or security in particular.
The strategies discussed are strictly for illustrative and educational purposes and are not a recommendation, offer or solicitation to buy or sell any securities or to adopt any investment strategy. There is no guarantee that any strategies discussed will be effective.
The information presented does not take into consideration commissions, tax implications, or other transactions costs, which may significantly affect the economic consequences of a given strategy or investment decision.
This material contains general information only and does not take into account an individual’s financial circumstances. This information should not be relied upon as a primary basis for an investment decision. Rather, an assessment should be made as to whether the information is appropriate in individual circumstances and consideration should be given to talking to a financial professional before making an investment decision.
The information provided is not intended to be tax advice. Investors should be urged to consult their tax professionals or financial professionals for more information regarding their specific tax situations.
The Funds are distributed by BlackRock Investments, LLC (together with its affiliates, “BlackRock”).
The iShares Funds are not sponsored, endorsed, issued, sold or promoted by Bloomberg, BlackRock Index Services, LLC, Cohen & Steers, European Public Real Estate Association (“EPRA®”), FTSE International Limited (“FTSE”), ICE Data Indices, LLC, NSE Indices Ltd, JPMorgan, JPX Group, London Stock Exchange Group (“LSEG”), MSCI Inc., Markit Indices Limited, Morningstar, Inc., Nasdaq, Inc., National Association of Real Estate Investment Trusts (“NAREIT”), Nikkei, Inc., Russell or S&P Dow Jones Indices LLC or STOXX Ltd. None of these companies make any representation regarding the advisability of investing in the Funds. With the exception of BlackRock Index Services, LLC, which is an affiliate, BlackRock Investments, LLC is not affiliated with the companies listed above.
Neither FTSE, LSEG, nor NAREIT makes any warranty regarding the FTSE Nareit Equity REITS Index, FTSE Nareit All Residential Capped Index or FTSE Nareit All Mortgage Capped Index. Neither FTSE, EPRA, LSEG, nor NAREIT makes any warranty regarding the FTSE EPRA Nareit Developed ex-U.S. Index or FTSE EPRA Nareit Global REITs Index. “FTSE®” is a trademark of London Stock Exchange Group companies and is used by FTSE under license.
© 2022 BlackRock, Inc. All rights reserved. BLACKROCK, BLACKROCK SOLUTIONS, BUILD ON BLACKROCK, ALADDIN, iSHARES, iBONDS, FACTORSELECT, iTHINKING, iSHARES CONNECT, FUND FRENZY, LIFEPATH, SO WHAT DO I DO WITH MY MONEY, INVESTING FOR A NEW WORLD, BUILT FOR THESE TIMES, the iShares Core Graphic, CoRI and the CoRI logo are trademarks of BlackRock, Inc., or its subsidiaries in the United States and elsewhere. All other marks are the property of their respective owners.
iCRMH1122U/S-2570373
This post originally appeared on the iShares Market Insights.
Editor’s Note: The summary bullets for this article were chosen by Seeking Alpha editors.
Be the first to comment