

R&A Studio
This article was published on Dividend Kings on Tuesday, December 27th.
—————————————————————————————
Bear markets are a glorious opportunity to buy the world’s best blue-chips, which allow even regular investors like you to change their lives.
During times like these, the baby gets thrown out with the bathwater, and even great companies can fall off a cliff. Not necessarily for no reason but simply because the market flips from euphoria to despondency.
In 2021 the market focused only on what could go right. In 2022 many stocks are acting as if nothing will ever go right again.
This creates the opportunity for smart long-term value investors to lock in Buffet-like returns and mouth-watering safe yields in great companies like Lincoln National (LNC) and Hasbro (HAS).
Let me show you why these two companies, in particular, represent some of the most ridiculously underpriced 5% to 6% yielding blue-chips on Wall Street. Companies you can safely buy today to have a potentially joyous 2023 and far beyond.
Lincoln National: One Of The Most Beaten Down Insurance Companies On Wall Street
YCharts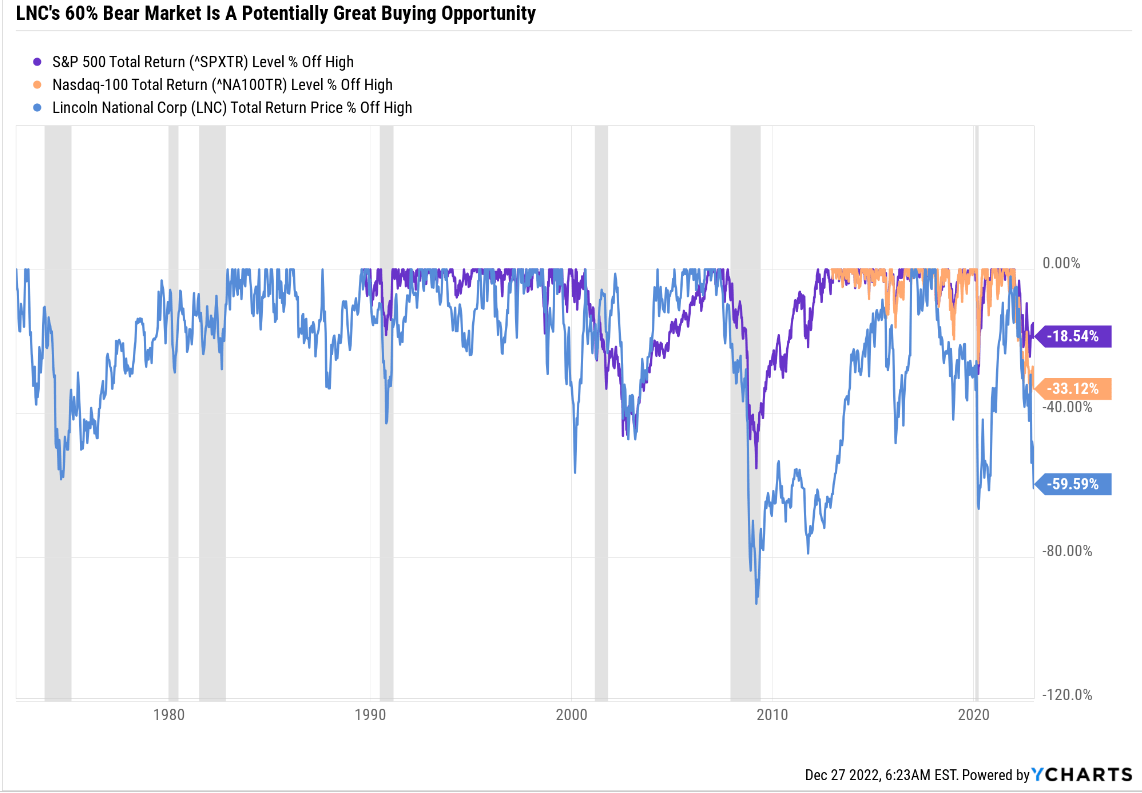
LNC is in a 60% bear market that has sent the yield to a safe and mouth-watering 6%.
LNC Peak Declines Since 1985
Portfolio Visualizer Premium 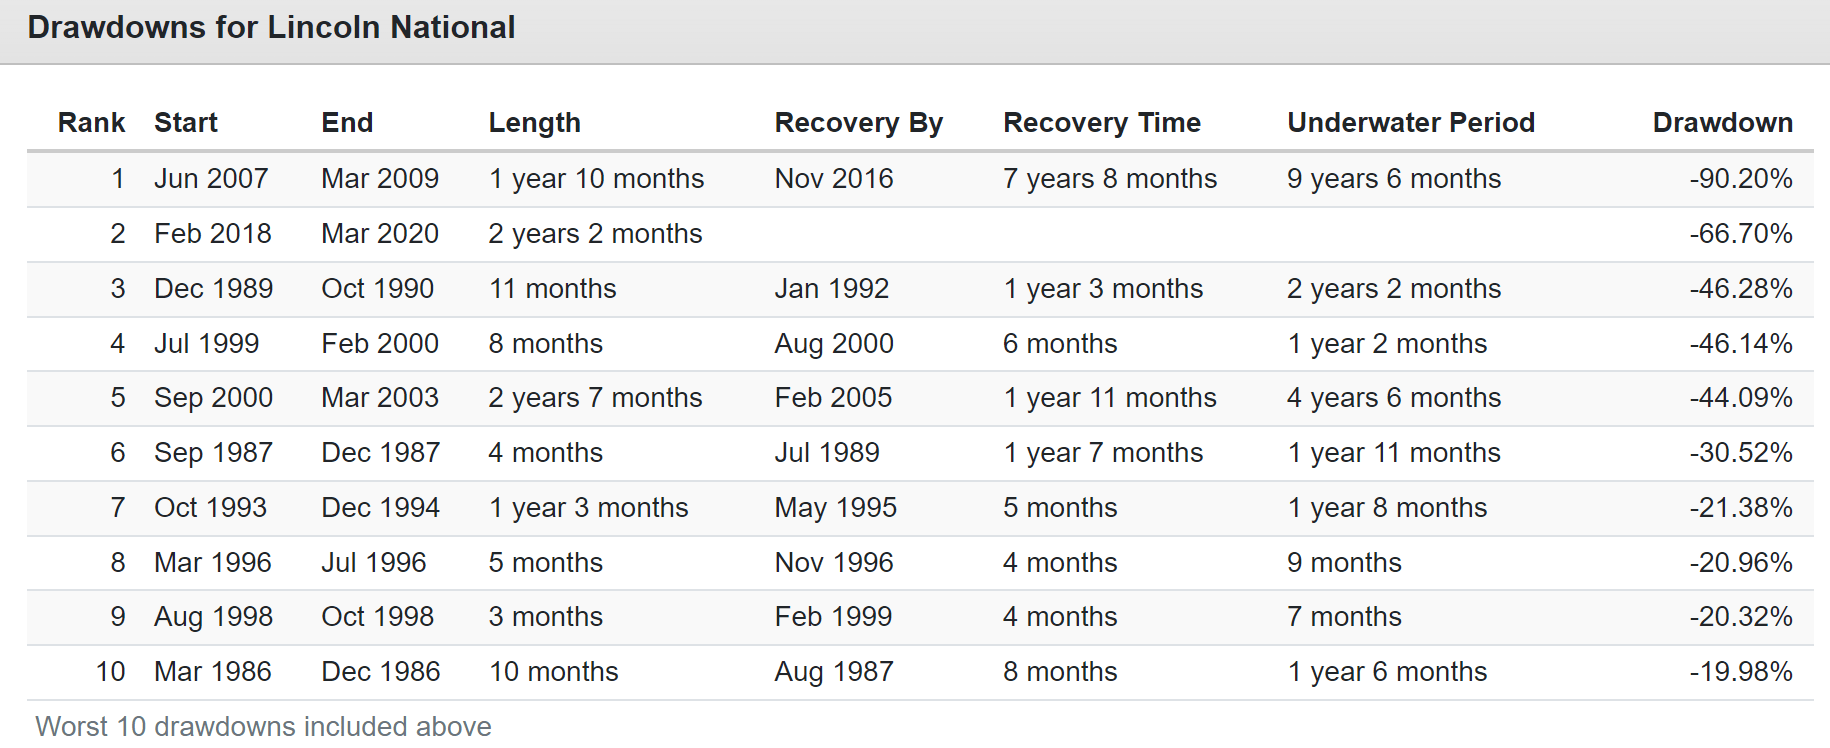
This bear market actually began in the Pandemic and is a 67% decline, the 2nd worst in 37 years, second only to the Great Financial Crisis.
But extreme price collapses, if the fundamentals hold, can give rise to incredible long-term high-yield investment opportunities.
LNC Rolling Returns Since 1985
Portfolio Visualizer Premium 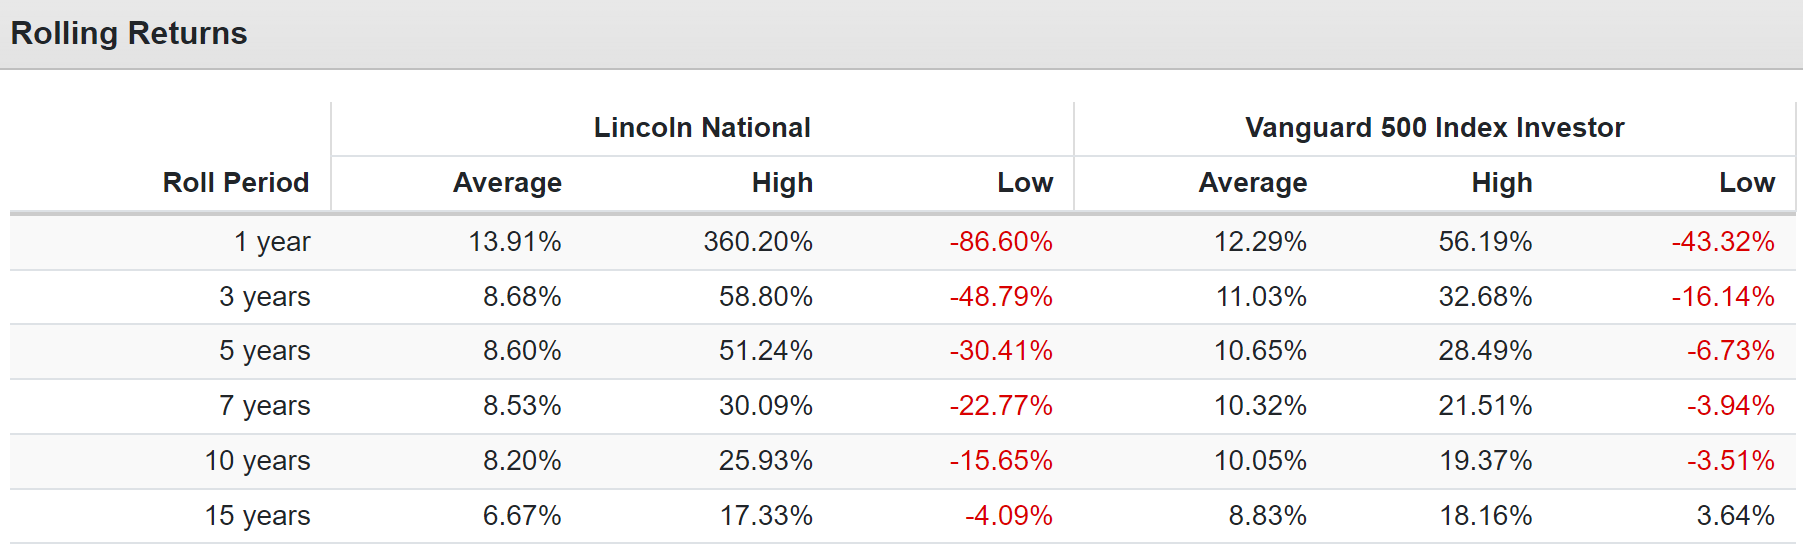
LNC’s safe 6% yield combined with 7.1% long-term growth consensus means investors buying today could reasonably expect about 13.1% long-term returns. That’s similar to the average 12-month rolling return of the last 37 years, which was 13.9%.
But from bear market lows, as we’re in now, LNC is capable of Buffett-like returns such as:
- 12-month return as high as 360%
- three-year annual returns as high as 59% = 4X
- five-year annual returns as high as 51% = 7.9X
- seven-year annual returns as high as 30% = 6.3X
- 10-year annual returns as high as 26% = 10.1X
- 15-year annual returns as high as 17% = 11X
OK, that’s the investment potential for LNC, but what does this company do, and why does Wall Street hate it so much?
Why Wall Street Hates Lincoln National Right Now
Lincoln National is an insurance company founded in 1968 in Radnor, Pennsylvania.
The company’s operating segment includes Annuities, Retirement Plan Services, Life Insurance, and Group Protection. LNC has 16 million customers who use its insurance and financial services.
Investor Presentation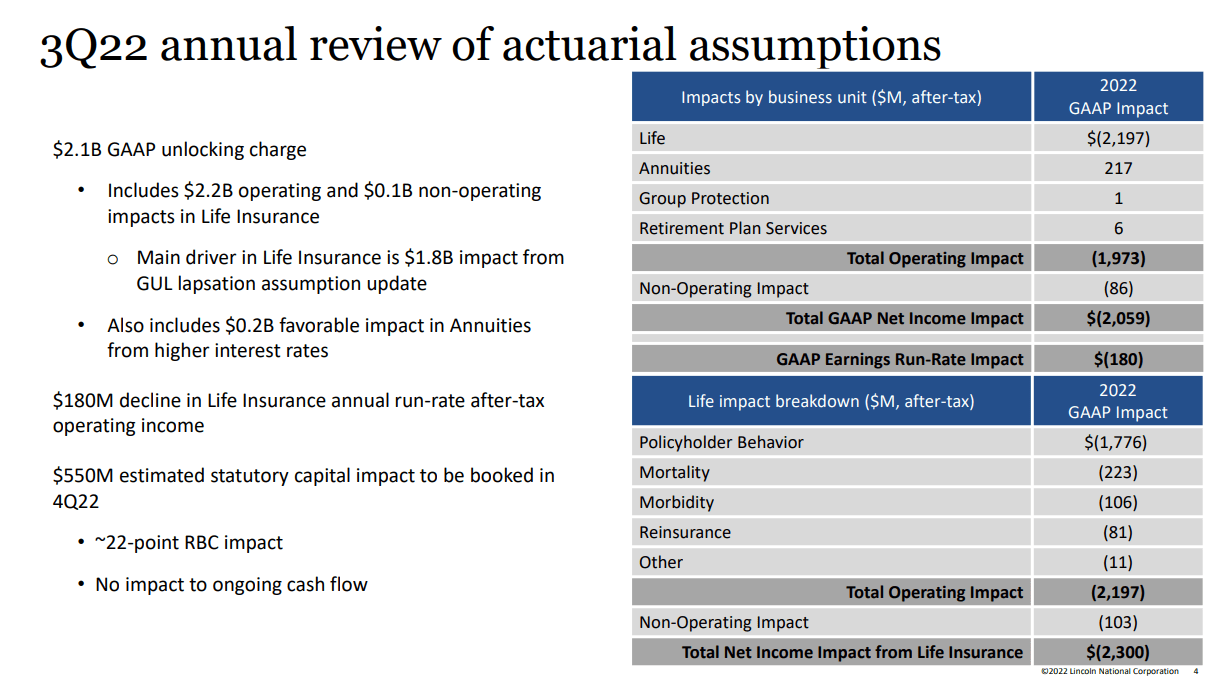
LNC fell off a cliff after management disclosed a $2.2 billion charge based on changes to its actuarial assumptions for its annuities.
The effect on 2022 earnings was catastrophic.
FAST Graphs, FactSet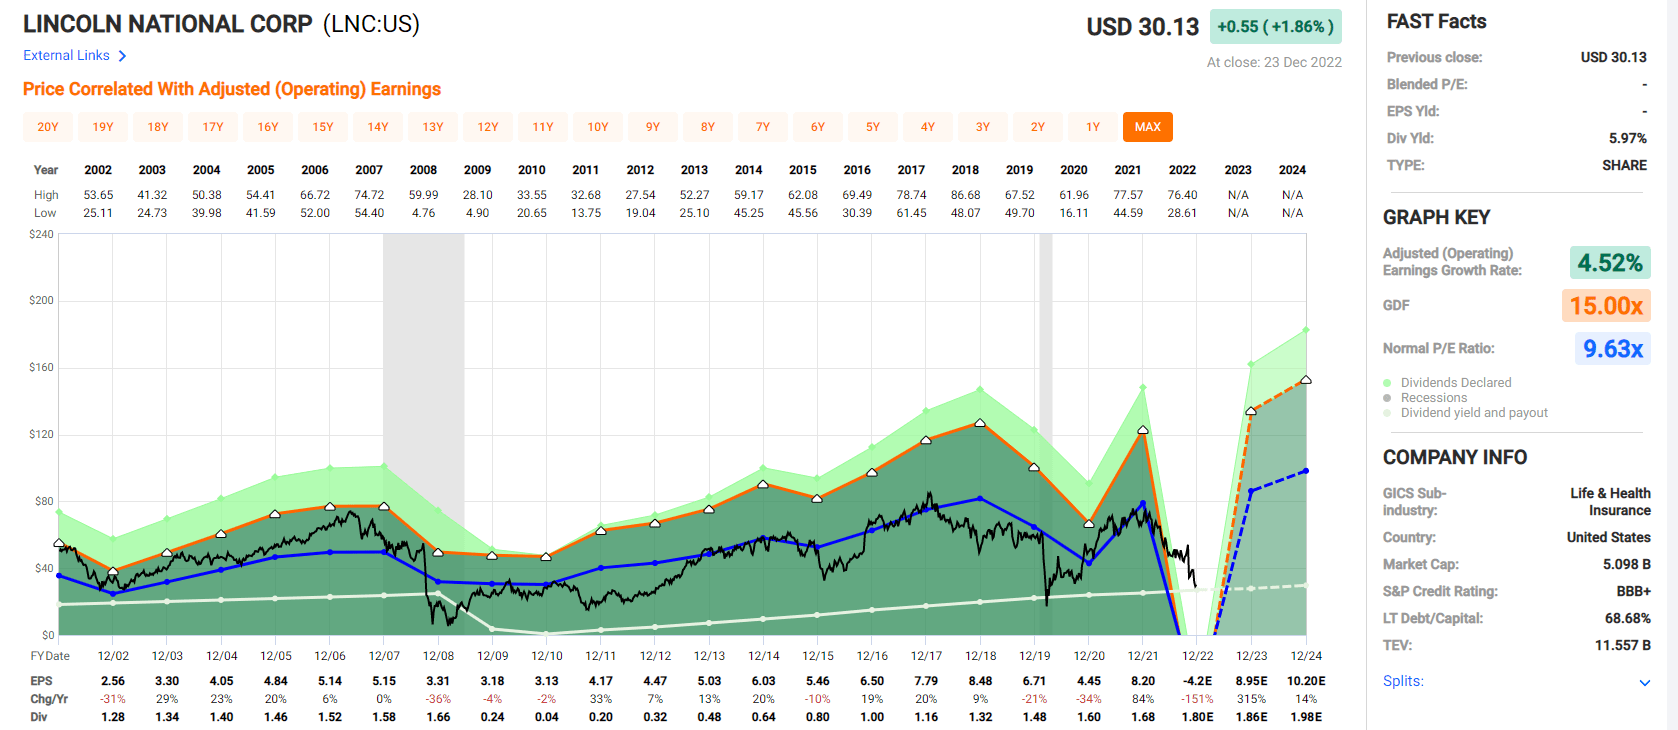
2022 earnings are now expected to fall 151% before recovering 315% in 2023 and another 14% in 2024.
However, management doesn’t expect this to impact long-term cash flow, which is why the dividend is expected to remain safe and keep growing.
- 3% dividend growth in 2023 = 6.4% yield on today’s cost
- 7% dividend growth in 2024 = 6.7% yield on today’s cost
Investor Presentation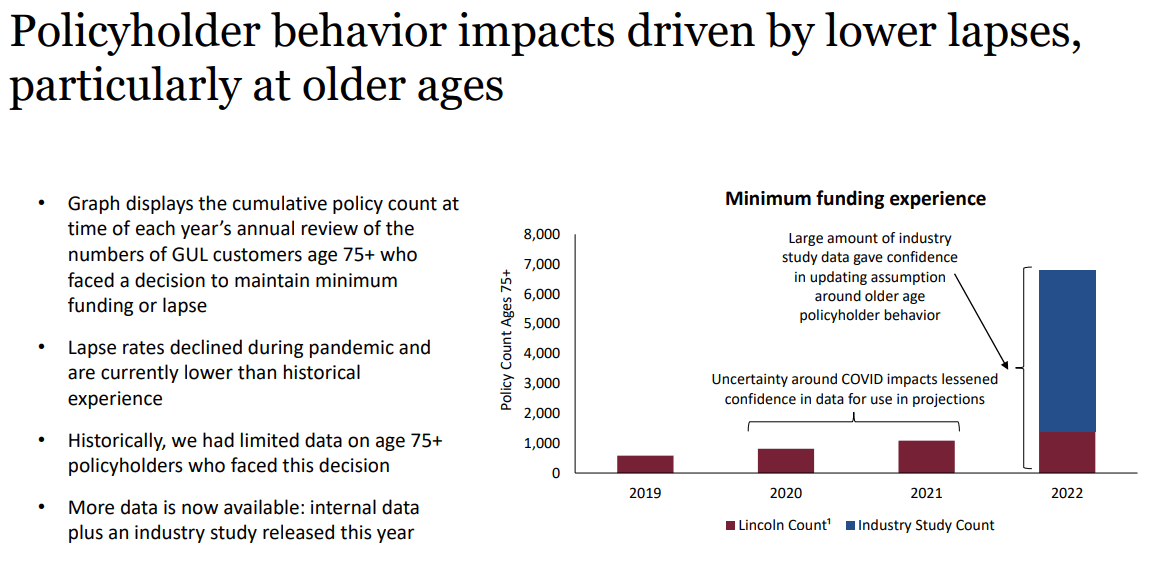
What happened was that as more Pandemic data came in, the company could adjust its models to be more accurate, resulting in them reserving an extra $2.2 billion for future payouts.
How much of a risk to LNC did this $2.2 billion charge represent? It reduced its risk-adjusted capital or RBC ratio by 22%.
Investor Presentation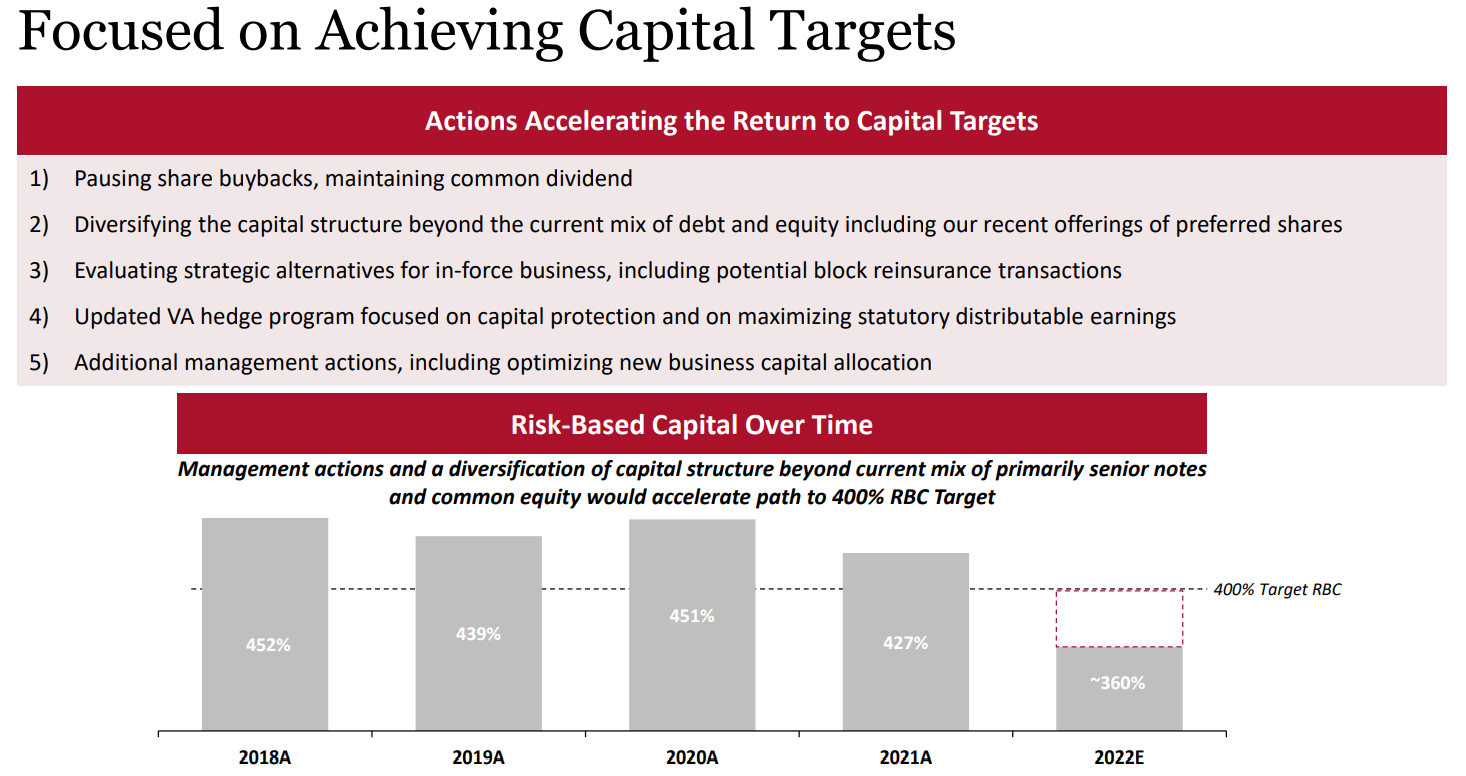
The regulatory minimum for RBC for insurance companies is 200% and LNC’s policy targets 400%, 2X the regulatory minimum. Usually, it surpasses its own highly conservative goals.
Even with the $2.2 billion charge in 2022, management expects its RBC ratio to come in around 360%, far above regulatory minimums.
That’s why its credit ratings remain so strong.
LNC Credit Ratings
| Rating Agency | Credit Rating | 30-Year Default/Bankruptcy Risk | Chance of Losing 100% Of Your Investment 1 In |
| S&P | BBB+ Stable Outlook | 5% | 20.0 |
| Fitch | A- Negative Outlook | 2.50% | 40.0 |
| Moody’s | Baa1 (BBB+ Equivalent) Negative Outlook | 7.50% | 13.3 |
| AM Best | a-stable outlook | 2.50% | 40.0 |
| Consensus | BBB+ Stable Outlook | 4.38% | 22.9 |
(Sources: S&P, Fitch, Moody’s, AM Best)
This is still a BBB+-rated insurance company with an approximate risk of bankruptcy of just 4.4% over the next 30 years.
FactSet Research Terminal 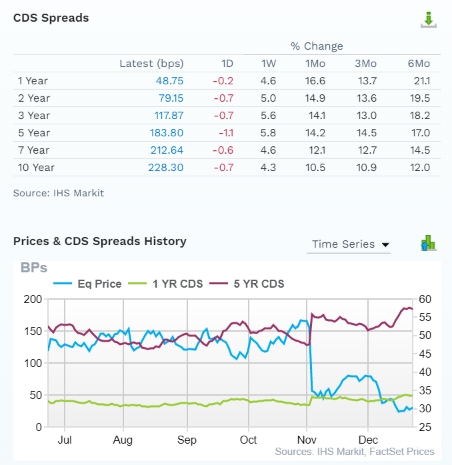
According to bond investors, as seen in insurance policies they take out against potential default (called credit default swaps), LNC’s fundamental risk is up around 12% to 21% over the last six months. But the risk of an actual default (bankruptcy) in the next five years went from 1.3% to 1.8%.
Note how the fundamental risk increased far less than the stock price.
- the bond market says this price collapse was a major overreaction
- so do rating agencies
- so do the 16 analysts that cover it on Wall Street
FactSet Research Terminal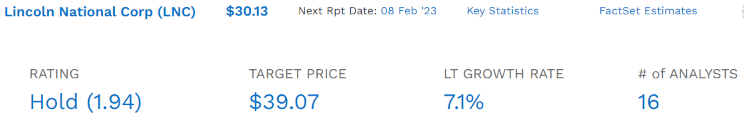
LNC’s long-term growth prospects are still 7%, similar to its long-term historical growth rate.
FAST Graphs, FactSet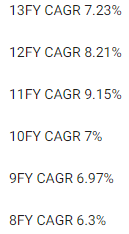
Even when interest rates were at their lowest levels in history, and LNC’s bond portfolio yielded very little, it grew at 6% to 9%.
Now bond yields are expected to remain around 2.5% to 3.5% long-term, and even with the Pandemic creating higher costs on its policies, it’s expected to still grow at 7% long-term.
Long-Term Total Return Consensus
| Investment Strategy | Yield | LT Consensus Growth | LT Consensus Total Return Potential | Long-Term Risk-Adjusted Expected Return |
| Lincoln National | 6.0% | 7.1% | 13.1% | 9.2% |
| Vanguard Dividend Appreciation ETF | 1.9% | 10.2% | 12.1% | 8.5% |
| Nasdaq | 0.8% | 10.9% | 11.7% | 8.2% |
| Schwab US Dividend Equity ETF | 3.4% | 7.6% | 11.0% | 7.7% |
| Dividend Aristocrats | 1.9% | 8.5% | 10.4% | 7.3% |
| S&P 500 | 1.8% | 8.5% | 10.3% | 7.2% |
(Sources: DK Research Terminal, FactSet, Morningstar, YCharts)
That means that LNC offers a safe 6% yield today and the potential for superior returns to almost any popular investment strategy on Wall Street.
Reasons To Potentially Buy Lincoln National Today
| Metric | Lincoln National |
| Quality | 87% 12/13 Super SWAN Quality Insurance Company |
| Risk Rating | Low Risk |
| DK Master List Quality Ranking (Out Of 500 Companies) | 195 |
| DK Master List Quality Percentile | 61% |
| Dividend Growth Streak (Years) | 12 |
| Dividend Yield | 6.0% |
| Dividend Safety Score | 90% |
| Average Recession Dividend Cut Risk | 0.5% |
| Severe Recession Dividend Cut Risk | 1.50% |
| S&P Credit Rating |
BBB+ Stable Outlook |
| 30-Year Bankruptcy Risk | 5.00% |
| LT S&P Risk-Management Global Percentile |
72% Good, Low Risk |
| Fair Value | $76.54 |
| Current Price | $30.13 |
| Discount To Fair Value | 61% |
| DK Rating |
Potential Ultra Value Buy |
| P/E | 3.3 |
| Growth Priced In | -10.4% |
| Historical P/E | 8.5 to 9.5 |
| LT Growth Consensus/Management Guidance | 7.1% |
| 5-year consensus total return potential |
24% to 33% CAGR |
| Base Case 5-year consensus return potential |
29% CAGR (7X S&P 500) |
| Consensus 12-month total return forecast | 37% |
| Fundamentally Justified 12-Month Return Potential | 160% |
| LT Consensus Total Return Potential | 13.1% |
| Inflation-Adjusted Consensus LT Return Potential | 10.8% |
(Source: Dividend Kings Zen Research Terminal)
LNC is trading at 3.3X 2023’s consensus earnings, meaning it’s an anti-bubble blue-chip priced for -10.4% growth.
For a company that’s historically grown and is still expected to grow at 7.1% long-term.
LNC is 61% historically undervalued, compared to its historical 9X P/E since the Financial Crisis. That means an upside to fair value of 160%.
Lincoln National 2024 Consensus Return Potential
(Source: FAST Graphs, FactSet)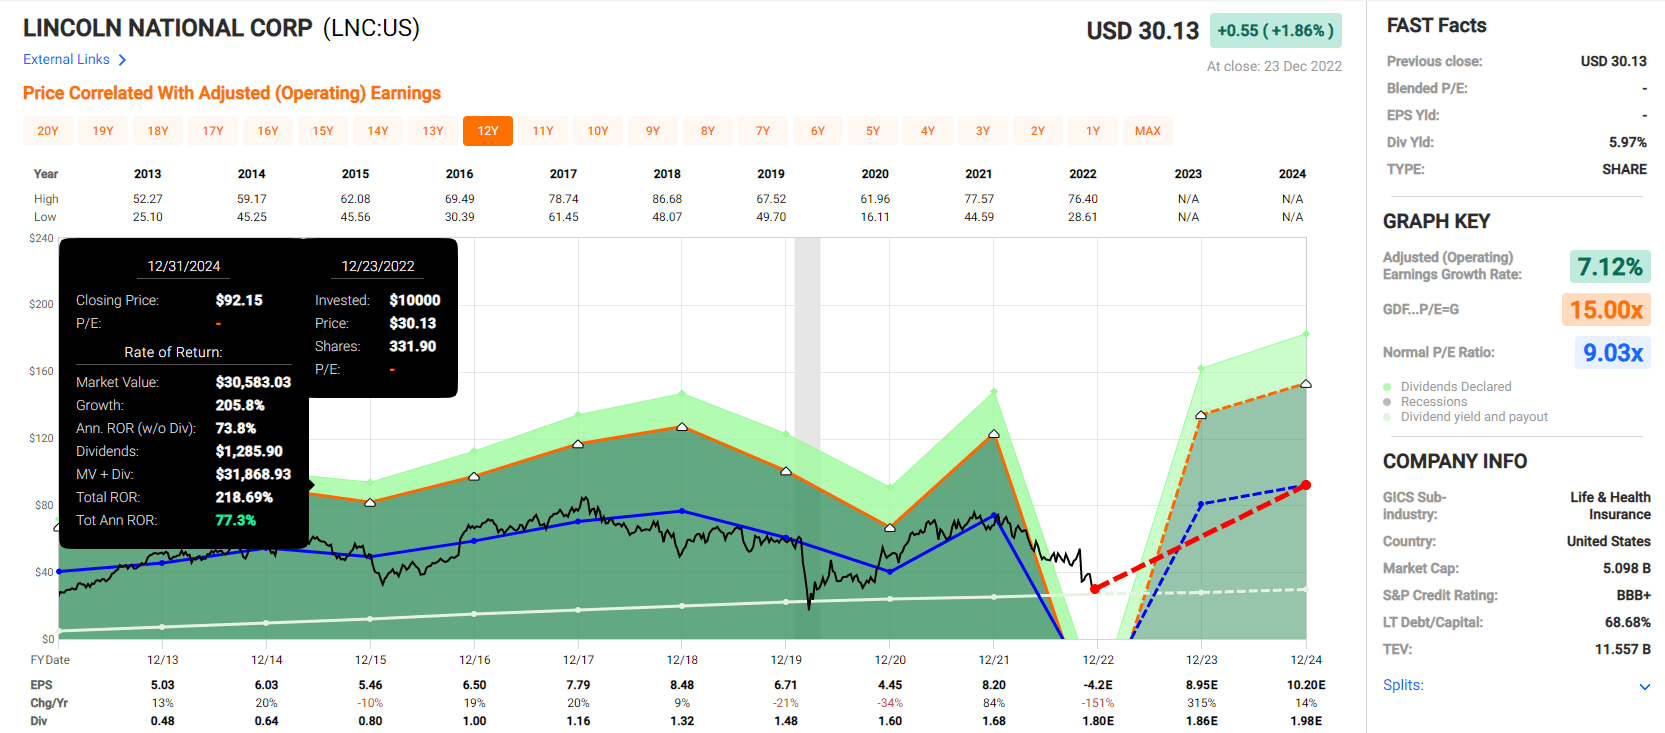
What do you get with a 3.3X earnings 61% undervalued Super SWAN? The potential for 218% total returns within two years, a more than triple.
- 77% annual return potential through 2024
- 10X more than the S&P 500
Lincoln National 2028 Consensus Return Potential
(Source: FAST Graphs, FactSet)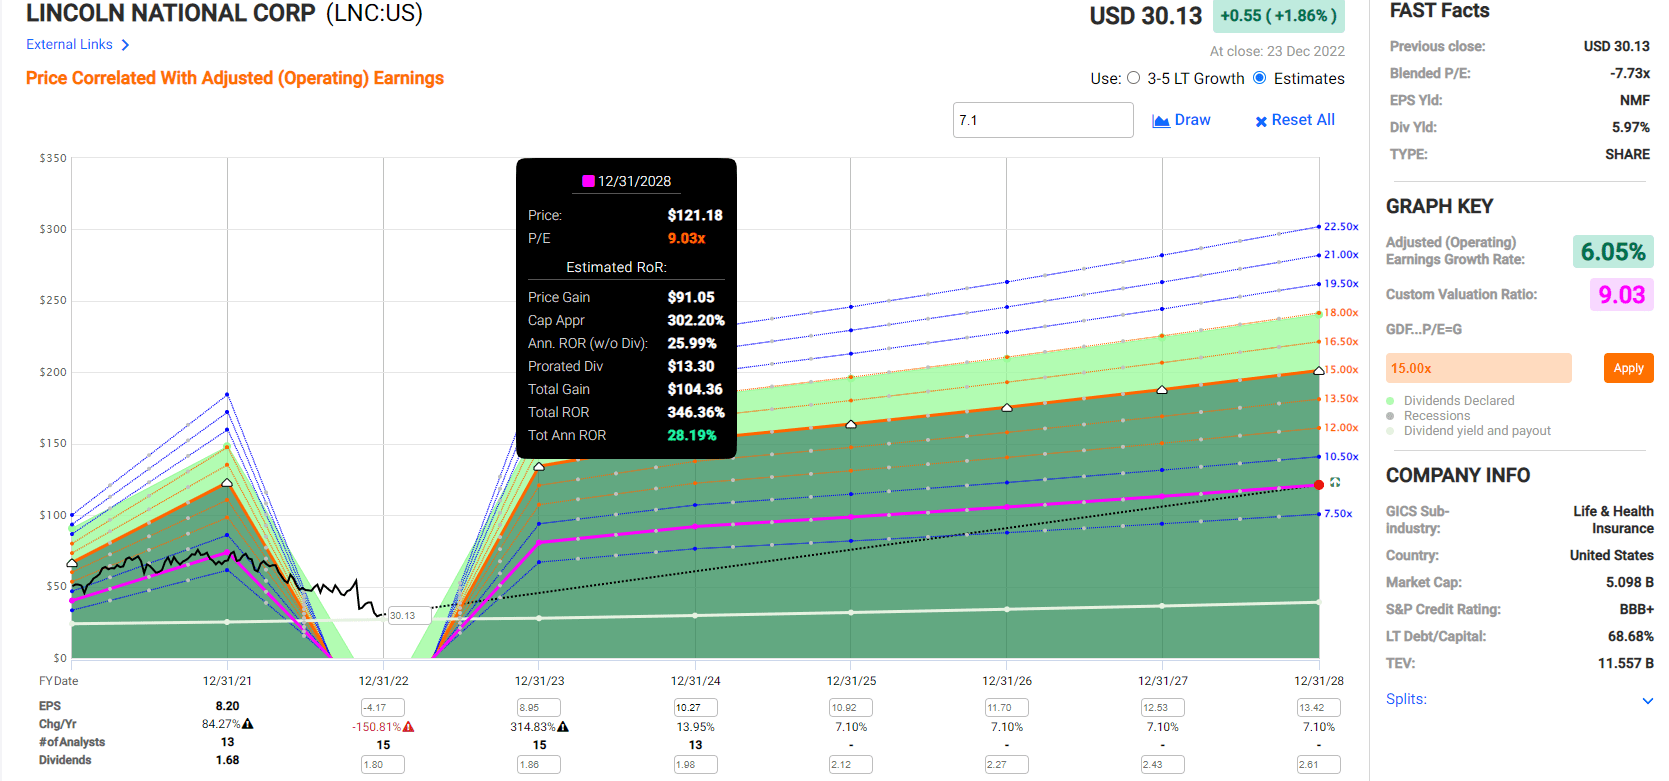
It means the potential for 350% total returns over five years or 28% annually.
- 7X more than the S&P 500
- an 8.7% yield on today’s cost
Lincoln National Investment Decision Score
Dividend Kings Automated Investment Decision Score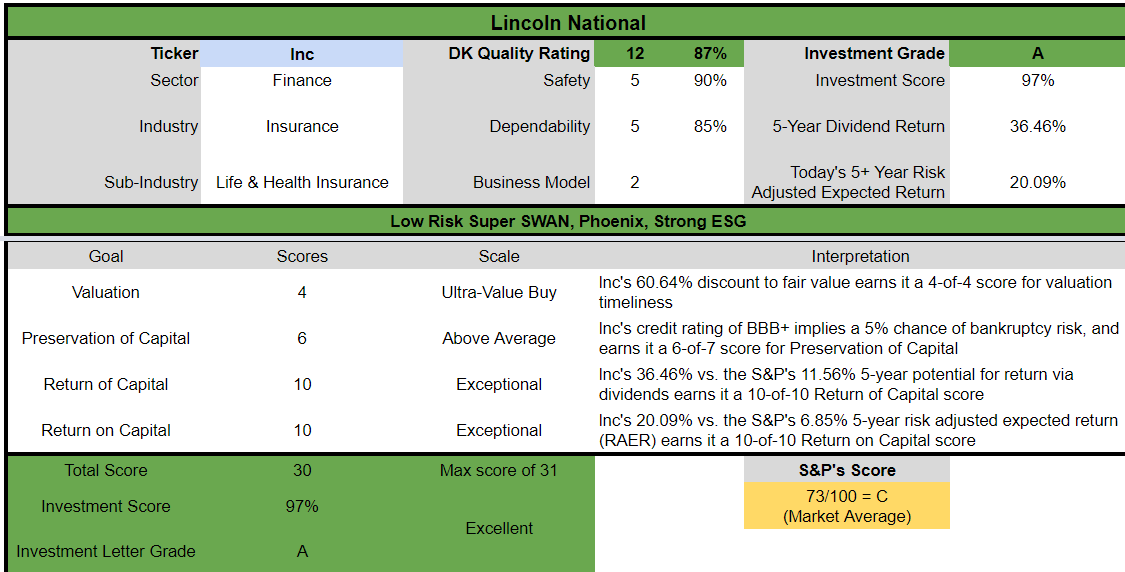
LNC is a potentially excellent deep value, high-yield opportunity for anyone comfortable with its risk profile. Look at how it compares to the S&P 500.
- 61% discount to fair value vs. 1% discount S&P = 60% better valuation
- 6.0% safe yield vs. 1.8% (3.5X higher and safer)
- approximately 13.1% long-term annual return potential vs. 10.2% CAGR S&P
- about 3X higher risk-adjusted expected returns
- 3X higher income potential over five years
Hasbro: The Best Valuation In A Decade Makes It A Potential Table-Pounding Buy
YCharts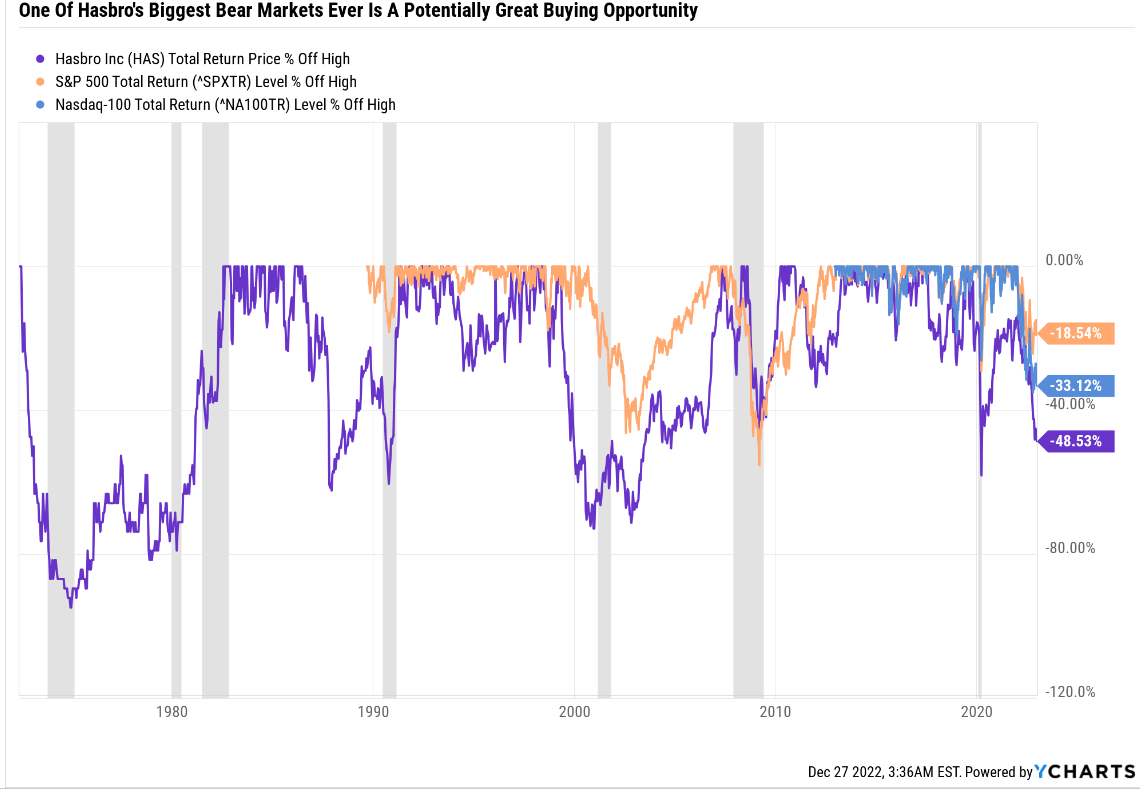
The reason I’m recommending HAS today is that it’s currently experiencing one of its worst bear markets ever.
Portfolio Visualizer Premium 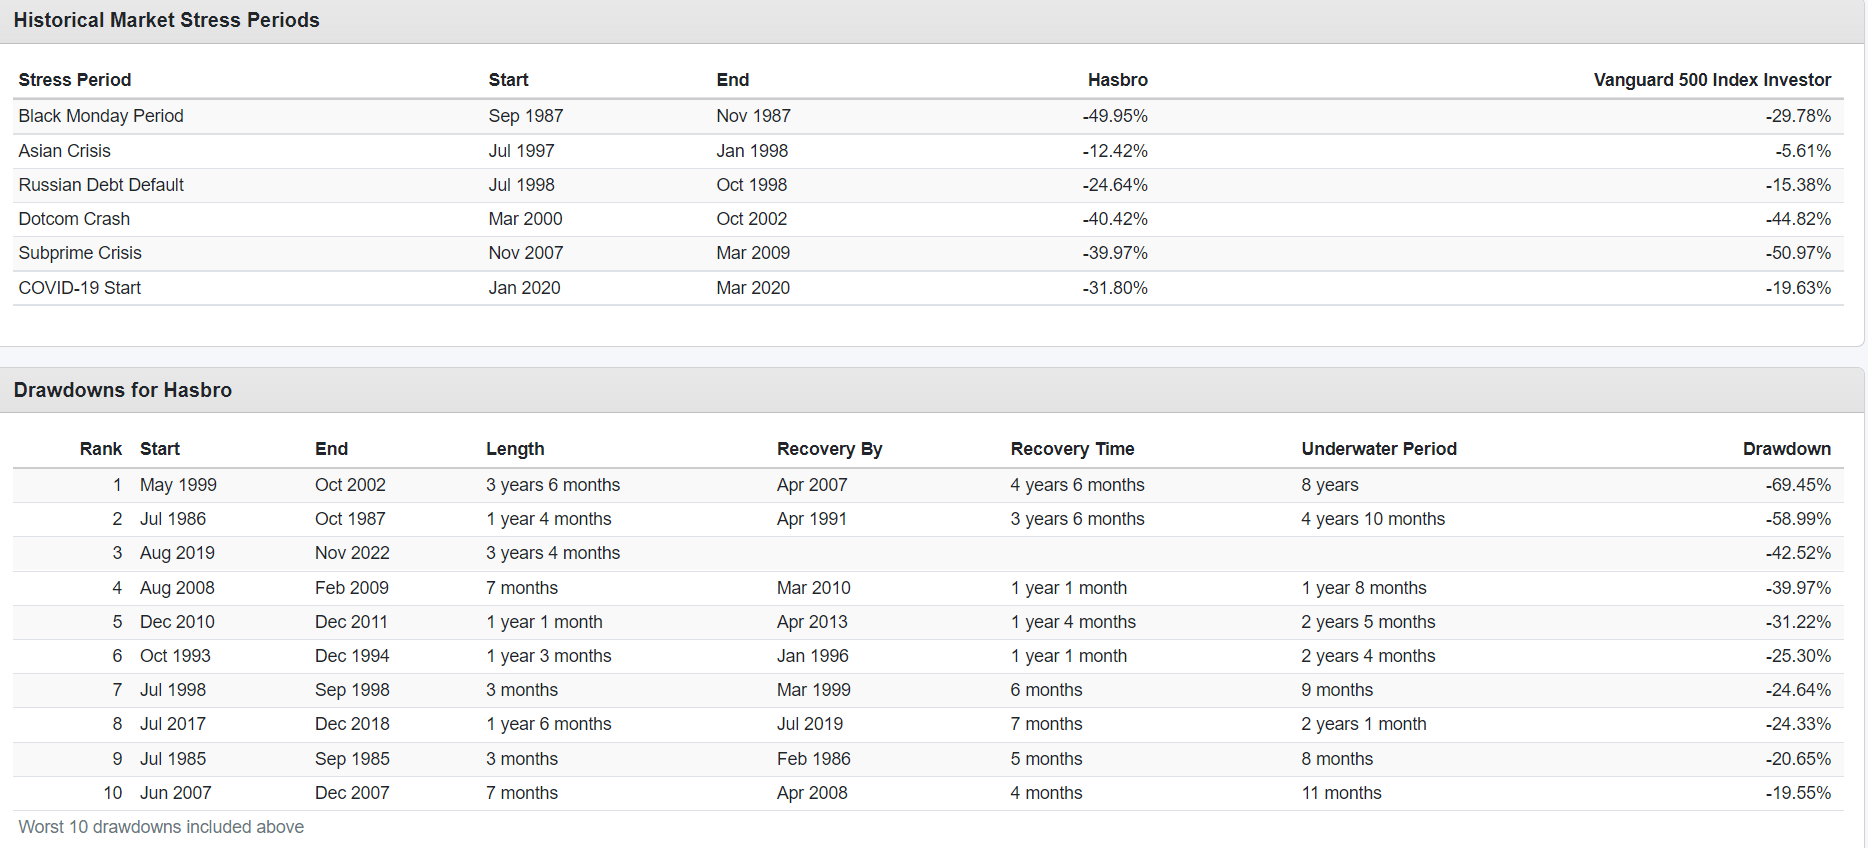
In fact, the current bear market is worse than the Great Recession crash, and you have to go back to the Tech crash’s 70% decline to find a better bargain-hunting opportunity in Hasbro.
How attractive is Hasbro’s current valuation?
Hasbro Is Trading At Its Best Valuation In 10 Years (Outside Of The Pandemic Low)
FAST Graphs, FactSet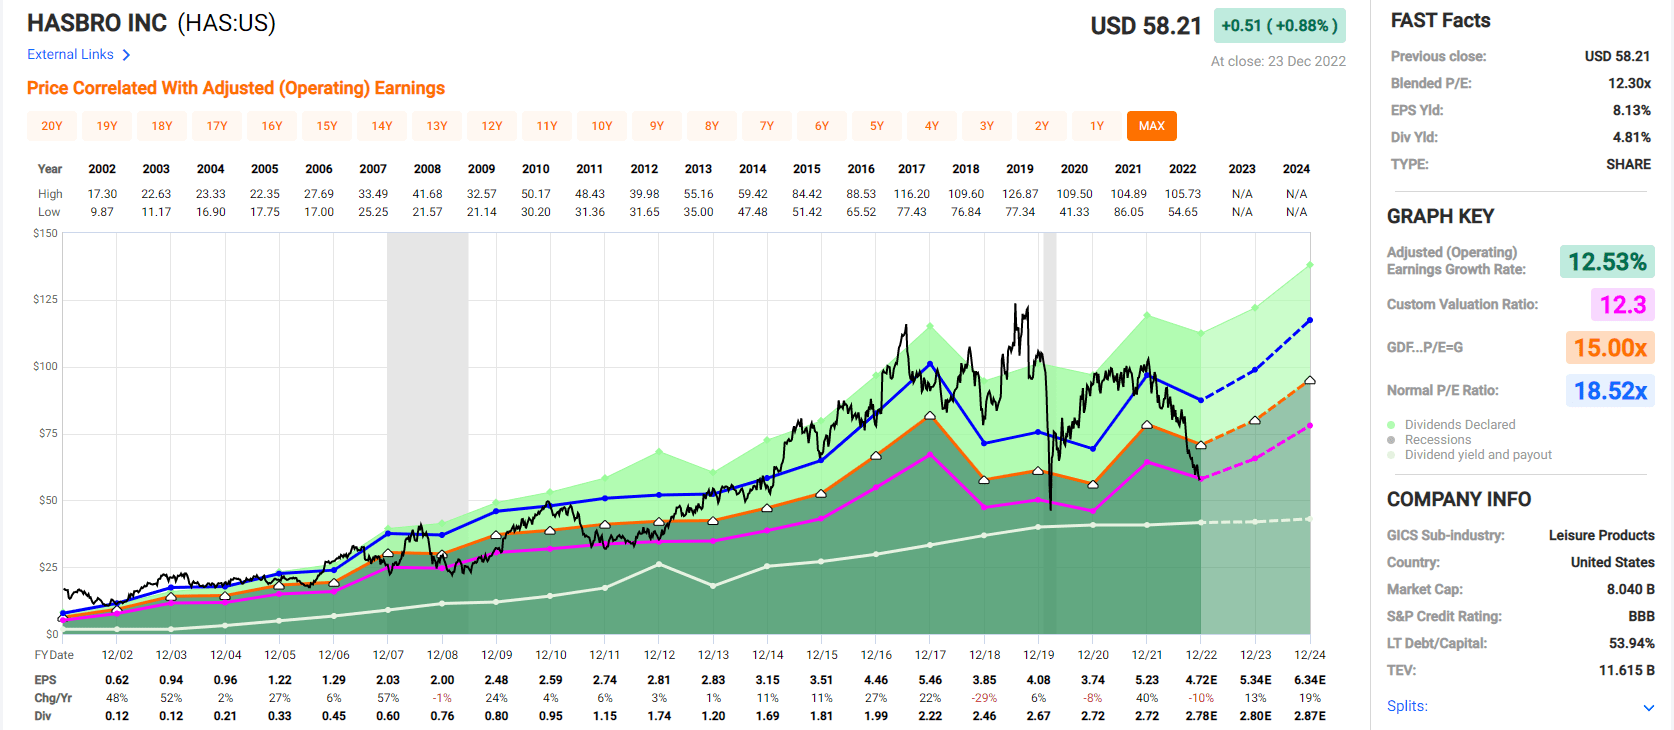
Outside of the Pandemic low, during which HAS bottomed at almost exactly today’s P/E, you have to go back to 2012 to find a valuation as attractive for this company.
Hasbro Rolling Returns Since 1985
Portfolio Visualizer Premium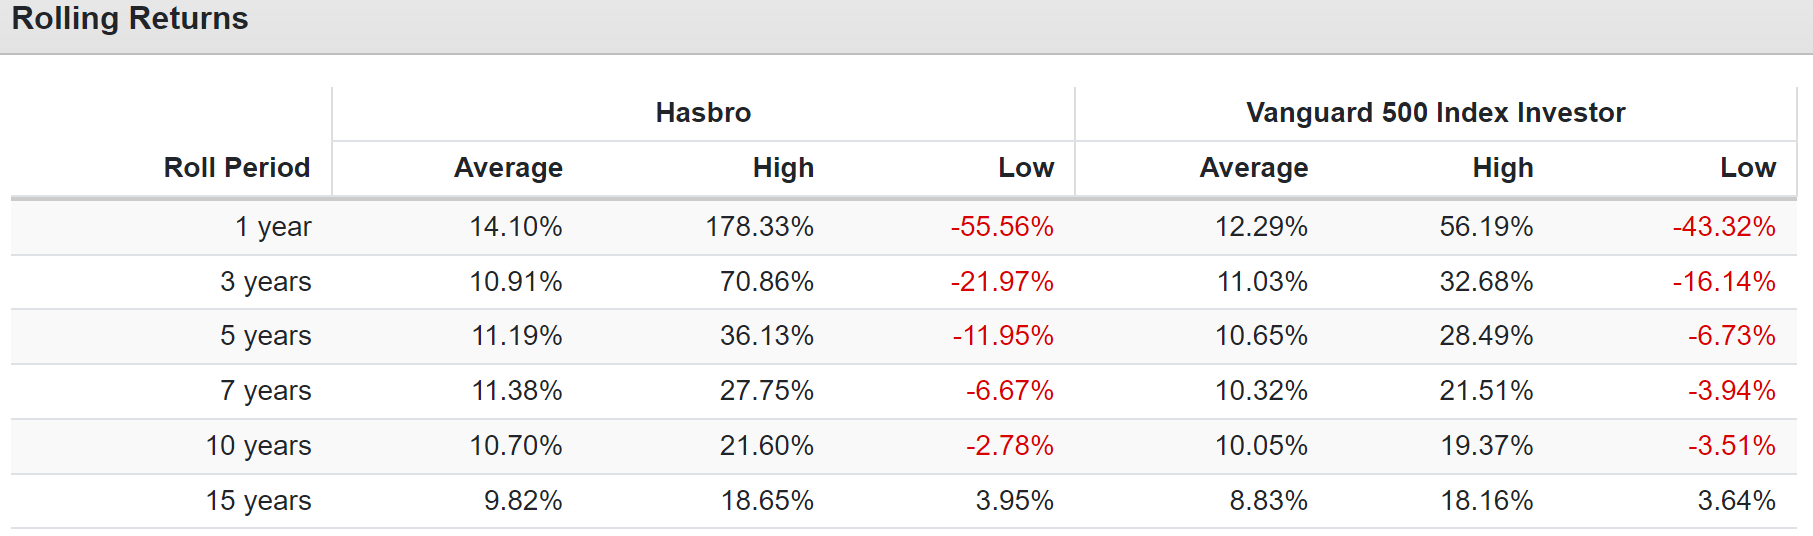
Today’s 4.8% yield + 8.3% consensus long-term growth rate means HAS is expected to potentially deliver 13.1% long-term returns. That’s similar to its average 12-month rolling return over the last 37 years of 14.1%.
But from bear market lows, it’s capable of truly outstanding Buffett-like returns. How impressive? Up to:
- 178% in one year
- 71% annually over three years = 5X
- 36% annually over five years = 4.7X
- 28% annually over seven years = 5.6X
- 22% annually over ten years = 7.1X
- 19% annually over 15 years = 13.6X
Ok, so HAS’s valuation is historically low, and its yield is very attractive, and its return potential is par with some of the greatest investors in history. But that’s assuming the company’s fundamentals haven’t fallen off a cliff.
Stocks don’t fall 50% for no reason.
Why Wall Street Hates Hasbro Right Now
Magic The Gathering represents 15% of sales and 35% of cash flow for HAS, and during the Pandemic, it experienced a major boom thanks to people being locked at home.
The company appears to have overtaxed the popularity of its #1 brand, by overproducing cards, resulting in falling prices on the secondary market.
Combine that with a general concern about potentially weak holiday sales due to the coming recession, and you can understand why Wall Street has become bearish on this company.
On top of all this, Hasbro is attempting to sell its TV and film business, Entertainment One, during a recessionary bear market to help it pay down debt and get back to its long-term debt/EBITDA target of around 2.3.
This creates the sense among many investors that HAS might be desperate and is becoming a forced seller at potentially the worst possible time.
While there are positives to a potential sale of Entertainment One, there are also potential negatives. Like an increased concentration and reliance on Magic The Gathering, which could see its sales rise to approximately 33% of HAS’s total revenue, approximately 2X what it is now.
- Around 40% of cash flow could come from Magic The Gathering after such a sale.
Q3’s big miss in terms of earnings showed a 15% decline in revenue, 12% when adjusted for currency effects.
So basically, HAS is facing a rough patch, and short-term pessimism is at 10-year highs.
Why The Current Crash Is Likely An Overreaction
First, let’s take a look at the biggest short-term risk to Hasbro, which could most directly cause investors to lose money.
FactSet Research Terminal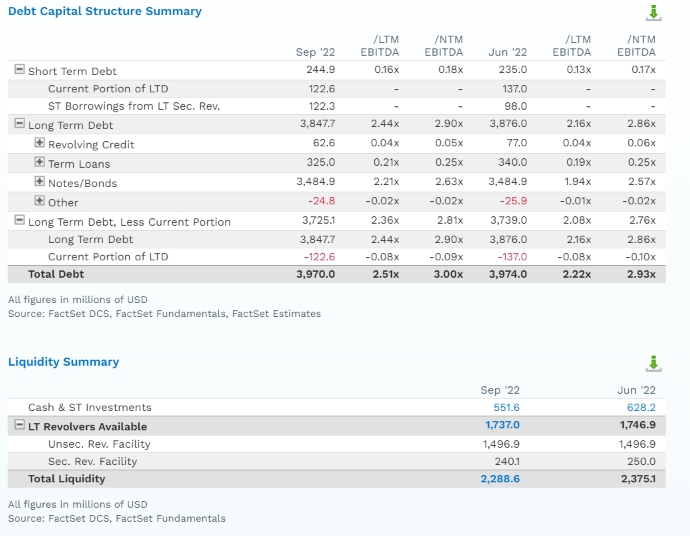
HAS’s leverage ratio is expected to rise to 3.0 in 2023, but that’s the high end of safe, according to rating agencies for this industry.
The company has $2.3 billion in liquidity right now, and it has no debt maturing until after the 2023 recession is expected to end.
FactSet Research Terminal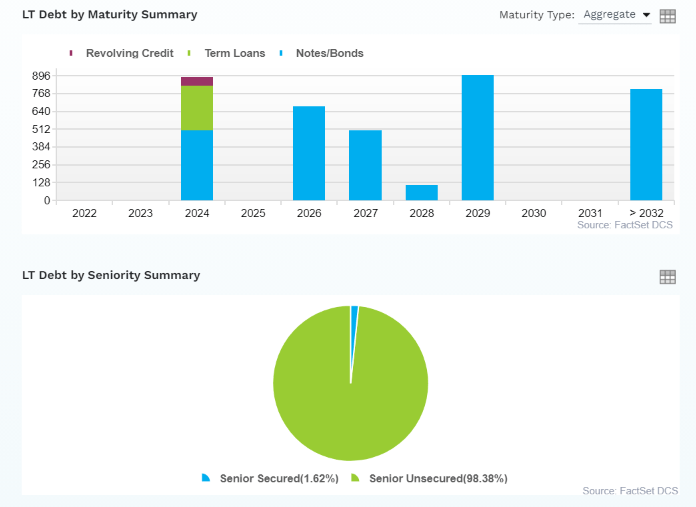
98.4% of its debt is unsecured, giving it lots of financial flexibility.
Hasbro Credit Rating
| Rating Agency | Credit Rating | 30-Year Default/Bankruptcy Risk | Chance of Losing 100% Of Your Investment 1 In |
| S&P | BBB Stable Outlook | 7.50% | 13.3 |
| Fitch | BBB- Stable Outlook | 11.00% | 9.1 |
| Moody’s | Baa2 (BBB Equivalent) Stable Outlook | 7.50% | 13.3 |
| Consensus | BBB Stable Outlook | 8.67% | 11.5 |
(Sources: S&P, Fitch, Moody’s)
This is why rating agencies still give it a solid BBB- or BBB stable credit rating, indicating a 1 in 12 chance that shareholders will get wiped out in the next 30 years.
FactSet Research Terminal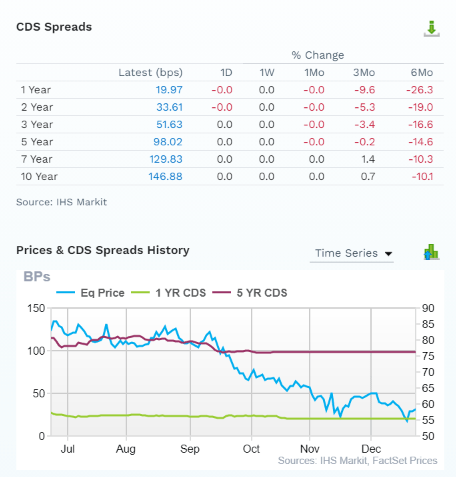
The bond market, the “smart money” on Wall Street, is not at all concerned about the tanking stock price. You can see that from the stability of the company’s credit default swaps, insurance policies investors take out against potential default.
Hasbro’s Plans for A More Profitable Future
Hasbro’s plans call for streamlining the business and focusing on its strongest core businesses and brands.
Its top three priorities include:
- invest in growing its core brands
- de-leverage the balance sheet
- increase cash return to shareholders by 50% over the next three years
Analysts expect that by 2024 HAS’s debt/EBITDA ratio will return to management’s long-term goal of 2.25 to 2.5.
- 2.35 leverage consensus in 2024
2022 Investor Presentation 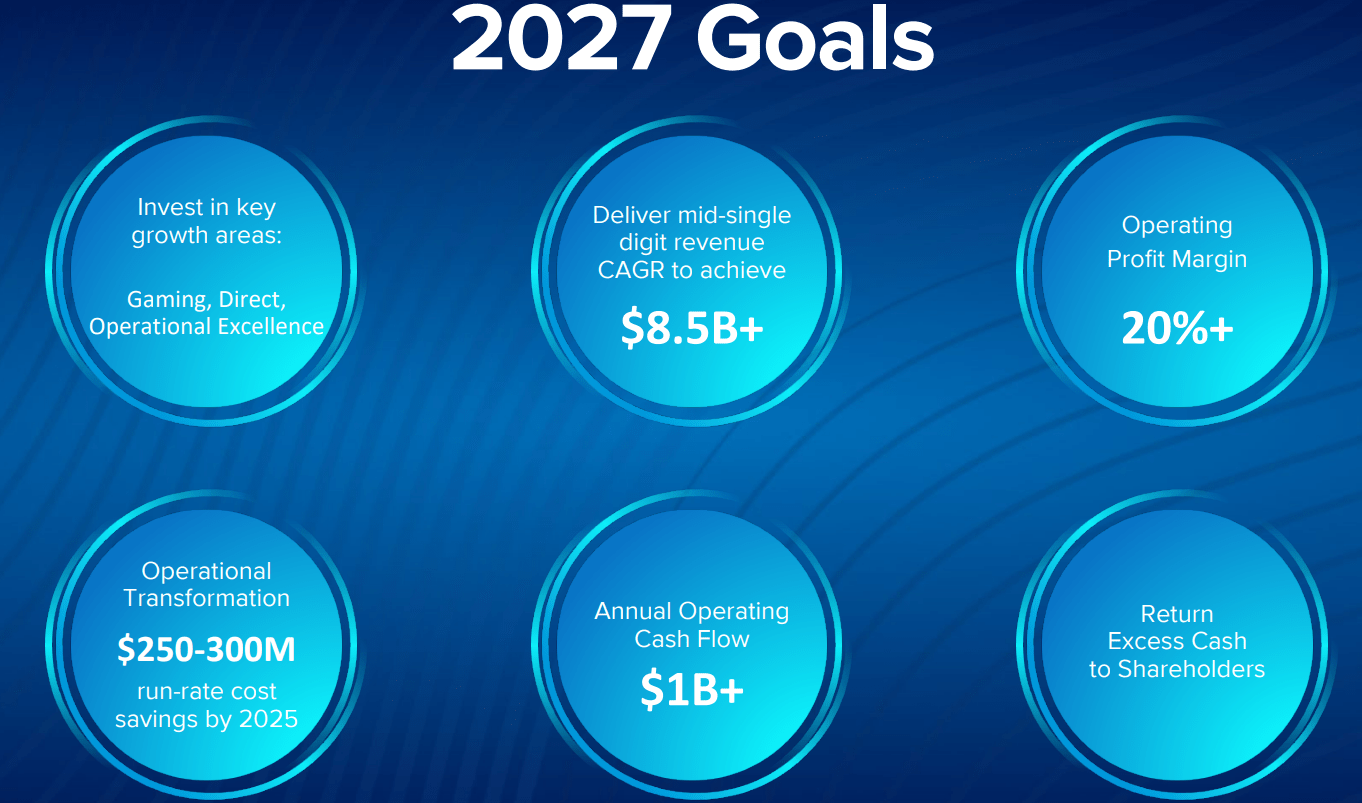
Management aims to grow sales by $2.5 billion or 33% by 2027, representing 6.7% annual sales growth.
The streamlined business is expected to boost operating margins by 4% or 25% compared to 2022 levels.
To achieve that, management has located an estimated $275 million in annual cost savings it thinks can be in place by 2025.
For context, HAS’s 2022 operating profit is just under $1 billion, meaning that management has a three-year plan to cut costs by 30%.
That’s why it thinks it can drive operating cash flow from $637 million in 2022 to over $1 billion over the next five years.
- 57% growth in operating cash flow
- 9.4% annual operating cash flow growth
At 8.9X cash-adjusted earnings, HAS is priced for 0.8% long-term growth. Here’s what analysts actually expect.
| Metric | 2022 Growth Consensus | 2023 Growth Consensus | 2024 Growth Consensus | 2025 Growth Consensus | 2026 Growth Consensus |
2027 Growth Consensus |
| Sales | -4% | 3% | 5% | 9% | 8% | 10% |
| Dividend | 3% | 1% | 2% | NA | NA | NA |
| EPS | -10% | 13% | 19% | 19% | 8% | 14% |
| Free Cash Flow | -36% | 62% | 16% | NA | NA | NA |
| EBITDA | -31% | 6% | 6% | NA | NA | NA |
| EBIT | 12% | 10% | 8% | NA | NA | NA |
(Source: FAST Graphs, FactSet)
This is not the medium-term growth consensus for a dying company or value trap.
Long-Term Growth Outlook
Yahoo Finance, Reuters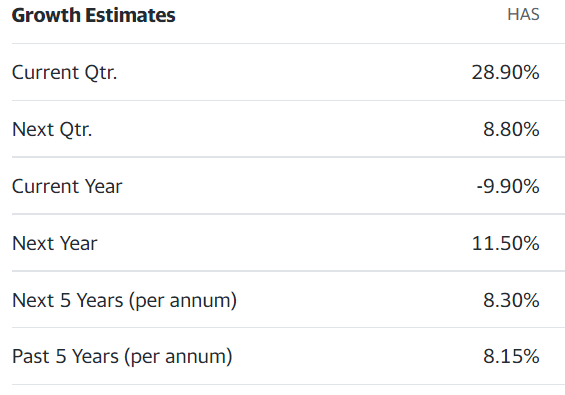
Over the past five years, HAS has grown earnings at 8.2% per year, and that’s pretty much what 11 out of 15 analysts expect in the future.
Reasons To Potentially Buy Hasbro Today
| Metric | Hasbro |
| Quality | 93% 12/13 Super SWAN Quality Toy Maker |
| Risk Rating | Low Risk |
| DK Master List Quality Ranking (Out Of 500 Companies) | 104 |
| DK Master List Quality Percentile | 79% |
| Dividend Growth Streak (Years) | 1 |
| Dividend Yield | 4.80% |
| Dividend Safety Score | 78% |
| Average Recession Dividend Cut Risk | 1.0% |
| Severe Recession Dividend Cut Risk | 2.30% |
| S&P Credit Rating |
BBB Stable Outlook |
| 30-Year Bankruptcy Risk | 7.50% |
| LT S&P Risk-Management Global Percentile |
67% Above-Average, Low Risk |
| Fair Value | $97.87 |
| Current Price | $58.21 |
| Discount To Fair Value | 41% |
| DK Rating |
Potential Ultra Value Buy |
| P/E | 11.0 |
| Cash-Adjusted P/E | 8.9 |
| Growth Priced In | 0.8% |
| Historical P/E | 17.5 to 20 |
| LT Growth Consensus/Management Guidance | 8.3% |
| PEG Ratio | 1.07 |
| 5-year consensus total return potential |
21% to 25% CAGR |
| Base Case 5-year consensus return potential |
23% CAGR (6X S&P 500) |
| Consensus 12-month total return forecast | 53% |
| Fundamentally Justified 12-Month Return Potential | 73% |
| LT Consensus Total Return Potential | 13.1% |
| Inflation-Adjusted Consensus LT Return Potential | 10.8% |
(Source: Dividend Kings Zen Research Terminal)
Hasbro is trading at just 8.9X cash-adjusted earnings compared to 11.3X for private equity deals in 2022.
- a bargain by private equity standards
It’s 41% historically undervalued, and analysts expect a 53% gain within 12 months. That’s more than justified by its current fundamentals, which have a 73% upside to fair value.
Hasbro 2024 Consensus Return Potential
(Source: FAST Graphs, FactSet)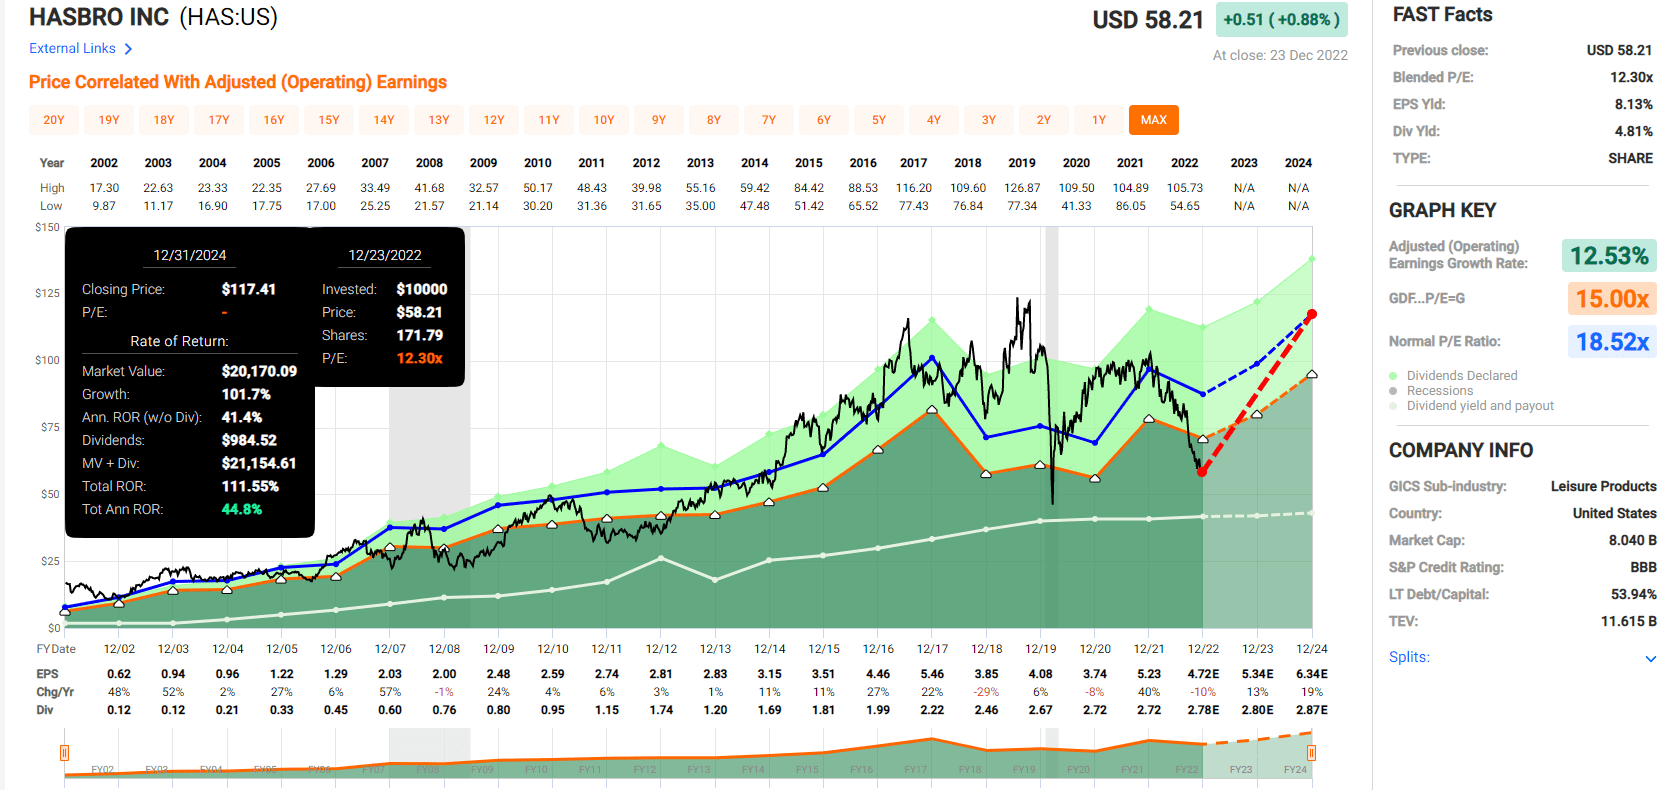
If Hasbro grows as expected and returns to historical market-determined fair value by 2024, it could deliver 112% total returns or 45% annually.
- 6X more than the S&P 500 consensus
- and with a safe 4.8% yield on day one
Hasbro 2028 Consensus Return Potential
(Source: FAST Graphs, FactSet)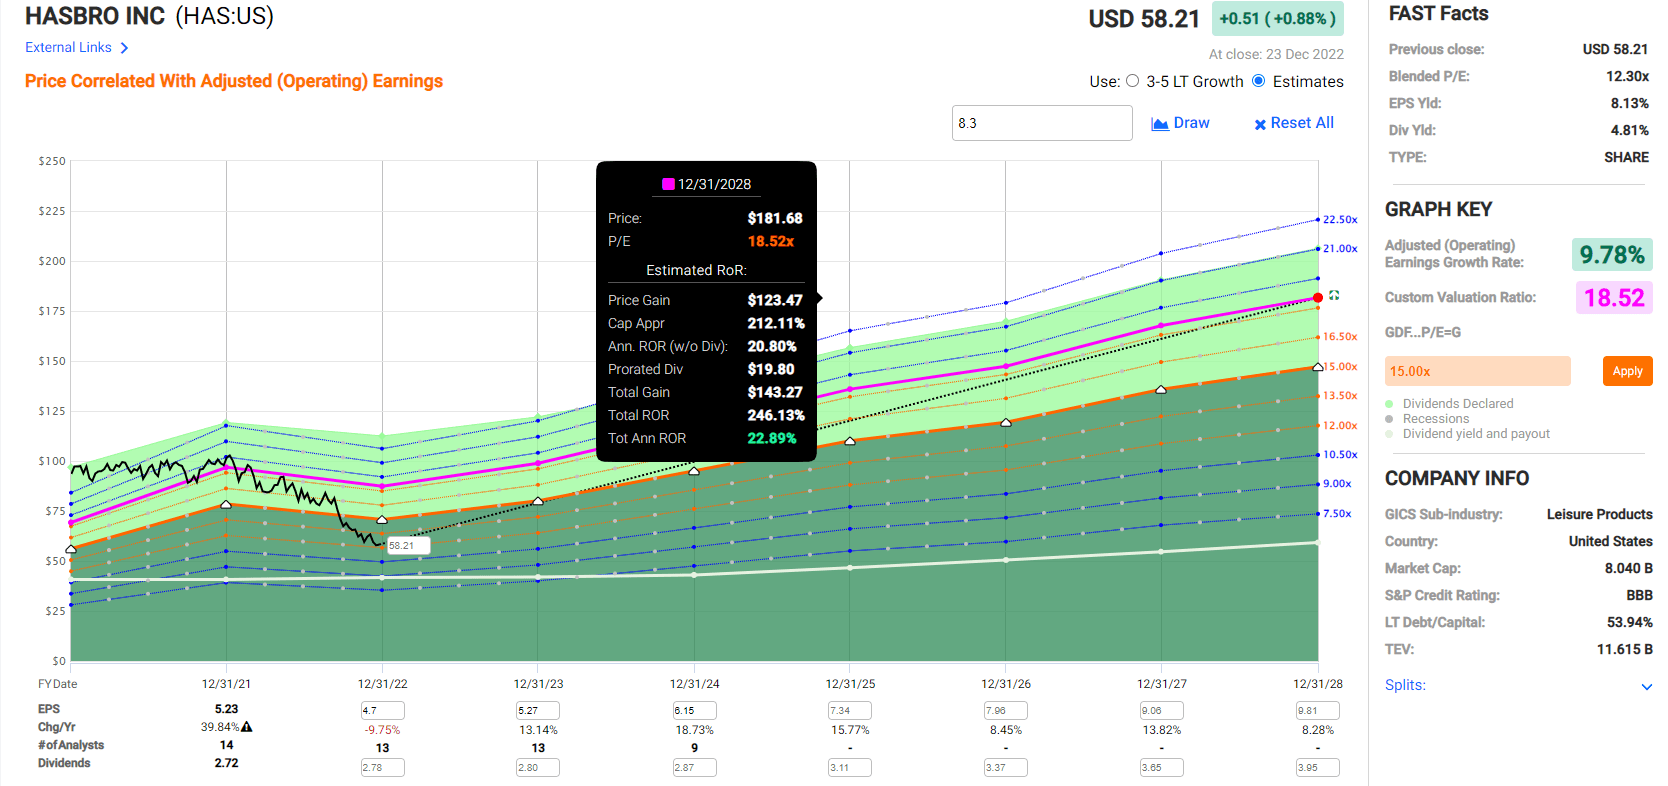
If Hasbro grows as expected and returns to historical market-determined fair value by 2028, it could deliver:
- 245% total returns
- 23% annual return
- 6.8% yield on today’s cost
- 6X the return of the S&P 500 consensus
Hasbro Investment Decision Score
Dividend Kings Automated Investment Decision Tool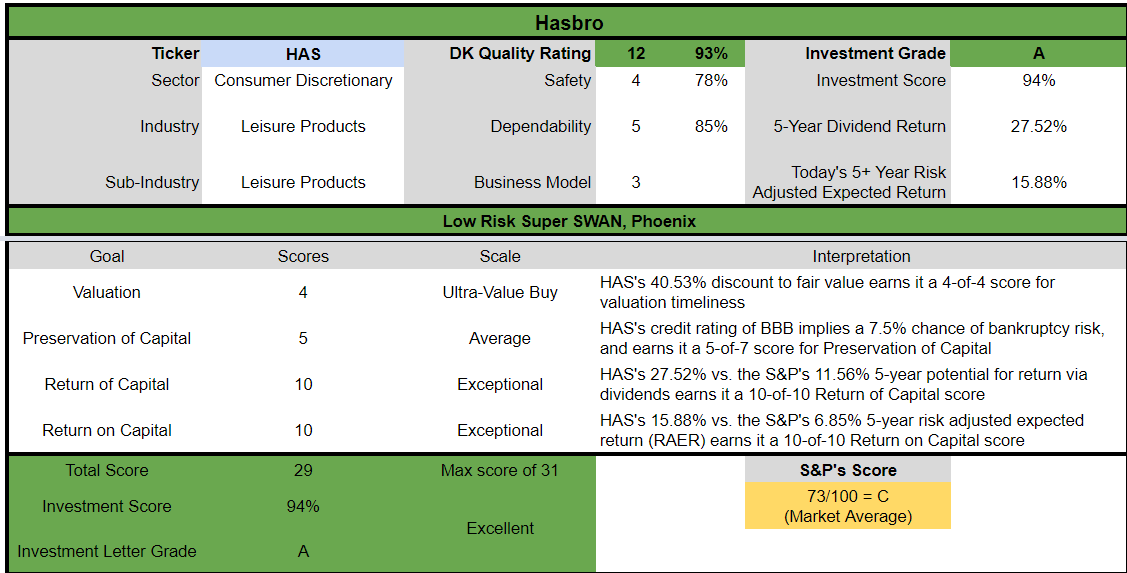
HAS is a potentially excellent deep value, high-yield opportunity for anyone comfortable with its risk profile. Look at how it compares to the S&P 500.
- 41% discount to fair value vs. 1% discount S&P = 40% better valuation
- 4.8% safe yield vs. 1.8% (3X higher and safer)
- approximately 13.1% long-term annual return potential vs. 10.2% CAGR S&P
- about 2.5X higher risk-adjusted expected returns
- 2X higher income potential over five years
Bottom Line: Lincoln National And Hasbro Are Ridiculously Undervalued 5% to 6% Yielding Blue-Chips
Let me be clear: I’m NOT calling the bottom in LNC or HAS (I’m not a market-timer).
Super SWAN quality does NOT mean “can’t fall hard and fast in a bear market.”
Fundamentals are all that determine safety and quality, and my recommendations.
- over 30+ years, 97% of stock returns are a function of pure fundamentals, not luck
- in the short term; luck is 25X as powerful as fundamentals
- in the long term, fundamentals are 33X as powerful as luck
While I can’t predict the market in the short term, here’s what I can tell you about LNC and HAS.
- both companies have strong investment-grade credit ratings
- both are expected to grow at their historical rates (not-value traps)
- both have reasonable plans for achieving their historical growth rates in the future
- both offer around 13% long-term return potential
- both offer a safe 5% to 6% yield
- both could deliver 2.2X to 3.2X returns in the next two years
- both could more than triple in the next five years
What happens in a recessionary bear market? Even the best companies on earth can become 41% to 61% undervalued.
What happens if you take advantage of such mispriced blue-chips? You can potentially earn 45% to 77% annual returns over the next two years and more than triple your money in the next five.
Most importantly, you can lock in safe and growing 5% to 6% yields that could be paying you a 10% yield on today’s cost by the end of the decade.
Can I guarantee that those buying LNC and HAS today will be thrilled with the results in the next few weeks or months? Of course not.
But given the best available evidence, we have today, I can say with high confidence that you’ll likely feel like a stock market genius in 5+ years.
Be the first to comment