

fotografstockholm
Most investors know that the stock market is the best place to grow their savings and income over time. Since 1900, the U.S. stock market has delivered 6.7% annual inflation-adjusted returns.
Ben Carlson 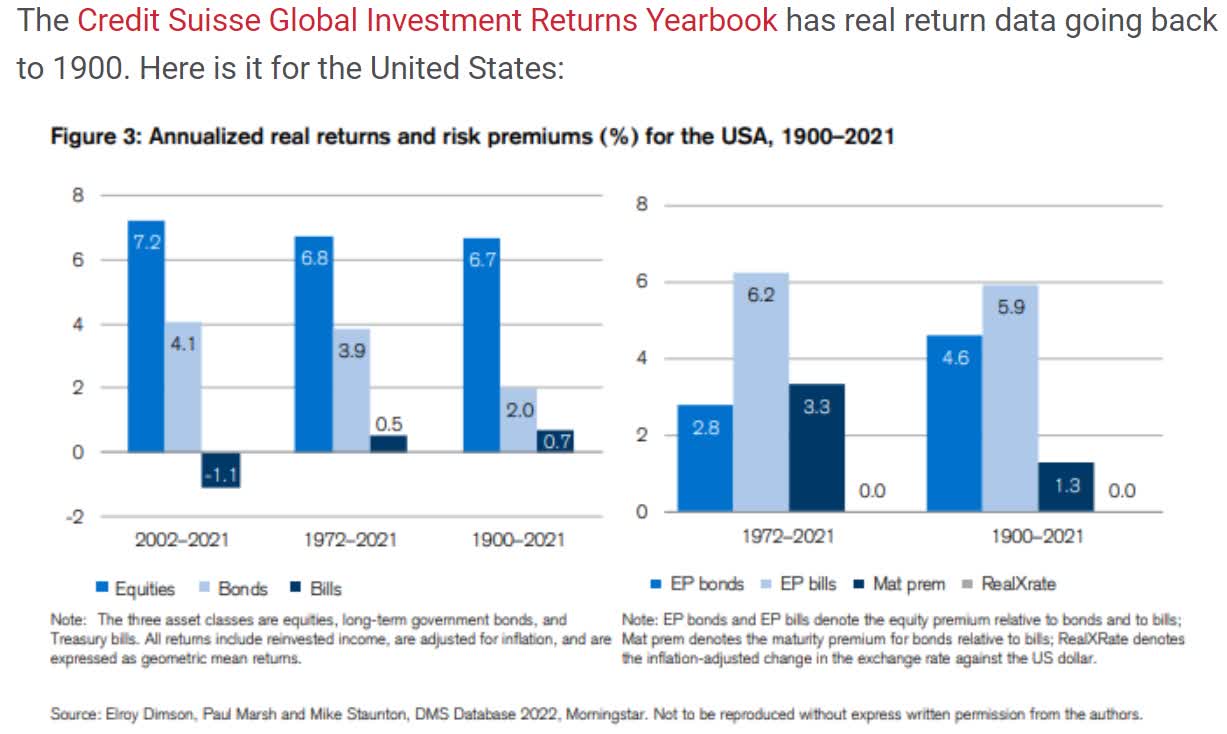
Since 1972, including the stagflationary hell of a decade of almost double-digit inflation and interest rates peaking at 20%? 6.8% per year real returns.
Since 2002, a period of slower growth, two major recessions, and four bear markets? 7.2%.
Since 1950? About 7%.
Since 1926? About 7%.
According to BlackRock’s research, since 1816? 6.8% (almost 800,000X real returns).
Charlie Bilello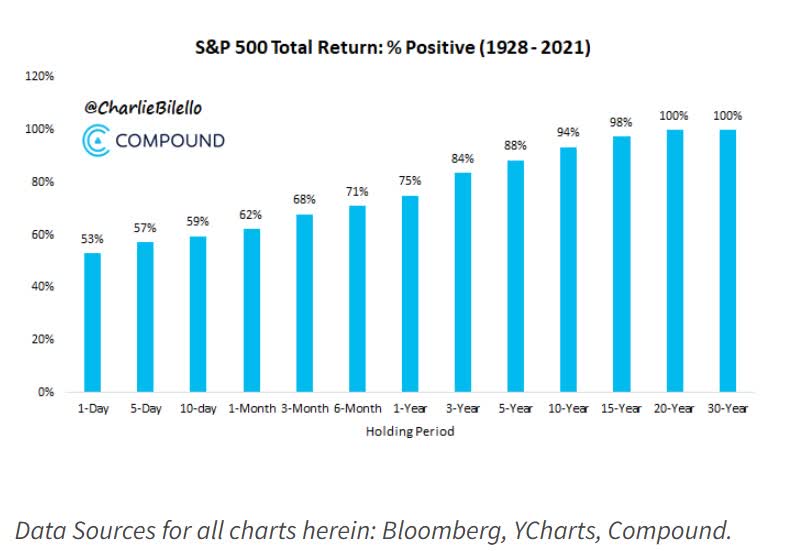
Stocks for the long run are as close to a 100% guarantee of success as you can find in this world.
Even high inflation and the Great Depression couldn’t cause the market EVER to post negative 20 years of returns.
Charlie Bilello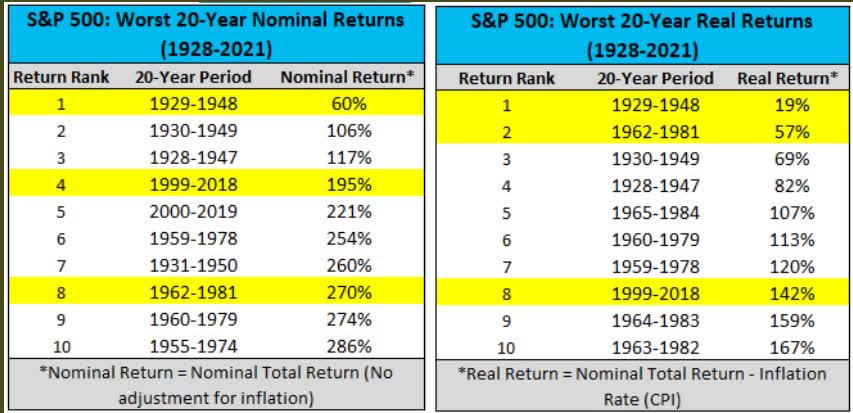
But did you know that since 1926, according to S&P, 32% of the market’s returns have been from dividends?
Why Dividends Matter And They Matter A Lot
The true investor will do better if he forgets about the stock market and pays attention to his dividend returns and to the operating results of his companies.” – Ben Graham (emphasis added)
S&P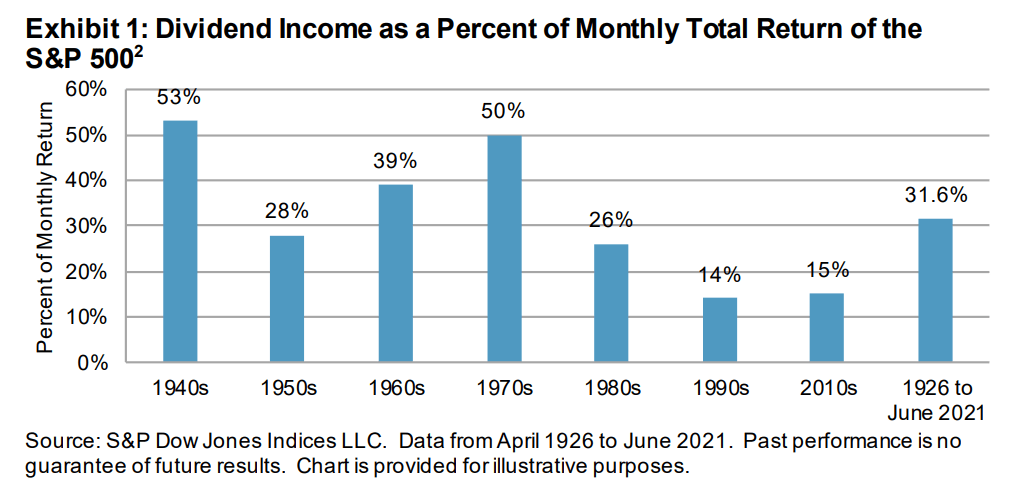
In the stagflationary 1970s, it was 50%. Take away dividends, and the market has had several negative return periods lasting 20 years…or longer.
- 2.2% of the market’s historical inflation-adjusted returns are from dividends.
Surely, 2.2% annual returns can’t matter that much, can they?
S&P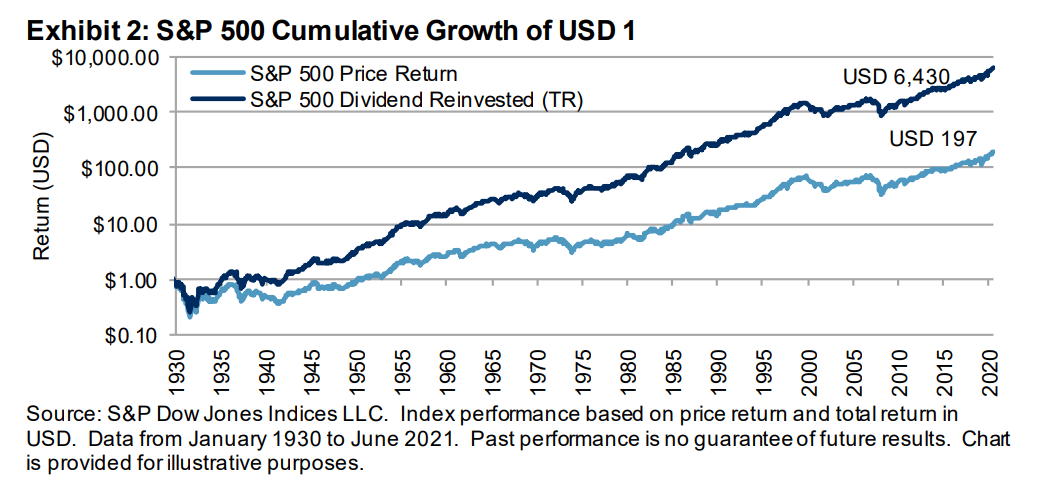
Actually, from 1930 to 2021, the S&P 500, not counting inflation, went up 197X.
- 12.4X adjusted for inflation
But thanks to dividend reinvestment, it actually went up 6,430X.
- 404X adjusted for inflation
Or, to put it another way, over the very long-term, that 32% of returns from dividends? That 2.2% per year income boost?
- 32.5X more inflation-adjusted wealth
- potentially the difference between retiring in safety and splendor…and not retiring at all
S&P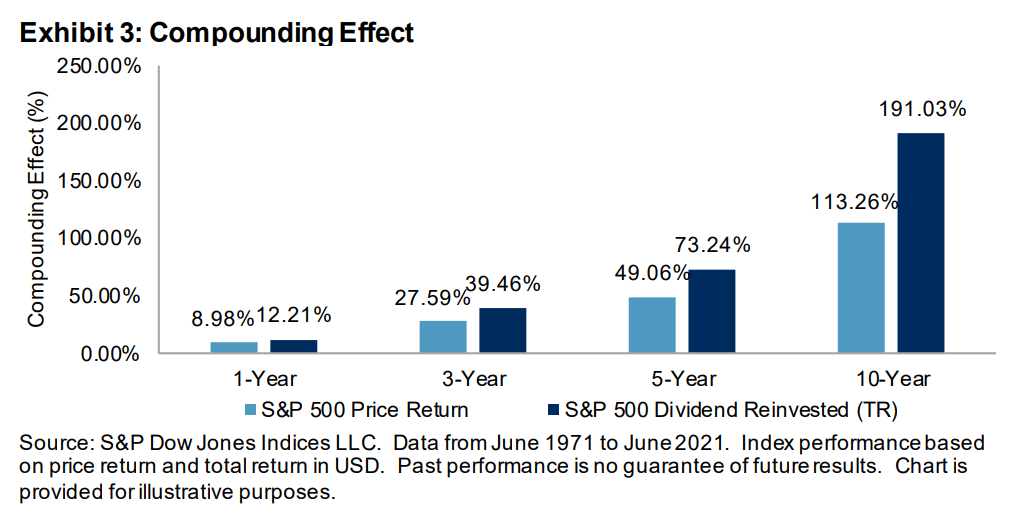
The average annual dividend boost from dividends has been 2.2% since 1971. But the average 10-year dividend boost has been 78% per rolling decade.
1988 to 2015 (WestCore Funds )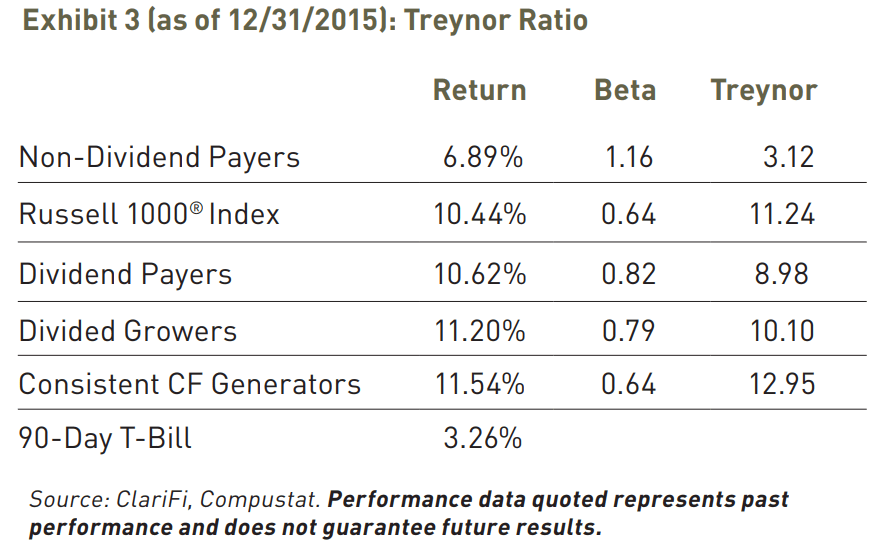
From 1988 to 2015, non-dividend stocks delivered 6.9% annual returns.
Dividend stocks outperformed by almost 4% per year, and dividend growth stocks doubled those returns.
Dividend Aristocrats: The Most Dependable Dividend Growth Blue-Chips In America
Ben Graham considered 20+ years of interrupted dividends an important sign of company quality. But if 20+ years without a dividend cut is a sign of quality, then a 20+ year dividend growth STREAK is a sign of excellence.
The dividend aristocrats are S&P companies with 25+ year dividend growth streaks.
- arguably the most dependable dividend stocks in America
- and some of the most dependable on earth.
S&P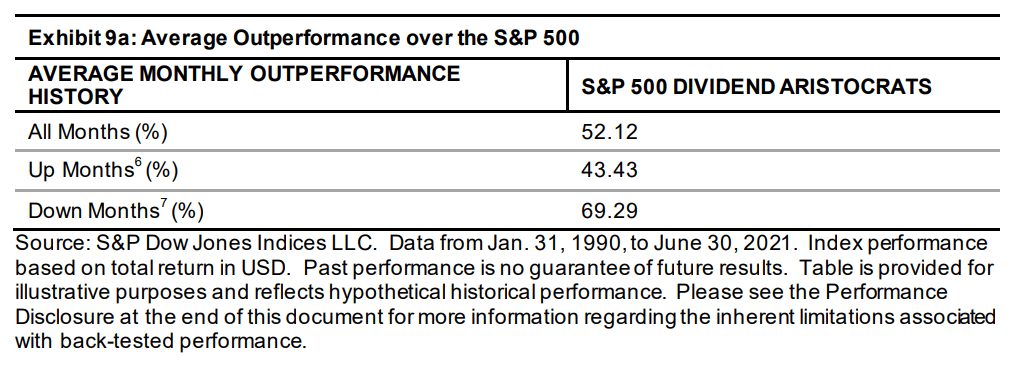
The dividend aristocrats have outperformed the S&P 500 52% of all months.
- S&P is up 52% of all days since 1926
- small outperformance adds up to lifechanging results.
But perhaps most interesting for investors in a bear market is the fact that the aristocrats outperform the market 69% of the time during down markets.
S&P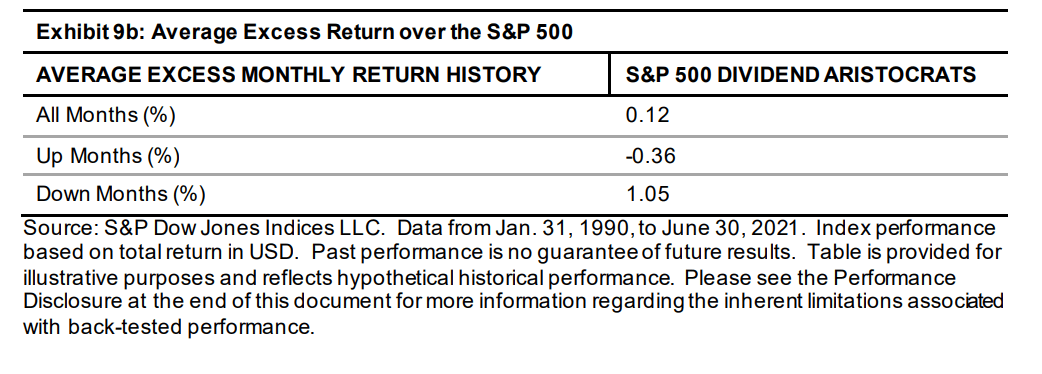
The outperformance doesn’t tend to be large in any given month, but it does add up over time. What does it add up to?
S&P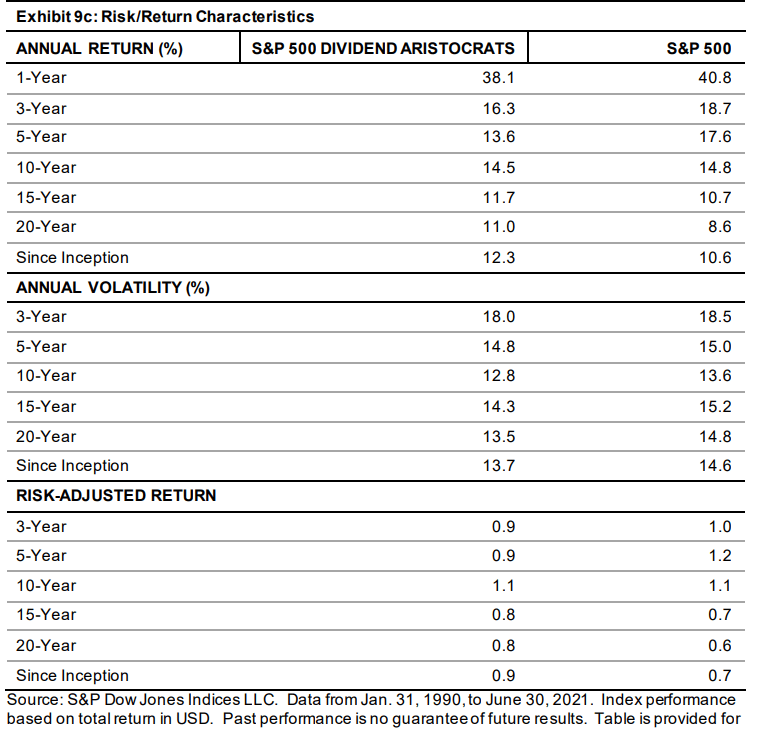
1.7% higher annual returns since 1990, with 0.9% lower annual volatility, resulting in 29% better volatility-adjusted annual returns.
- 70% higher inflation-adjusted total wealth over 31.5 years
- 57X total return vs. 23.4X S&P 500
- 26.8X inflation-adjusted return vs. 11.0X S&P 500.
You don’t need crypto, SPACs, NFTs, or meme stocks to 27X your money…you just need the world’s most dependable dividend growth blue-chips and enough time.
And guess what? The world’s best dividend stocks can not just help make you rich, they can help you sleep well at night (“SWAN”), too, including in some of the worst years for stocks in the last third of a century.
S&P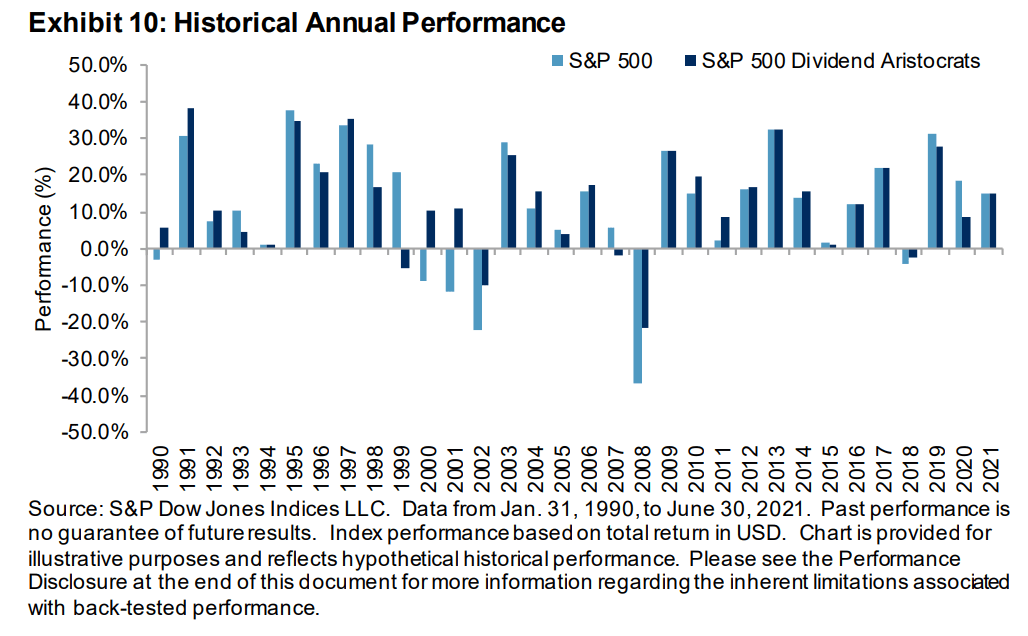
S&P 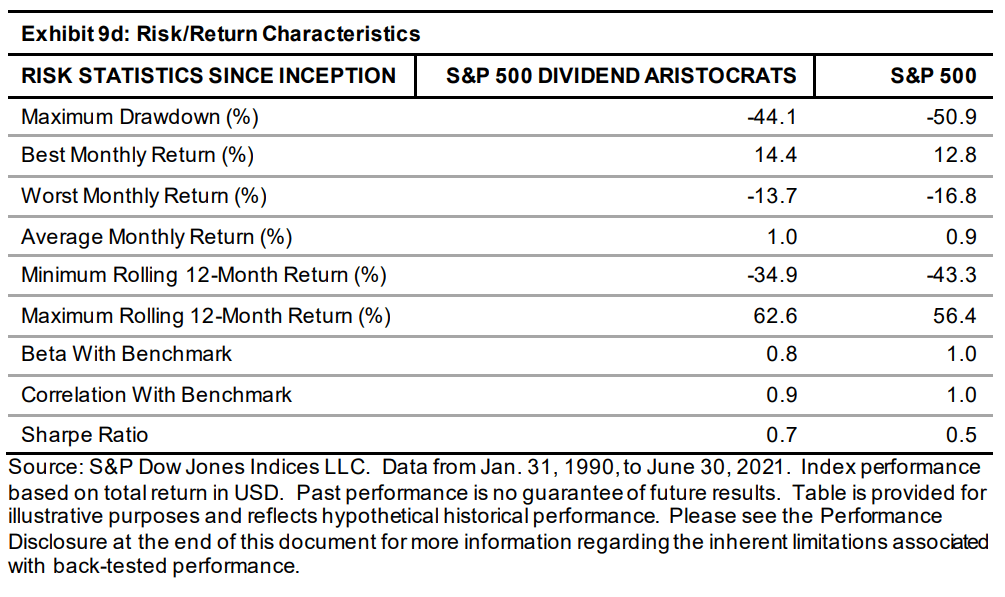
Higher returns, higher yield, AND lower volatility, what’s not to love?
What about the future? Past performance is no guarantee of future results, but fundamentals drive 97% of long-term returns. So here’s what analysts expect from the dividend aristocrat and S&P 500 in the coming years and decades.
| Investment Strategy | Yield | LT Consensus Growth | LT Consensus Total Return Potential | Long-Term Risk-Adjusted Expected Return | Long-Term Inflation And Risk-Adjusted Expected Returns | Years To Double Your Inflation & Risk-Adjusted Wealth |
10-Year Inflation And Risk-Adjusted Expected Return |
| Dividend Aristocrats | 2.6% | 8.6% | 11.1% | 7.8% | 5.3% | 13.5 | 1.68 |
| S&P 500 | 1.7% | 8.5% | 10.2% | 7.1% | 4.7% | 15.4 | 1.58 |
| Nasdaq | 1.0% | 14.3% | 15.3% | 10.7% | 8.2% | 8.8 | 2.20 |
(Source: Morningstar, FactSet, Ycharts)
Analysts currently expect the aristocrats to outperform the S&P 500 by about 1% annually in the future. That might not match the current long-term Nasdaq forecast of 15.3%, but keep in mind that the Nasdaq yields just 1% and the aristocrats a healthy 2.6%.
Inflation-Adjusted Consensus Total Return Potential: $1,000 Initial Investment
| Time Frame (Years) | 7.7% CAGR Inflation-Adjusted S&P Consensus | 8.6% Inflation-Adjusted Aristocrat Consensus | 9.8% CAGR Inflation-Adjusted ALIZY Guidance | Difference Between Inflation-Adjusted Aristocrat Consensus And S&P Consensus |
| 5 | $1,451.05 | $1,512.69 | $1,598.10 | $61.63 |
| 10 | $2,105.56 | $2,288.22 | $2,553.93 | $182.67 |
| 15 | $3,055.27 | $3,461.36 | $4,081.45 | $406.09 |
| 20 | $4,433.36 | $5,235.95 | $6,522.58 | $802.59 |
| 25 | $6,433.04 | $7,920.35 | $10,423.76 | $1,487.31 |
| 30 | $9,334.69 | $11,981.01 | $16,658.26 | $2,646.32 |
| 35 | $13,545.13 | $18,123.51 | $26,621.62 | $4,578.38 |
| 40 | $19,654.70 | $27,415.19 | $42,544.10 | $7,760.49 |
| 45 | $28,520.01 | $41,470.58 | $67,989.88 | $12,950.57 |
| 50 | $41,384.05 | $62,731.98 | $108,654.87 | $21,347.93 |
(Source: DK Research Terminal, FactSet)
If the aristocrats grow as analysts expect, then over the next 30 years, they could deliver 17X inflation-adjusted returns and over 50 years 109X.
| Time Frame (Years) | Ratio Inflation-Adjusted Aristocrat Consensus vs. S&P consensus |
| 5 | 1.04 |
| 10 | 1.09 |
| 15 | 1.13 |
| 20 | 1.18 |
| 25 | 1.23 |
| 30 | 1.28 |
| 35 | 1.34 |
| 40 | 1.39 |
| 45 | 1.45 |
| 50 | 1.52 |
(Source: DK Research Terminal, FactSet)
That’s potentially life-changing returns from some of the world’s safest, highest quality, and most dependable companies.
BUT just because the dividend aristocrats as a group are amazing doesn’t mean all aristocrats are created equal.
Let me show you two aristocrats you should ignore and two potentially set to soar that are incredible bear market bargains.
10 Dividend Aristocrats You Should Ignore
Let me show you some of the worst dividend aristocrats you can buy today.
- the lowest quality
- the most overvalued
I’m using the Dividend Kings Zen Research Terminal, which easily allows us to screen the DK 500 Master List by any one of 15 specialty watchlists.
Dividend Kings Zen Research Terminal 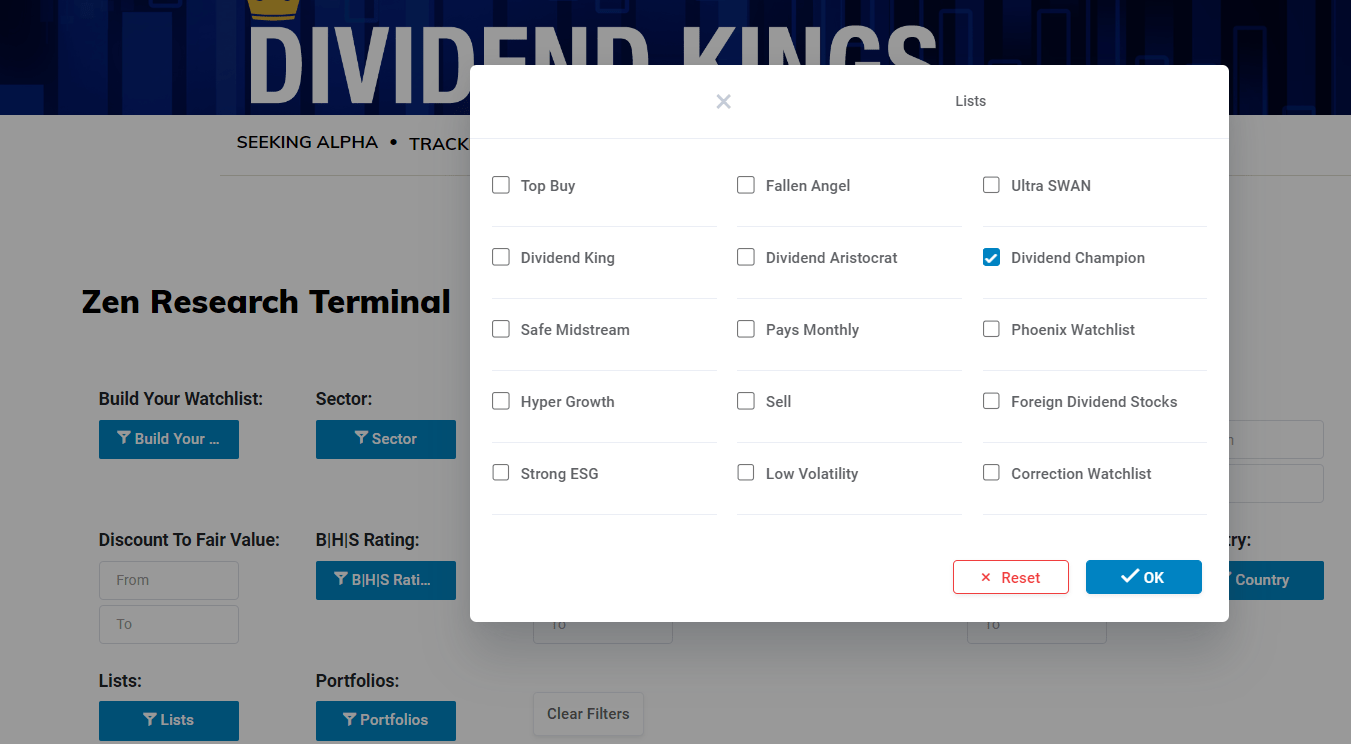
The DK 500 Master List is one of the world’s best watchlists, including
- every dividend aristocrat (S&P companies with 25+ year dividend growth streaks)
- every dividend champion (every company, including foreign, with 25+ year dividend growth streaks)
- every dividend king (every company with 50+ year dividend growth streaks)
- every foreign aristocrat (every company with 20+ year dividend growth streaks)
- every Ultra SWAN (wide moat aristocrats, as close to perfect quality companies as exist)
- 40 of the world’s best growth stocks.
My personal motto is safety and quality first, and prudent valuation, and sound risk management always. So let’s start with the lowest quality dividend aristocrats.
- I’m including any company with a 25+ year dividend growth streak, including champions and foreign dividend payers.
The 5 Lowest Quality Dividend Aristocrats
Averages are for ALL dividend champions (135 companies) (Dividend Kings Zen Research Terminal)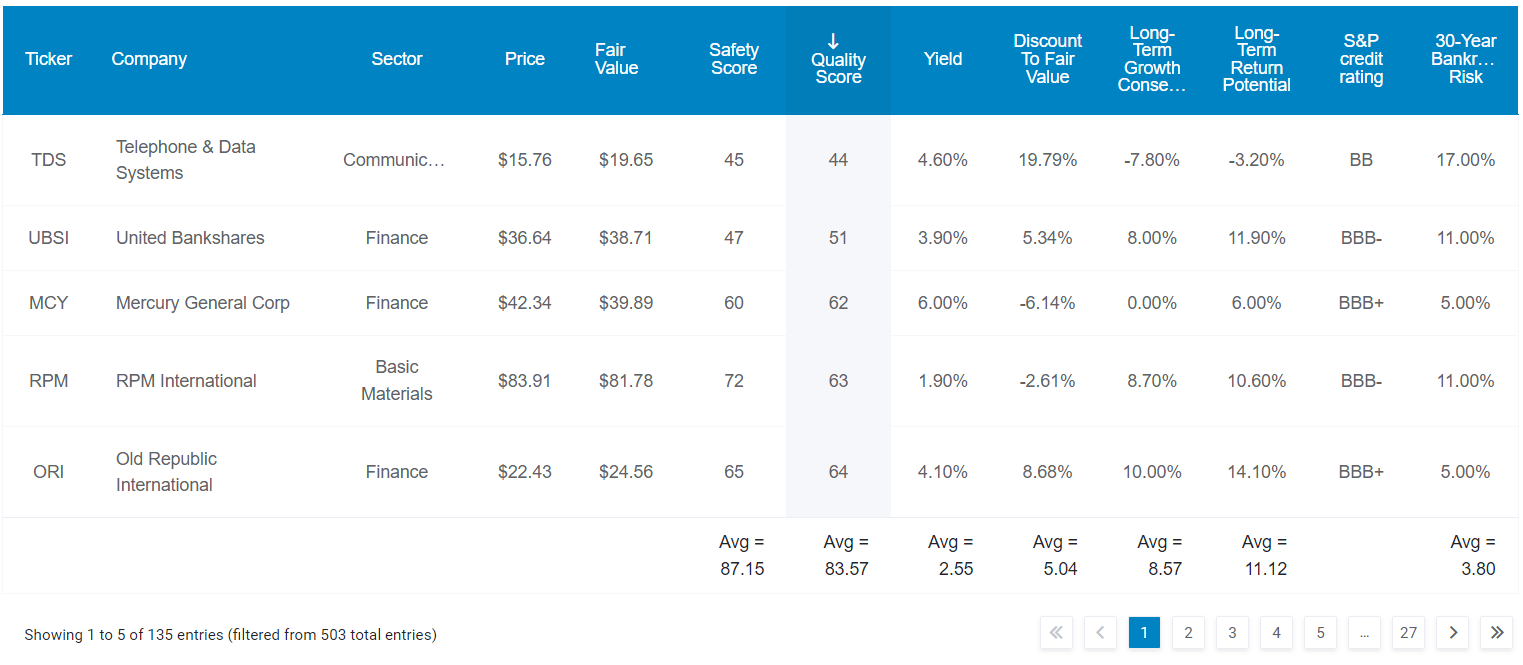
The five lowest quality dividend aristocrats are:
- Telephone and Data Systems (TDS)
- United Bankshares (UBSI)
- Mercury General (MCY)
- RPM International (RPM)
- Old Republic International (ORI).
There are many ways to measure safety and quality, and I factor in pretty much all of them.
The Dividend Kings’ overall quality scores are based on a 253-point model that includes:
-
Dividend safety
-
Balance sheet strength
-
Credit ratings
-
Credit default swap medium-term bankruptcy risk data
-
Short and long-term bankruptcy risk
-
Accounting and corporate fraud risk
-
Profitability and business model
-
Growth consensus estimates
-
Management growth guidance
-
Historical earnings growth rates
-
Historical cash flow growth rates
-
Historical dividend growth rates
-
Historical sales growth rates
-
Cost of capital
-
GF Scores
-
Long-term risk-management scores from MSCI, Morningstar, FactSet, S&P, Reuters’/Refinitiv, and Just Capital
-
Management quality
-
Dividend-friendly corporate culture/income dependability
-
Long-term total returns (a Ben Graham sign of quality)
-
Analyst consensus long-term return potential.
In fact, it includes over 1,000 fundamental metrics including the 12 rating agencies we use to assess fundamental risk.
-
credit and risk management ratings make up 41% of the DK safety and quality model
-
dividend/balance sheet/risk ratings make up 82% of the DK safety and quality model.
How do we know that our safety and quality model works well?
During the two worst recessions in 75 years, our safety model 87% of blue-chip dividend cuts, the ultimate baptism by fire for any dividend safety model.
So here’s why these five aristocrats (technically dividend champions) are companies to avoid.
Dividend Kings Zen Research Terminal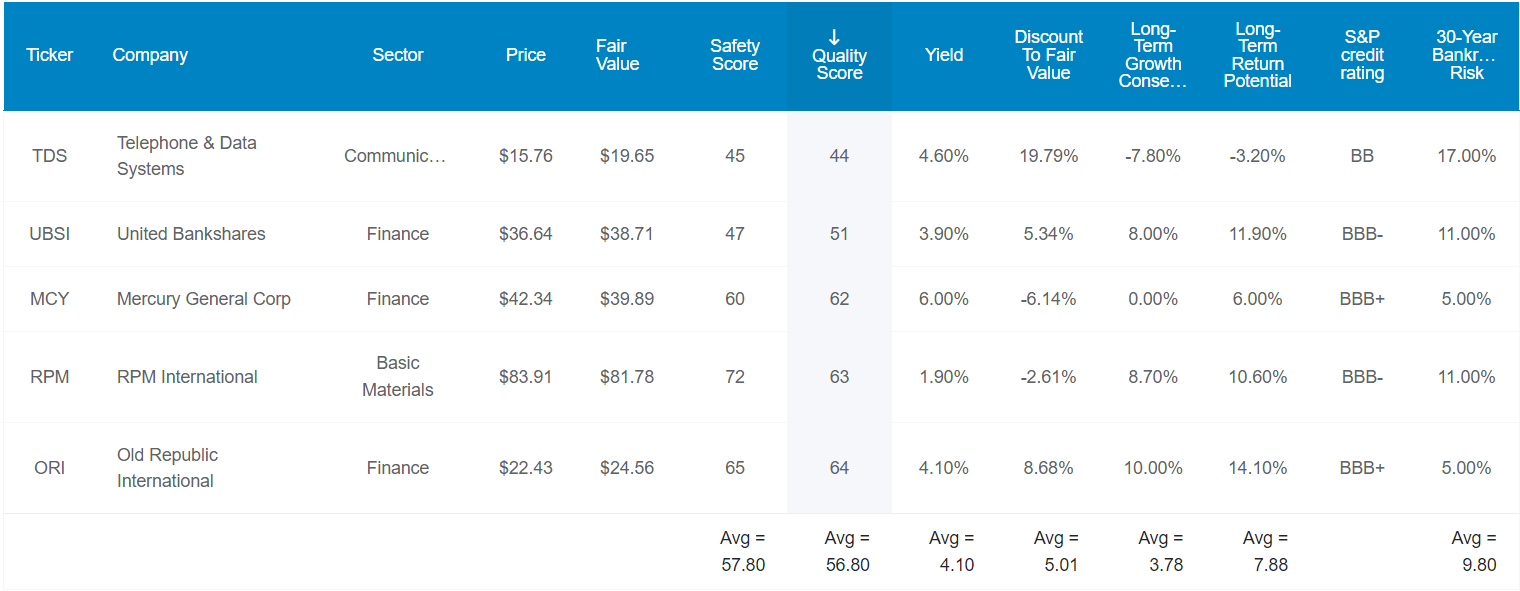
Let’s compare their fundamental stats to the Master List average, some of the world’s best companies.
| Metric | Dividend Aristocrats | 5 Lowest Quality Dividend Aristocrats | Master List Average |
| Quality | 87% | 57% | 80% |
| Safety | 89% | 58% | 84% |
| Average Recession Dividend Cut Risk | 0.5% | 2.0% | 0.5% |
| Severe Recession Dividend Cut Risk | 1.6% | 4.6% | 1.9% |
| Dependability | 84% | 57% | NA |
| Long-Term Risk Management Industry Percentile | 67% Above-Average | 26% Poor |
61% Above-Average |
| Average Credit Rating | A- Stable | BBB- Stable | BBB+ Stable |
| Average Bankruptcy Risk | 3.04% | 9.80% | 4.78% |
(Source: DK Zen Research Terminal)
Compared to the dividend aristocrats, these five offer far lower quality and 4X higher risk of a dividend cut in the average recession since WWII. In a severe recession, like the Pandemic or Great Recession, the risk is approximately 3X higher that they cut their dividend.
S&P estimates their average 30-year bankruptcy risk at 9.8%, more than 3X higher than the average aristocrat and 2X higher than the average Master List company.
And six rating agencies estimate their long-term risk management in the 26th industry percentile, which is poor and makes these high-risk companies I recommend avoiding.
But low quality is just one reason why you might want to avoid an aristocrat.
The 5 Most Overvalued Dividend Aristocrats
Valuation matters, and it matters. According to Bank of America, since 1987, 80% of blue-chip stock returns are explained by valuation mean reversion.
Bank of America 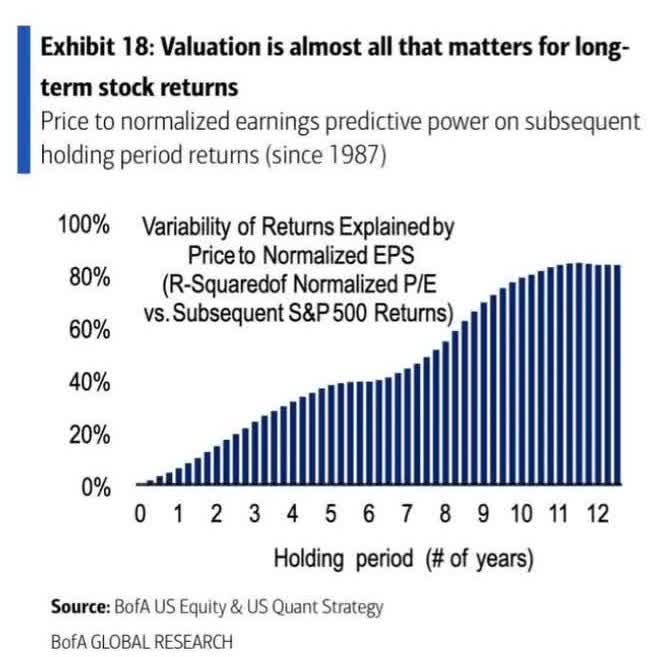
In other words, if a company trades at a historical premium to its market-determined fair value, you have a negative margin of safety that could result in terrible returns for several years…or even decades.
Dividend Kings Zen Research Terminal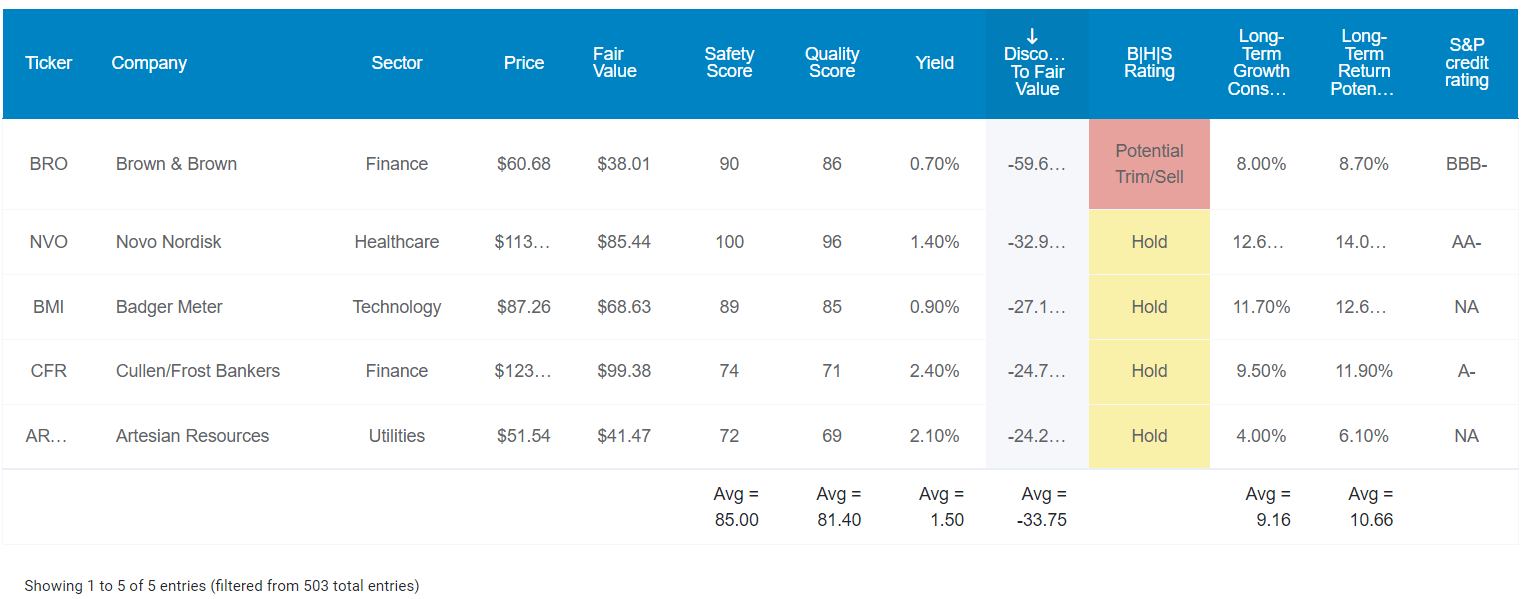
The five most overvalued aristocrats are:
- Brown & Brown (BRO)
- Novo Nordisk (NVO)
- Badger Meter (BMI)
- Cullen/Frost Bankers (CFR)
- Artesian Resources (ARTNA).
The quality of these aristocrats is very good, as is their safety and average A- stable credit rating. The only issue is valuation.
Brown & Brown 2024 Consensus Total Return Potential
(Source: FAST Graphs, FactSet Research)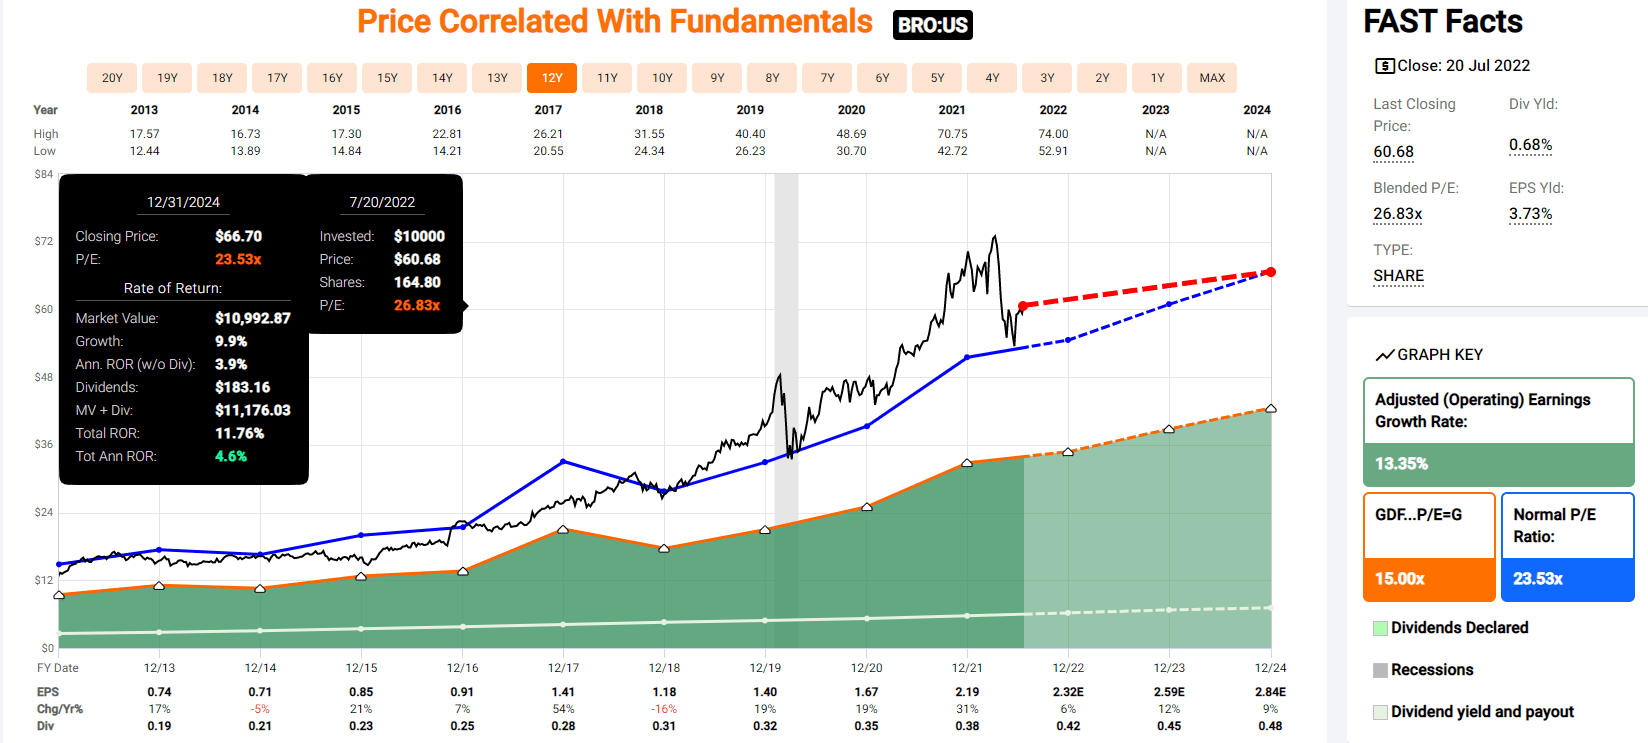
BRO’s bubble valuations have come down a lot in this bear market, and it’s a relatively fast-growing company. So investors buying it today are not likely to actually lose money over the next few years, just make a rather paltry 4.6% annual return.
Now compare that to the S&P 500.
S&P 500 2024 Consensus Total Return Potential
(Source: FAST Graphs, FactSet Research)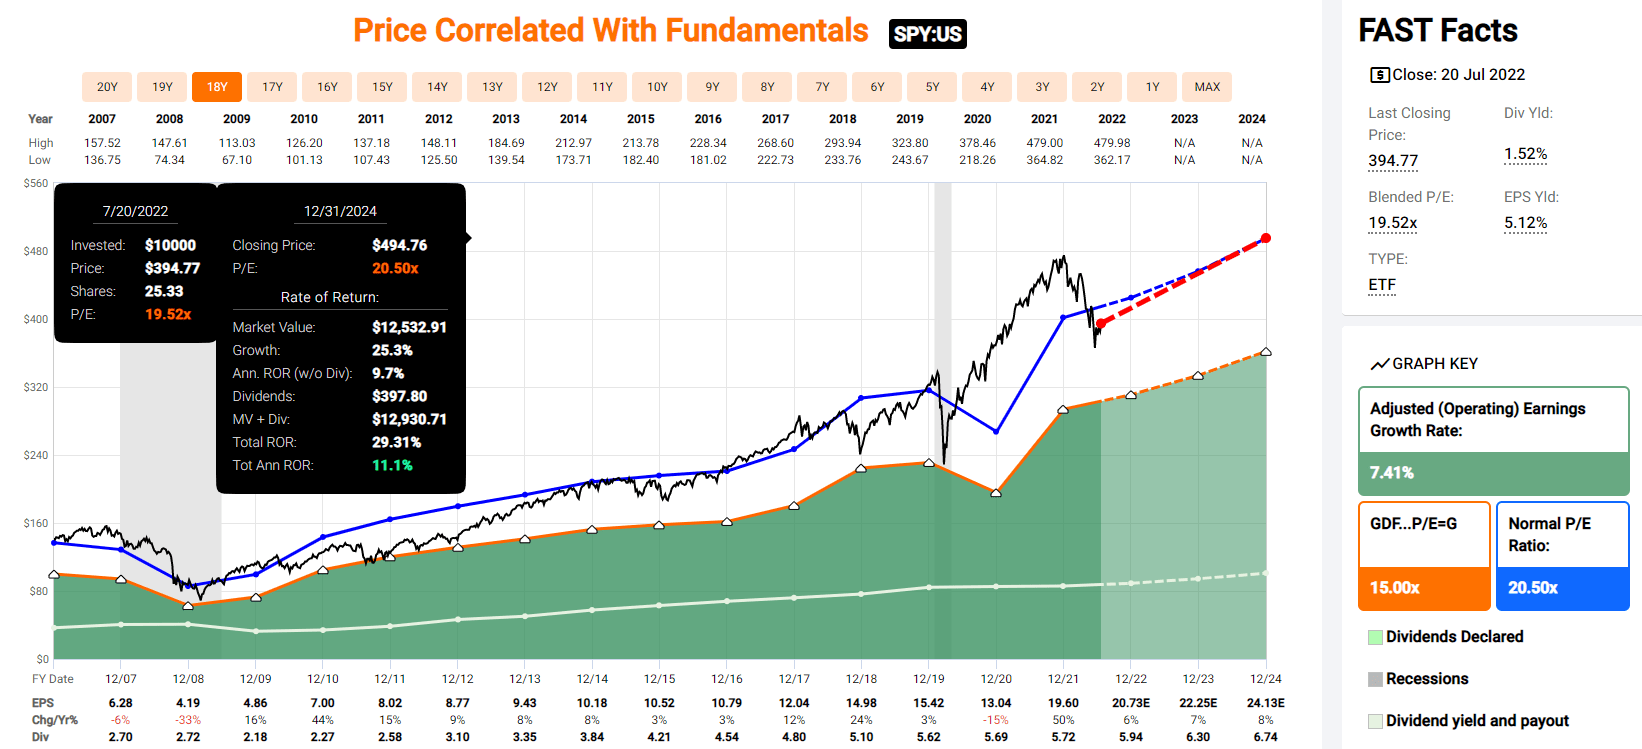
Analysts expect the S&P 500, which is approximately 1.5% historically undervalued, to deliver around 11% annual returns over the next 2.5 years.
Novo Nordisk 2024 Consensus Total Return Potential
(Source: FAST Graphs, FactSet Research)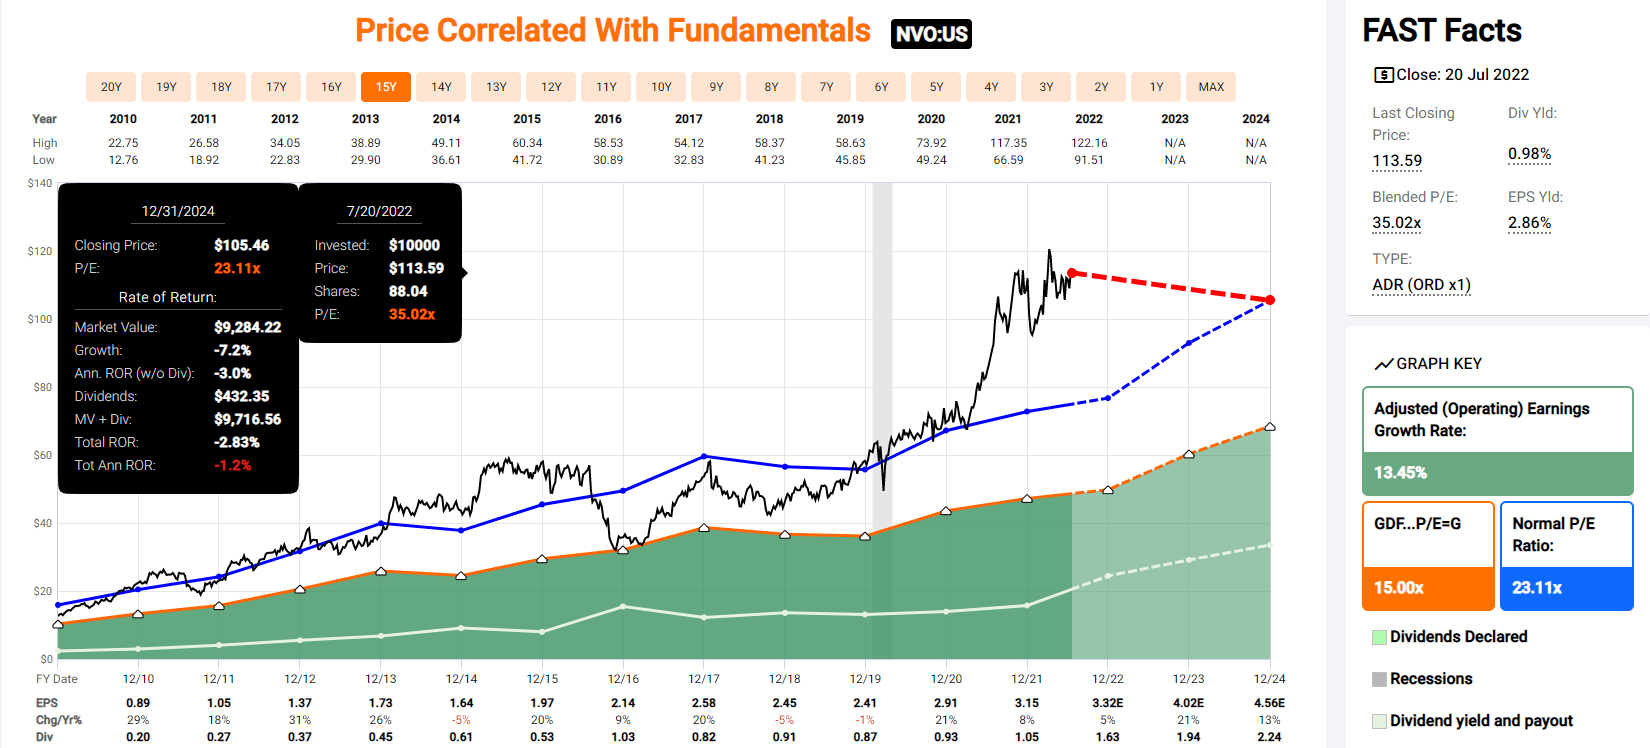
NVO is one of the world’s hottest pharmas right now, the world leader in diabetes care, a huge growth market in the coming decade. But the market is so bullish that NVO is already pricing in three years of very strong growth.
Anyone buying today should expect to potentially not turn a profit until 2025.
Badger Meter 2024 Consensus Total Return Potential
(Source: FAST Graphs, FactSet Research)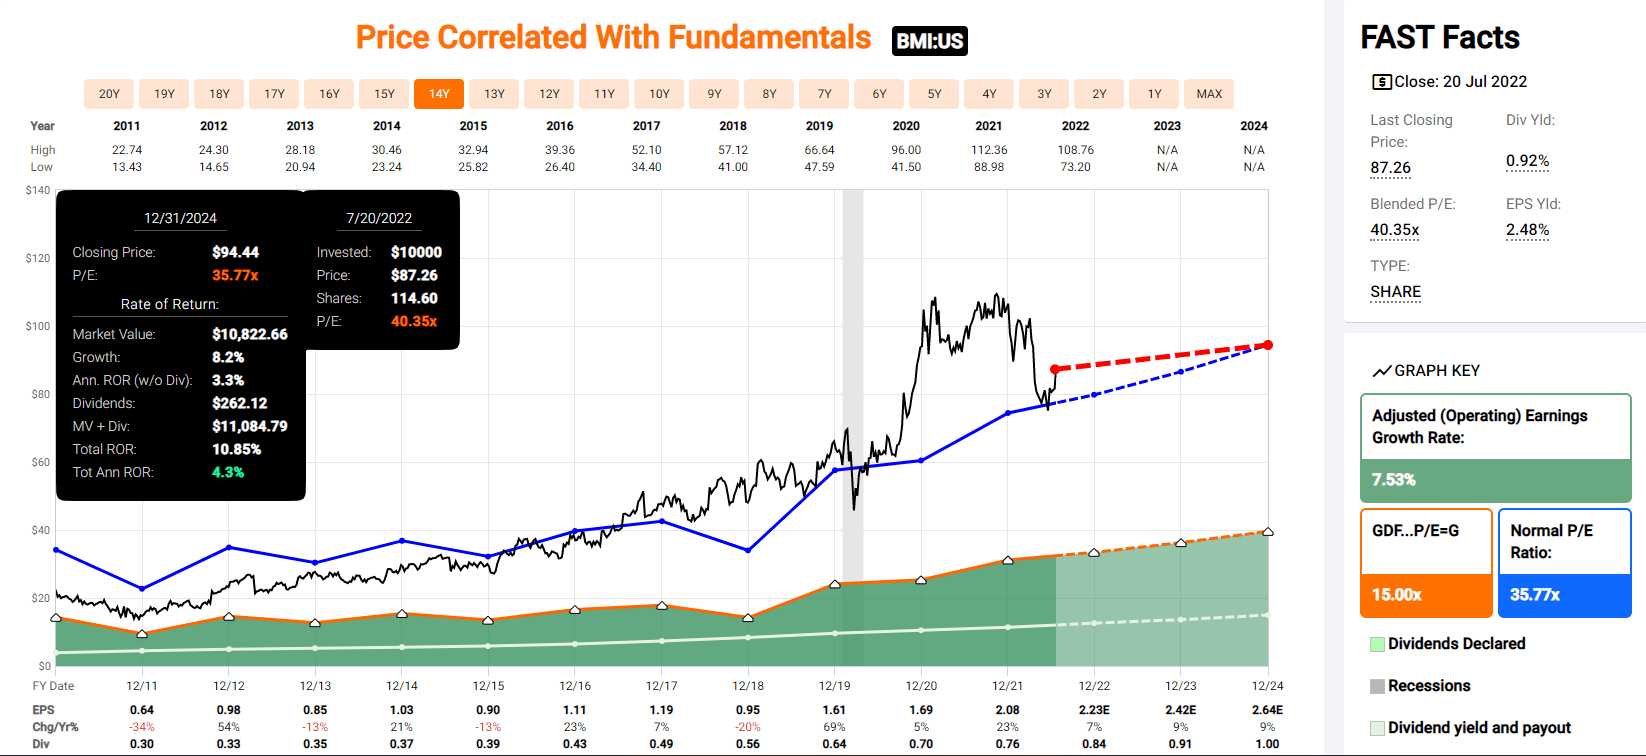
BMI has come down a lot in price from outrageous valuations but is still only likely to deliver around 5% returns over the next 2.5 years.
- 3X less than the S&P 500 consensus.
Cullen/Frost Bankers 2024 Consensus Total Return Potential
(Source: FAST Graphs, FactSet Research)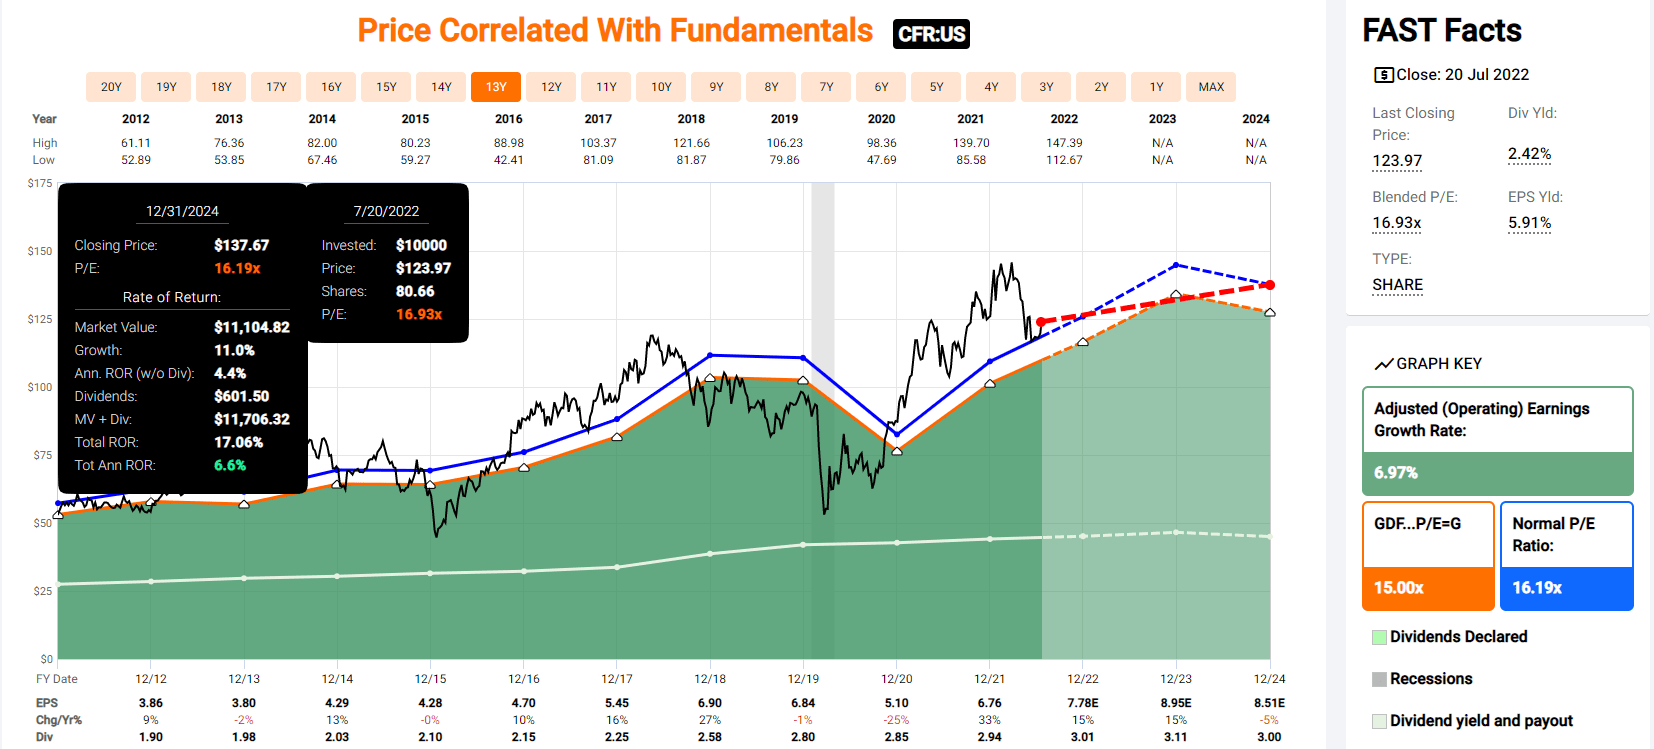
CFR is down 14% in recent weeks and has the potential for close to 7% returns over the next few years.
- half that of the S&P 500.
Artesian Resources 2024 Consensus Total Return Potential
(Source: FAST Graphs, FactSet Research)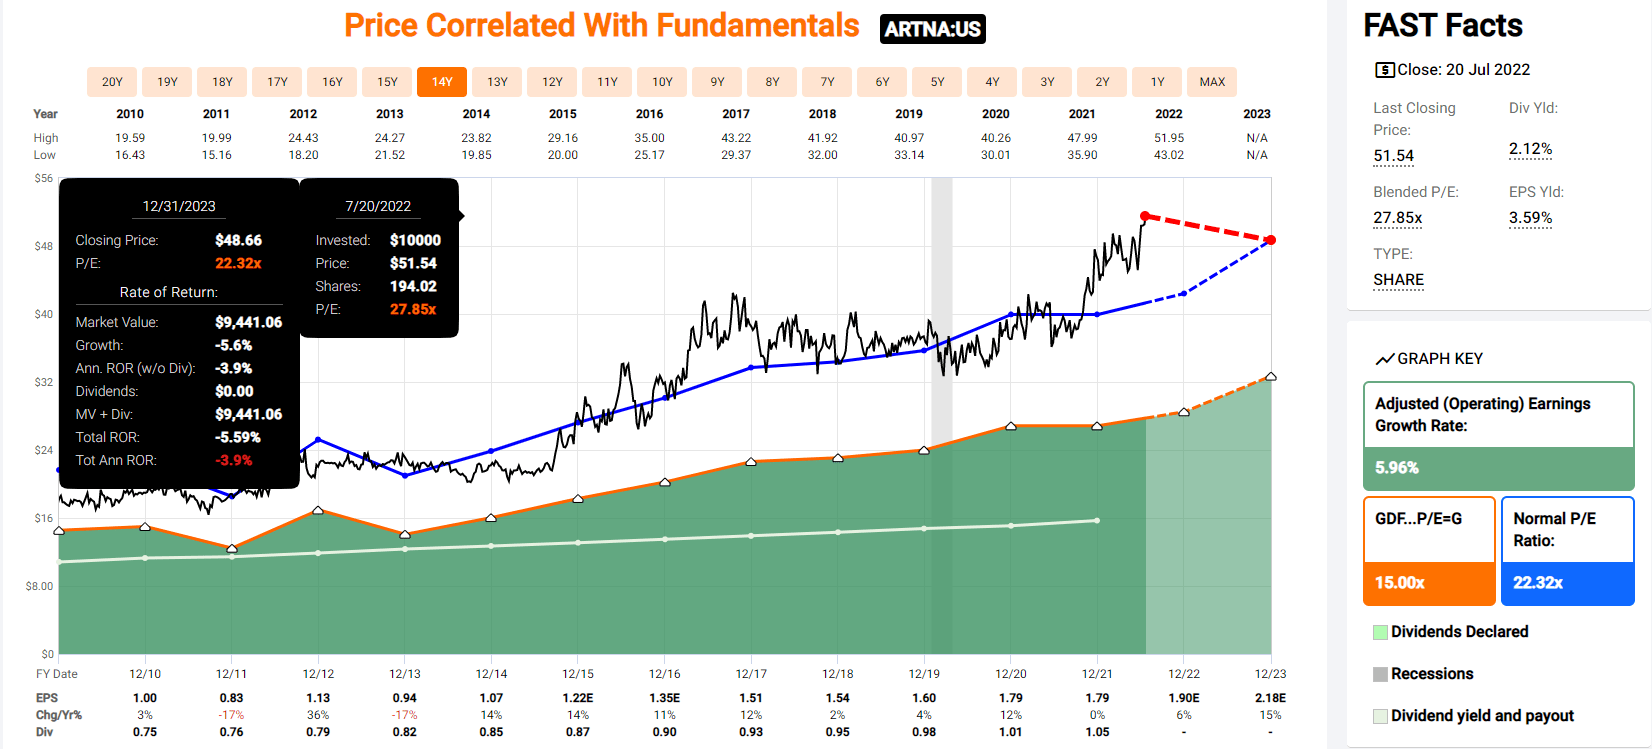
This $500 million water utility is trading at nearly 28X earnings and not growing fast enough to avoid potential negative returns through 2024.
2 High-Yield Dividend Aristocrats Potentially Set To Soar
Analysts are famous for providing 12-month forward price targets based on their buy/sell/hold ratings.
We track these in our Zen Research Terminal BUT, more importantly, track the 12-month fundamentally justified total return potential.
- the returns you’d make if a company grows as expected and returns to historical market-determined fair value.
So here are two high-yield dividend aristocrats, one high-yielding and one fast-growing aristocrat that analysts are wildly bullish on for the next year, and rightfully so.
Fresenius Medical Care (FMS): A High-Yield German Dividend Aristocrat That Could Soar 51% In The Next Year
- What You Need To Know About Foreign Dividend Withholding Taxes
- Fresenius Medical is a German company, so U.S. investors face 26.375% dividend withholding taxes on their shares
- a tax credit recoups this if you fill out the paperwork and own them in taxable accounts.
Here is a deep dive look into this very impressive global aristocrat, including its investment thesis, growth outlook, risk profile, valuation, and total return potential.
And here are two recent updates from Sebastian Wolf, the Dividend Kings’ European blue-chip guru.
Reasons To Potentially Buy FMS Today
- 87% quality low-risk 12/13 Super SWAN dialysis company
- 116th highest quality company on the Master List (77th percentile)
- 90% dividend safety score
- 25-year dividend growth streak (in local currency)
- 3.6% very safe yield (after the tax credit)
- 0.5% average recession dividend cut risk
- 1.7% severe recession dividend cut risk
- 43% historically undervalued (potential Ultra Value “Fat Pitch” buy)
- Fair Value: $39.96
- 11.7X forward earnings vs. historical 18.5 to 19X
- 7.2X cash-adjusted earnings = anti-bubble blue-chip bargain
- BBB stable outlook credit rating = 7.5% 30-year bankruptcy risk
- 76th industry percentile risk management consensus = Good
- 0.4% to 16% CAGR margin-of-error growth consensus range
- 15.3% CAGR median growth consensus
- 5-year consensus total return potential: 24% to 26% CAGR
- base-case 5-year consensus return potential: 25% CAGR (4X more than the S&P consensus)
- consensus 12-month total return forecast: 52%
- Fundamentally Justified 12-Month Returns: 77% CAGR.
Fresenius Medical Care 2024 Consensus Total Return Potential
(Source: FAST Graphs, FactSet Research)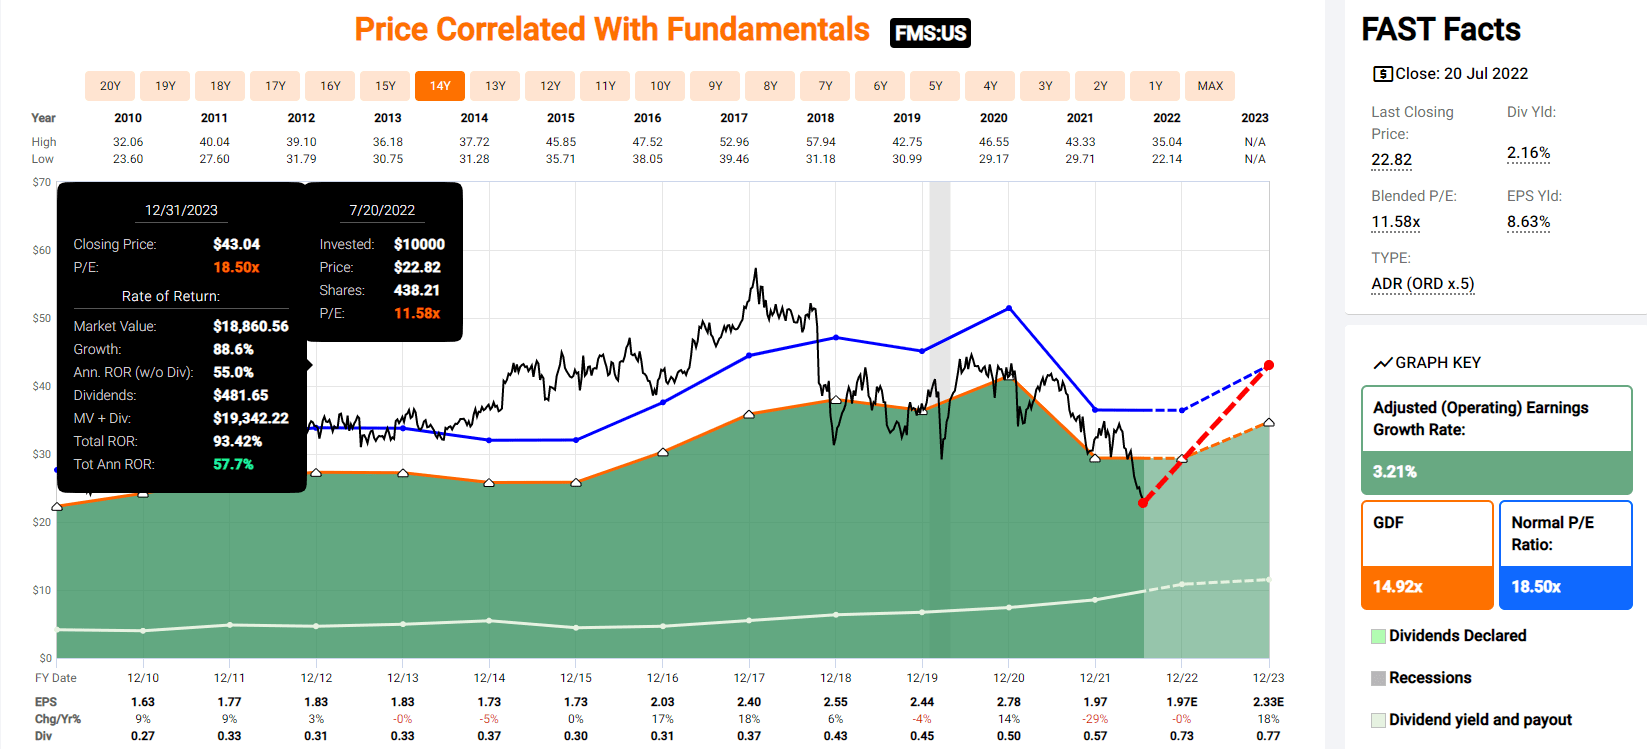
Anti-bubble aristocrat Fresenius Medical is so undervalued after a multi-year bear market that they expect it to return 51% in the next 12 months and nearly double by the end of 2024.
(Source: FAST Graphs, FactSet Research)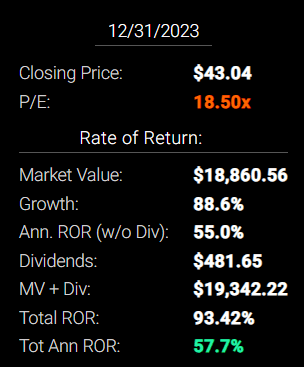
That’s potentially 58% annualized return potential that is beyond Buffett-like and 3X more than the S&P 500.
Fresenius Medical Care 2027 Consensus Total Return Potential
(Source: FAST Graphs, FactSet Research) (Source: FAST Graphs, FactSet Research)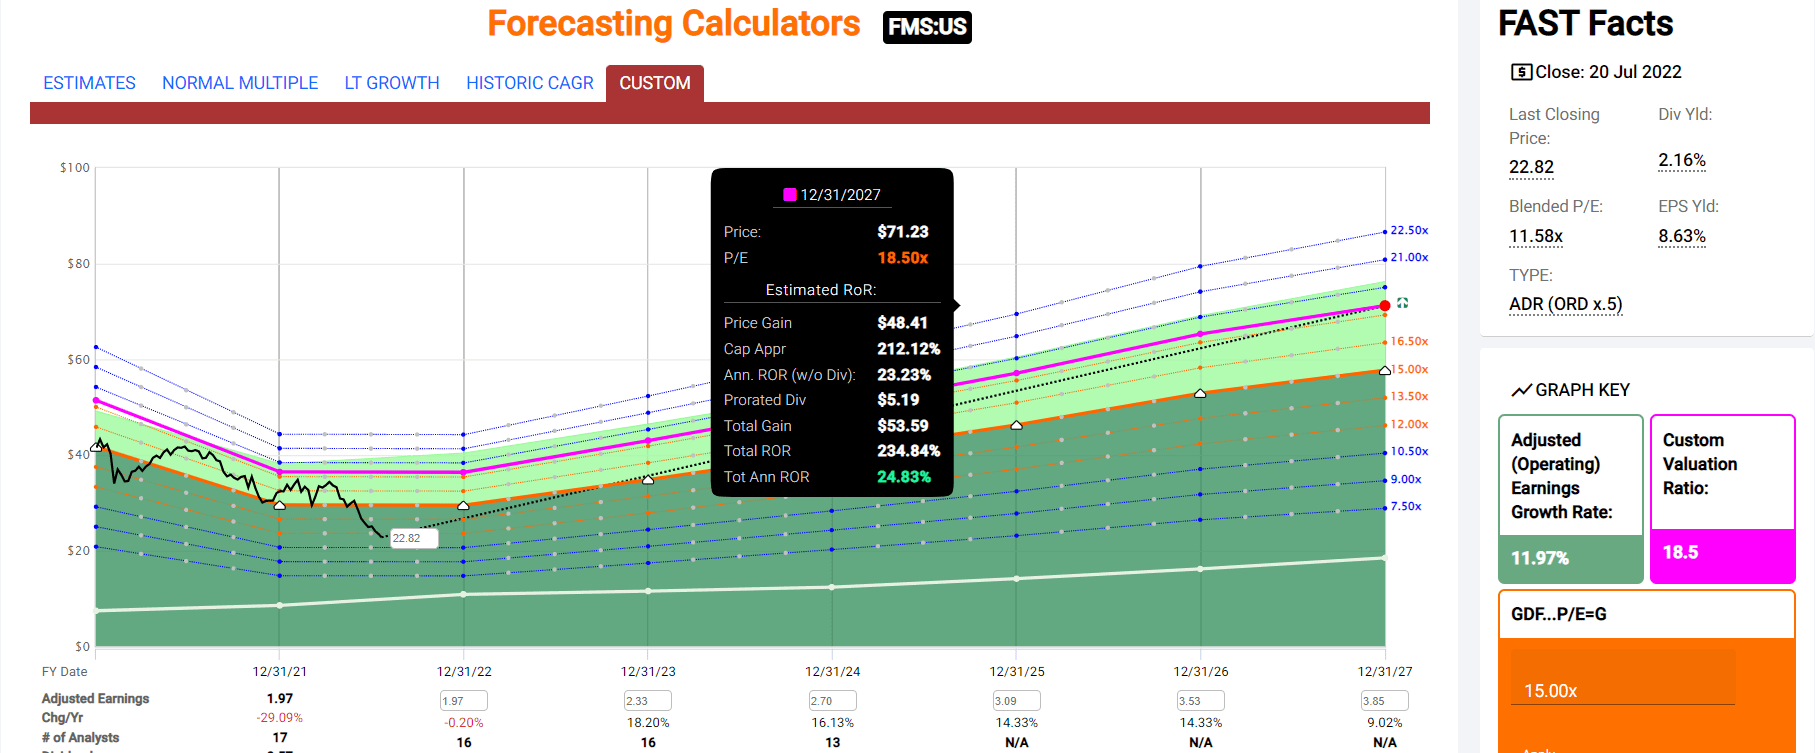
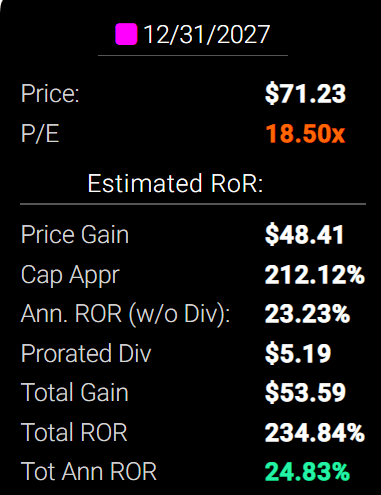
This is the power of deep value, anti-bubble dividend aristocrat investing.
The potential for Warren Buffett-like 25% annual returns over the next five years, about 4X more than the S&P 500 consensus.
S&P 500 2027 Consensus Total Return Potential
| Year | Upside Potential By End of That Year | Consensus CAGR Return Potential By End of That Year | Probability-Weighted Return (Annualized) | Inflation And Risk-Adjusted Expected Returns |
Expected Market Return Vs. Historical Inflation-Adjusted Return |
| 2027 | 54.62% | 9.11% | 6.83% | 4.73% | 69.56% |
(Source: Market Valuation & Total Return Potential Tool)
FMS Investment Decision Score
DK (Source: DK Automated Investment Decision Tool)
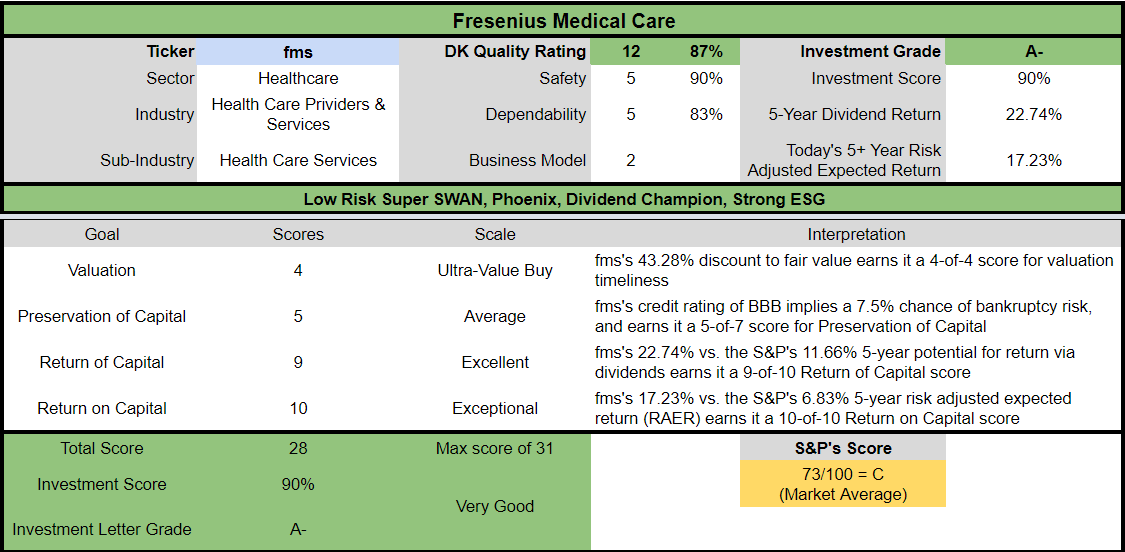
For anyone comfortable with its risk profile, FMS is one of the most reasonable and prudent high-yield aristocrats you can buy today.
- 43% discount vs 2% market discount = 41% better valuation
- 3.6% yield vs. 1.7% yield (and a much safer yield at that)
- almost 2X better long-term return consensus
- 3X better risk-adjusted expected return over the next five years
- 23% of your investment repaid in consensus dividends within five years, 2X more than the S&P 500.
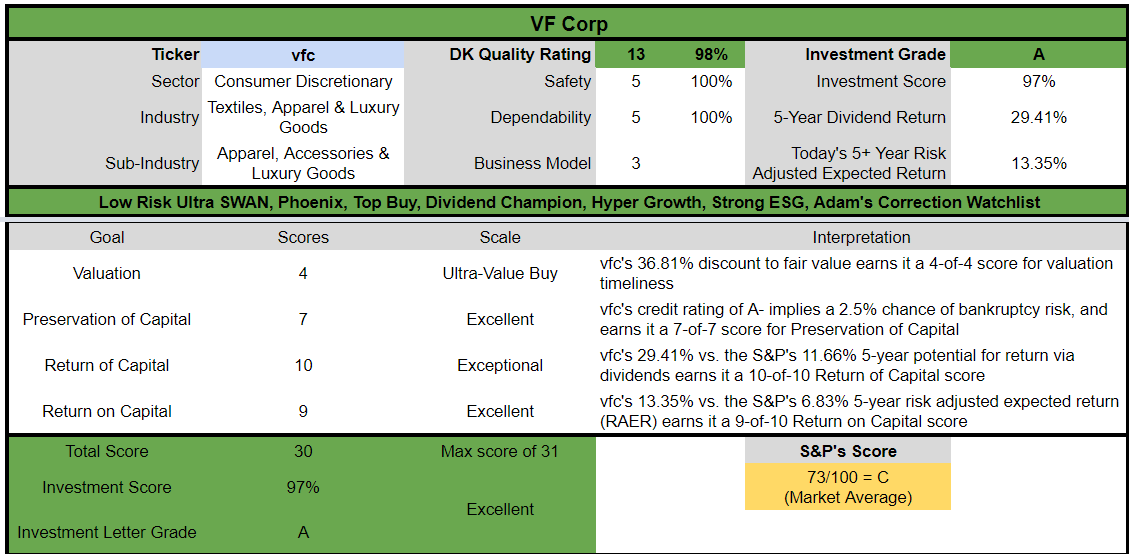
V.F. Corp (VFC): A High-Yield Dividend King Capable Of 61% Returns Within 12 Months
Here is a deep dive article fully exploring this amazing dividend king’s investment thesis, risk profile, growth outlook, valuation, and return potential.
Reasons To Potentially Buy VFC Today
- 98% quality low-risk 13/13 Ultra SWAN dividend king
- 12th highest quality company on the Master List (97th percentile)
- 100% dividend safety score
- 50-year dividend growth streak
- 4.2% very safe yield
- 0.5% average recession dividend cut risk
- 1.0% severe recession dividend cut risk
- 36% historically undervalued (potential Ultra Value “Fat pitch” buy)
- Fair Value: $75.26
- 14.7X forward earnings vs. 18 to 22.5X historical
- 12.4X cash-adjusted earnings
- A- negative outlook credit rating = 2.5% 30-year bankruptcy risk
- 75th industry percentile risk management consensus = Good
- 8% to 14% CAGR margin-of-error growth consensus range
- 15% to 21% management growth guidance
- 11.1% CAGR median growth consensus
- 5-year consensus total return potential: 15% to 21% CAGR
- base-case 5-year consensus return potential: 18% CAGR (3X more than the S&P consensus)
- consensus 12-month total return forecast: 20%
- Fundamentally Justified 12-Month Returns: 61% CAGR.
V.F. Corp 2025 Consensus Total Return Potential
(Source: FAST Graphs, FactSet) (Source: FAST Graphs, FactSet)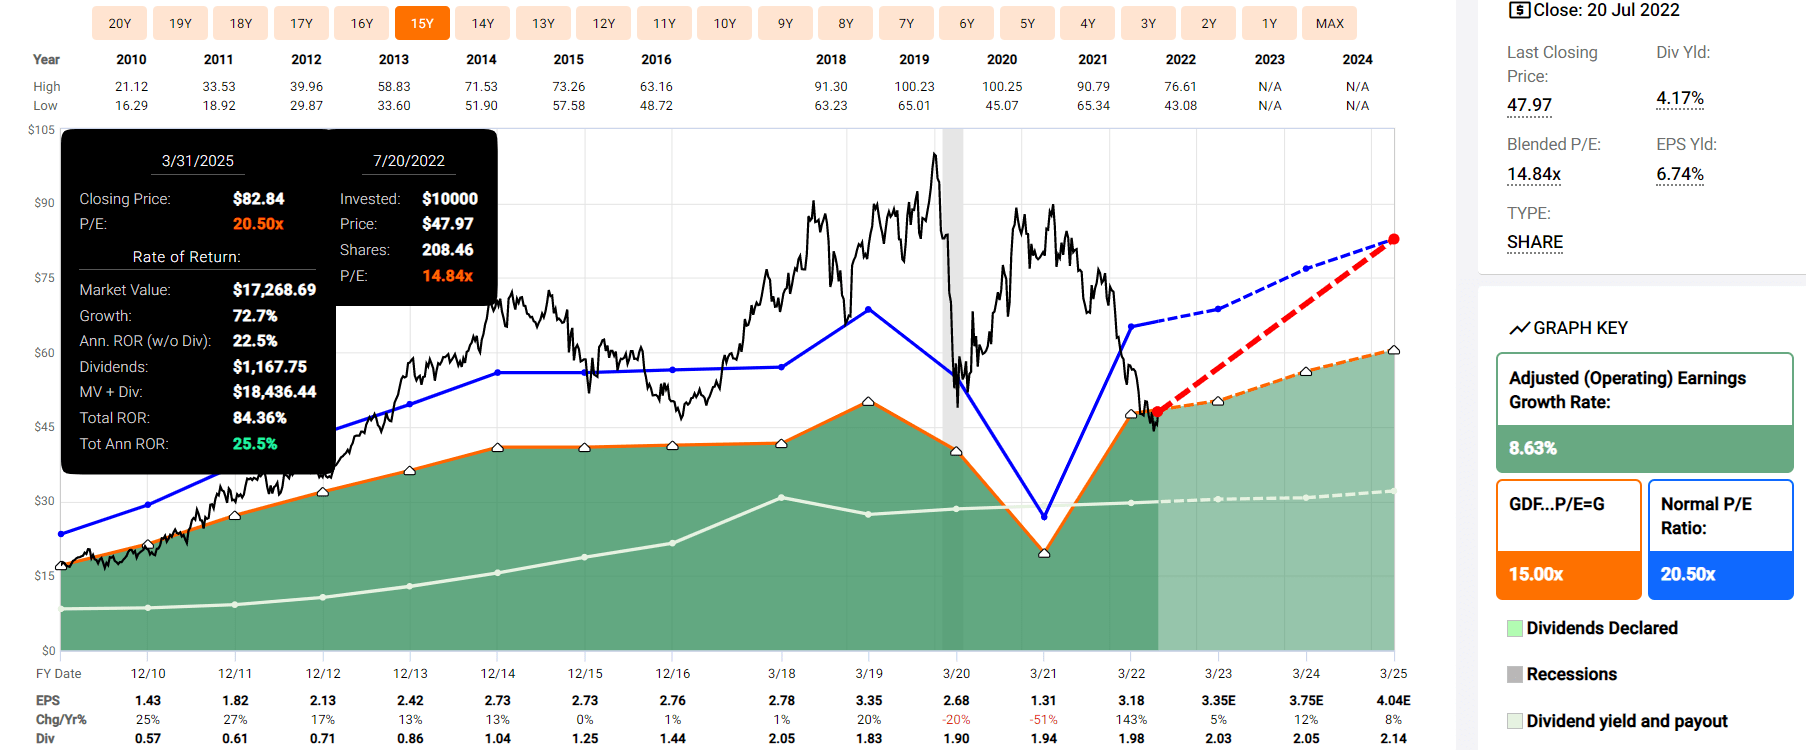
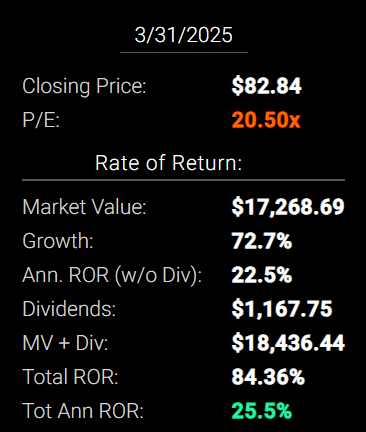
Analysts think VFC will deliver 20% total returns in the next year and potentially 84% by March of 2025, a Buffett-like 26% annual return potential.
- almost 3X more than the S&P 500.
V.F. Corp 2028 Consensus Total Return Potential
(Source: FAST Graphs, FactSet) (Source: FAST Graphs, FactSet)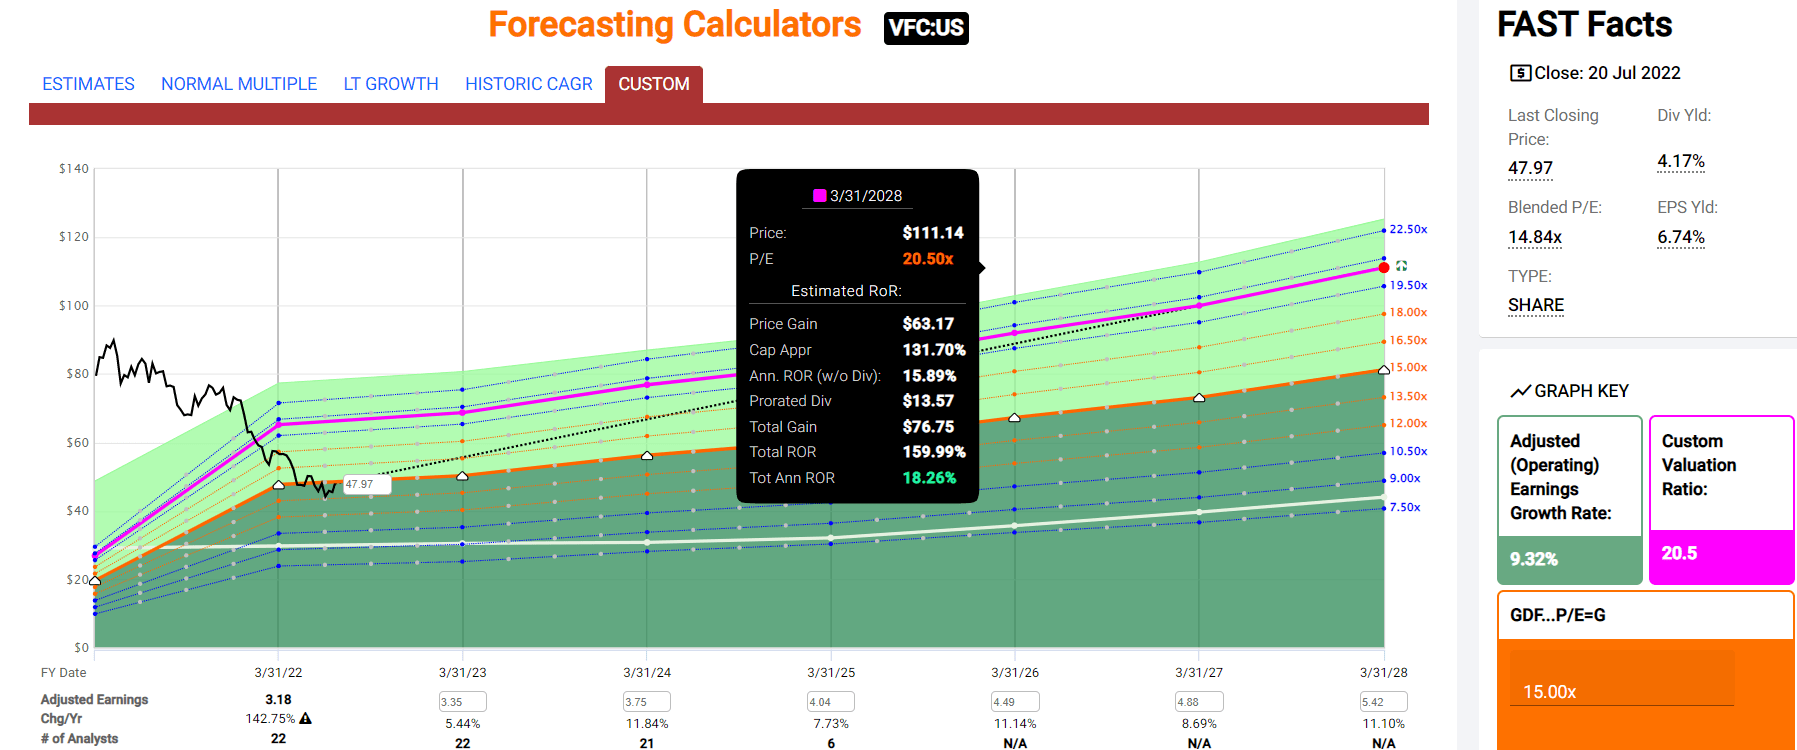
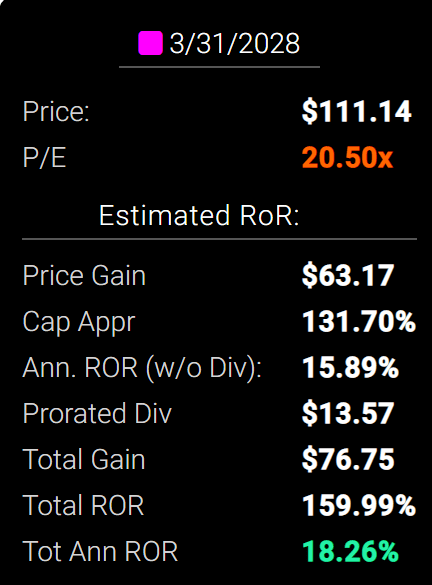
Analysts think VFC could deliver 160% total returns through March 2028, 18% annually.
- Buffett-like return potential from an Ultra SWAN dividend king bargain hiding in plain sight
- about 3X the S&P 500 consensus.
VFC Investment Decision Score
DK (Source: DK Automated Investment Decision Tool)
For anyone comfortable with its risk profile, VFC is one of the most reasonable and prudent high-yield aristocrats you can buy today.
- 37% discount vs 2% market discount = 35% better valuation
- 4.2% yield vs. 1.7% yield (and a much safer yield at that)
- 1.5X better long-term return consensus
- 2X better risk-adjusted expected return over the next five years
- 29% of your investment repaid in consensus dividends within five years, 3X more than the S&P 500.
Bottom Line: Not Every Aristocrat Is Worth Buying, But Fresenius And V.F. Corp Are High-Yield Aristocrats Potentially Set To Soar And Too Cheap To Ignore
The Dividend Aristocrats are a great group of companies, and anyone buying NOBL, the aristocrat exchange-traded fund (“ETF”), is likely to be pleased with around 11% long-term returns and lower volatility than the market during downturns.
However, NOBL has a few key drawbacks.
- it ignores anything not in the S&P 500
- including amazing foreign aristocrats like FMS, ENB, NVS, etc.
I’m not saying that you should only buy aristocrats; after all a 25-year dividend growth streak excludes such amazing future aristocrats as
Not all aristocrats are worth buying. Here are the five lowest quality ones I’d made sure to avoid.
Not all aristocrats are undervalued, despite the current bear market. Here are the five most overvalued aristocrats I’d avoid.
On the other hand, in this market of stocks, not a stock market, amazing bargains are plentiful.
FMS is an anti-bubble high-yield German aristocrat that analysts think could deliver 51% total returns in just the next year alone. And its fundamentals justify even more, along with the potential for 235% total returns in the next five years.
- 4X more than the S&P 500’s bear market recovery rally potential
Meanwhile, after getting slammed in the Pandemic, V.F. Corp is rapidly recovering, but fears of a 2023 recession have caused it to collapse.
- 12.3X cash-adjusted earnings
- and valuations only seen in severe recessionary bear markets
V.F. Corp Is Already Pricing In A Recession
(Source: FAST Graphs, FactSet Research)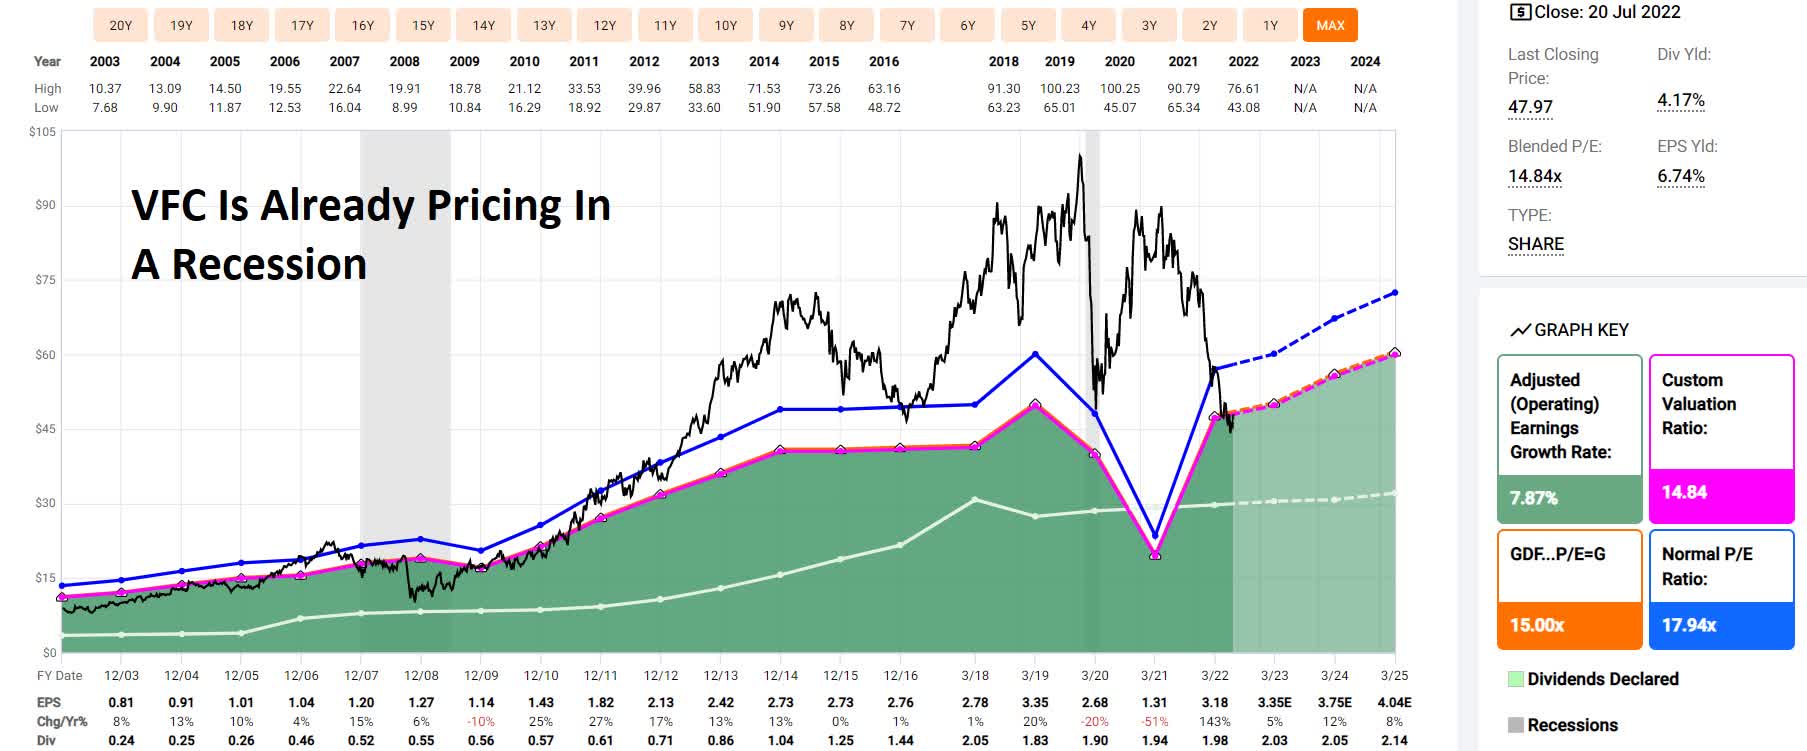
Right now, investor sentiment overall, but especially for FMS and VFC, is so low that it won’t take much for them to bottom and likely take off like a rocket.
The intelligent investor is a realist who buys from pessimists, and sells to optimists.” – Ben Graham
I can’t tell you when these companies will bottom, but I can tell you that their very bullish 12-month analyst forecasts are more than justified by strong fundamentals, good risk management, proven management teams, and dividend dependability that’s the stuff of legends.
Do you know the life outcome when you buy deep-value aristocrats in a bear market?
Charlie Bilello
How about life-changing returns, in addition to generous, safe, and steadily growing income.
Smart deep value aristocrat investing isn’t just about earnings safe income; it’s potentially one of the lowest risk ways to retire in safety and splendor.
Be the first to comment