


LumerB
This article was published on Dividend Kings on Tuesday, November 29.
High-yield investing is exciting, tantalizing, and offers the promise of the rich retirement of your dreams.
Imagine being able to earn double-digit returns from pure income alone! Imagine being able to ignore stock prices forever, and just off income alone!
Imagine the average retired couple with $510,000 in 401K savings at age 65 and the following retirement scenario.
- retire at 65
- 100% invested into a 10% yielding portfolio
- 5% annual withdrawal rate
- 2.7% post-withdrawal, inflation-adjusted return
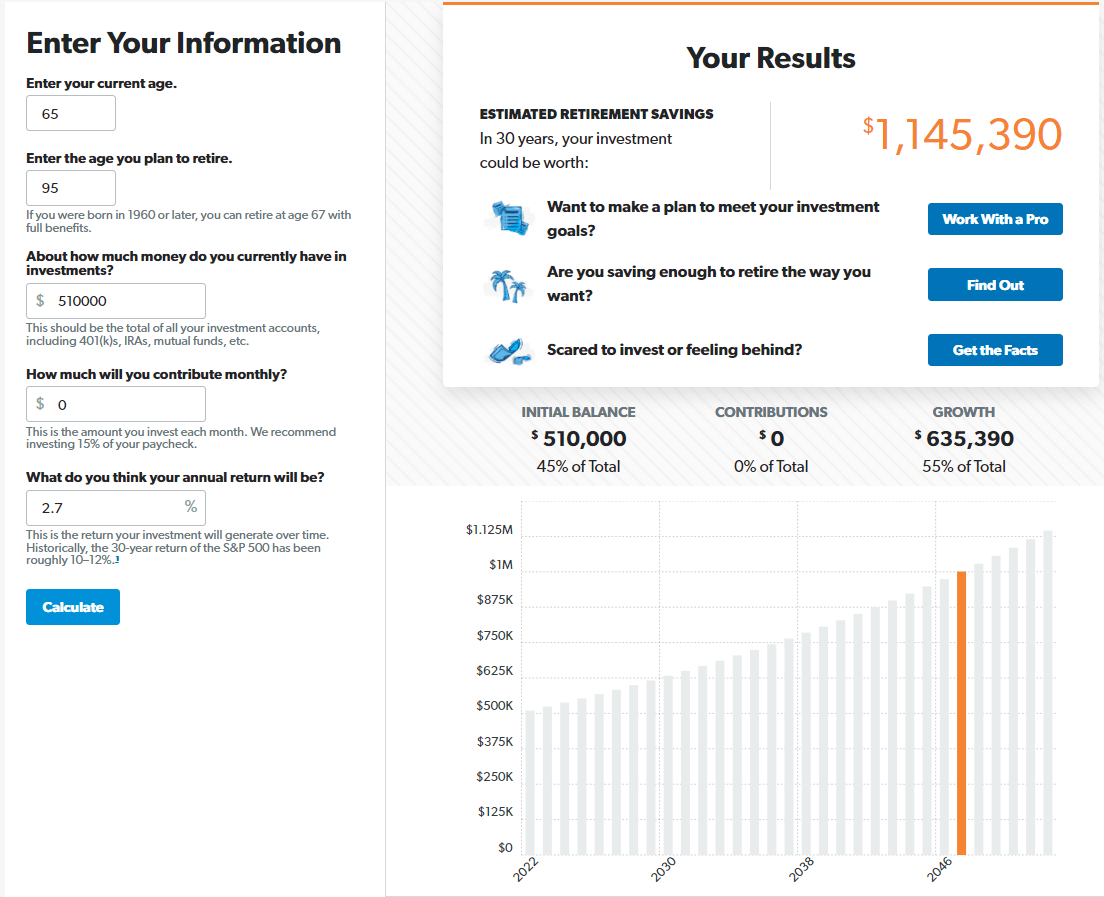
(Source: Dave Ramsey Investment Calculator)
After a 30-year retirement this average retired couple, adjusted for inflation, would have more than doubled their money! While enjoying:
- an average $41K per year in income
- $1.23 million cumulative inflation-adjusted dividend income
- $81,250 per year average income including Social Security
- $2.44 million cumulative inflation-adjusted retirement income
- inflation-adjusted income after 30 years: $97,250
The average retired couple after the age of 75 spends $40,000 per year, so passive income from this ultra-yield strategy covers that 2.5X.
That’s true financial independence, and it’s why double-digit yielding stocks are so popular.
If you screen Yahoo finance for 10+% dividend yields here is what you’ll find 454 US stocks alone that offer such a mouth-watering yield. Throw in CEFs, mutual funds and ETFs and the number soars to almost 1,000.
But of course, when it comes to ultra-yield investing the devil is always in the details.
Today I wanted to show why ultra-yield CEFs, royalty trusts, and mREITs are three of the most dangerous high-yield investing strategies you can use. These are dangerous yield traps that can kill your retirement dreams.
In order to win the game, first you must not lose it.” – Chuck Noll
I’ll show you exactly why, using three specific stocks that DK members recently have asked me to analyze.
- Cornerstone Strategic Value Fund (NYSE:CLM) a popular CEF yielding 17.9%
- San Juan Basin Royalty Trust (NYSE:SJT) a red hot oil stock with a 14.7% yield
So let’s take a look at why you should run, not walk, away from these low quality yield traps, to protect your hard earned savings, and your rich retirement dreams.
Beware Of Ultra-Yield CEFs
Closed end funds are popular because they tend to offer sky-high yield and often pay out monthly distributions.
Cornerstone Strategic Value is one of the oldest such CEFs on Wall Street, which launched in November 1988.
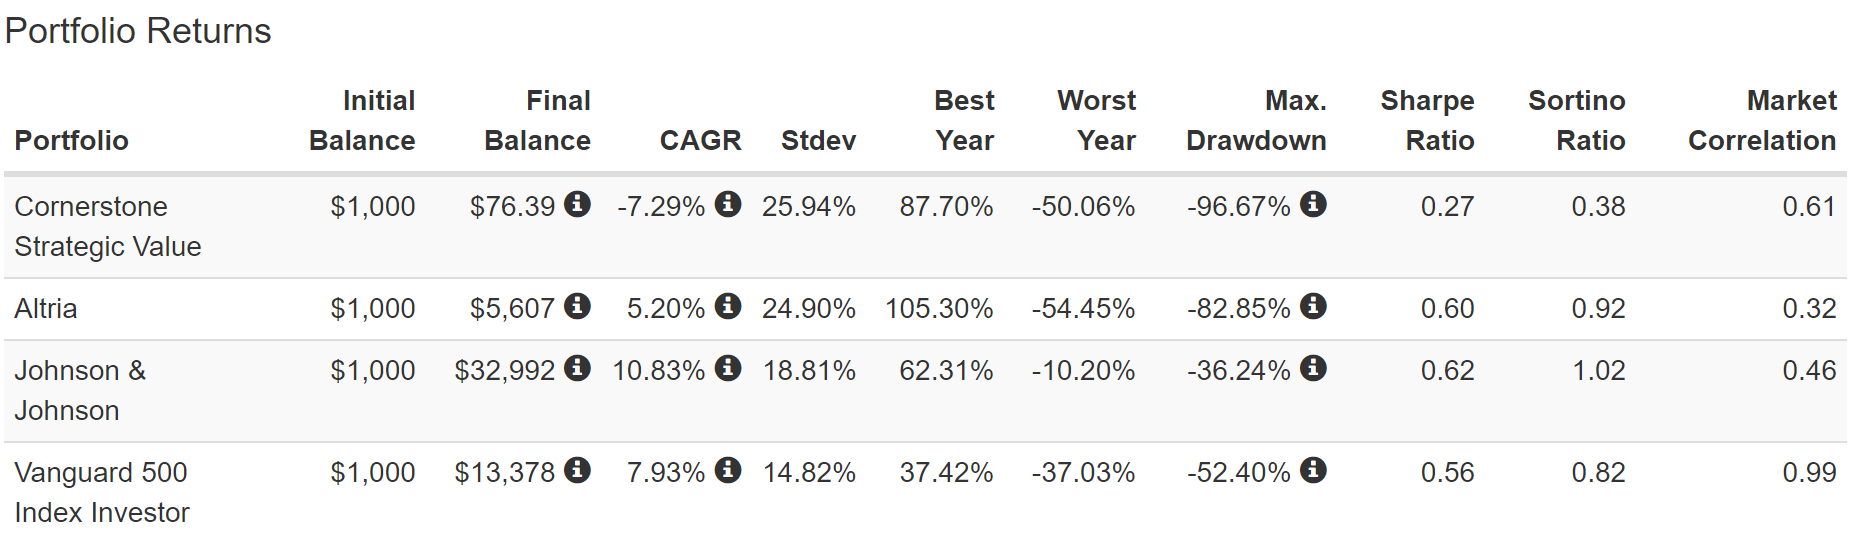
Total Returns Since December 1988
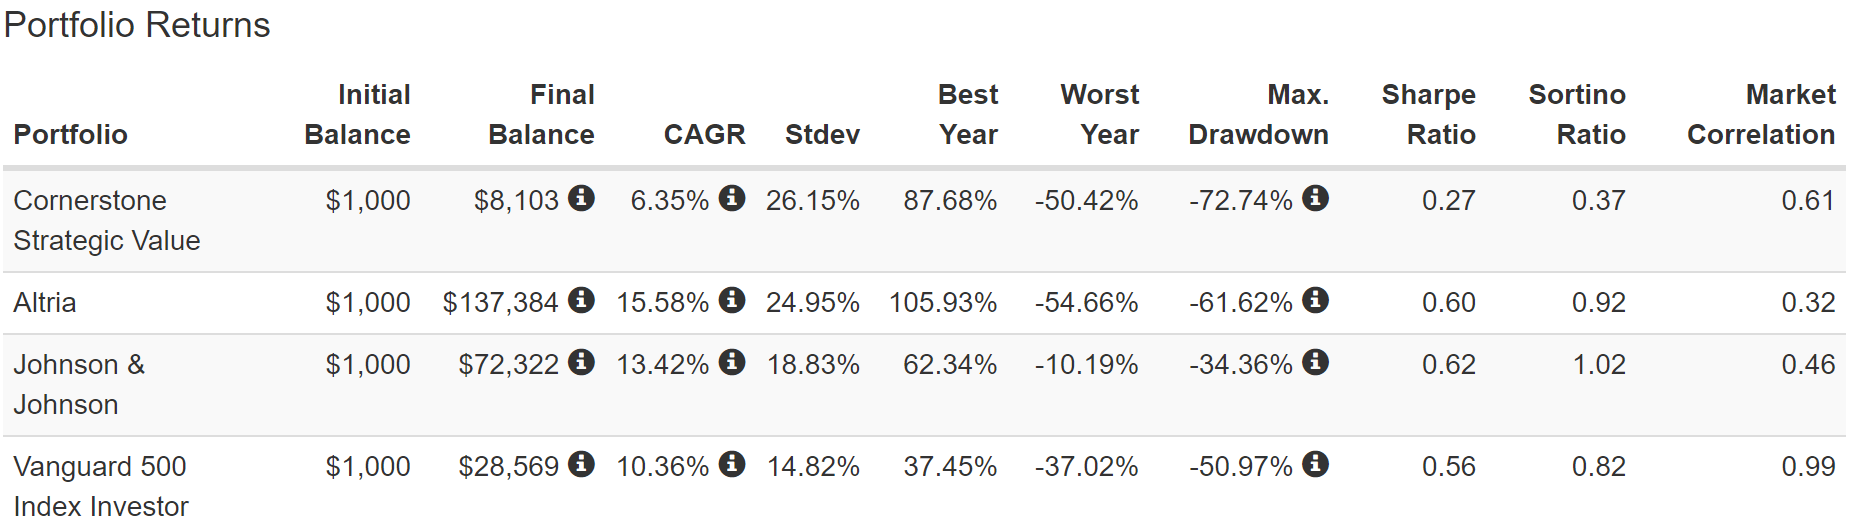
Portfolio Visualizer Premium
At first glance, CLM appears to have delivered pretty good returns. Sure, they were half as good as dividend kings like Altria (MO) and Johnson & Johnson (JNJ), but investors still made money right?
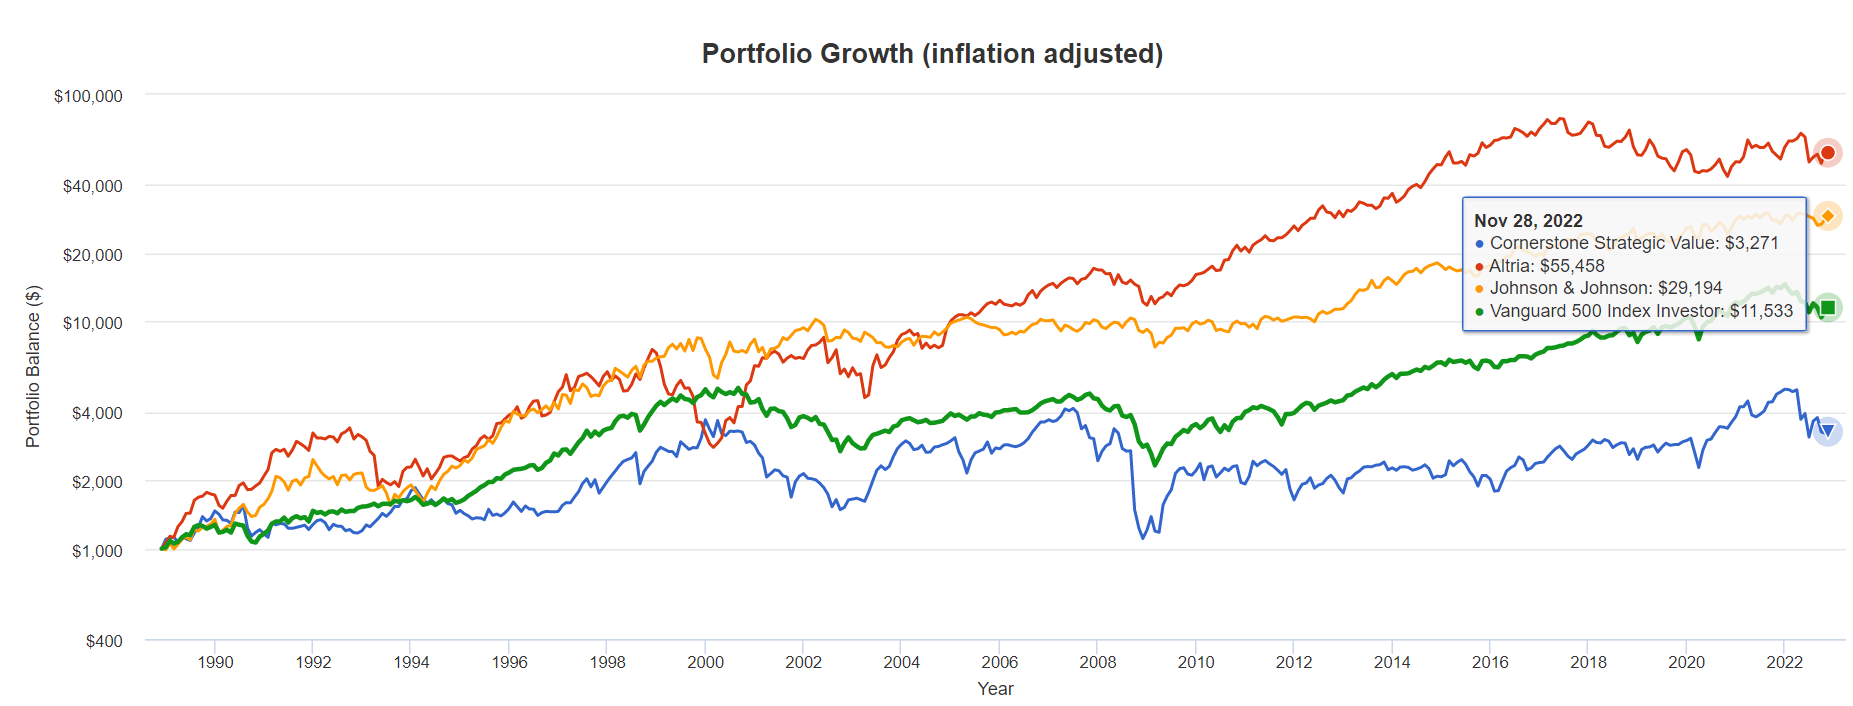
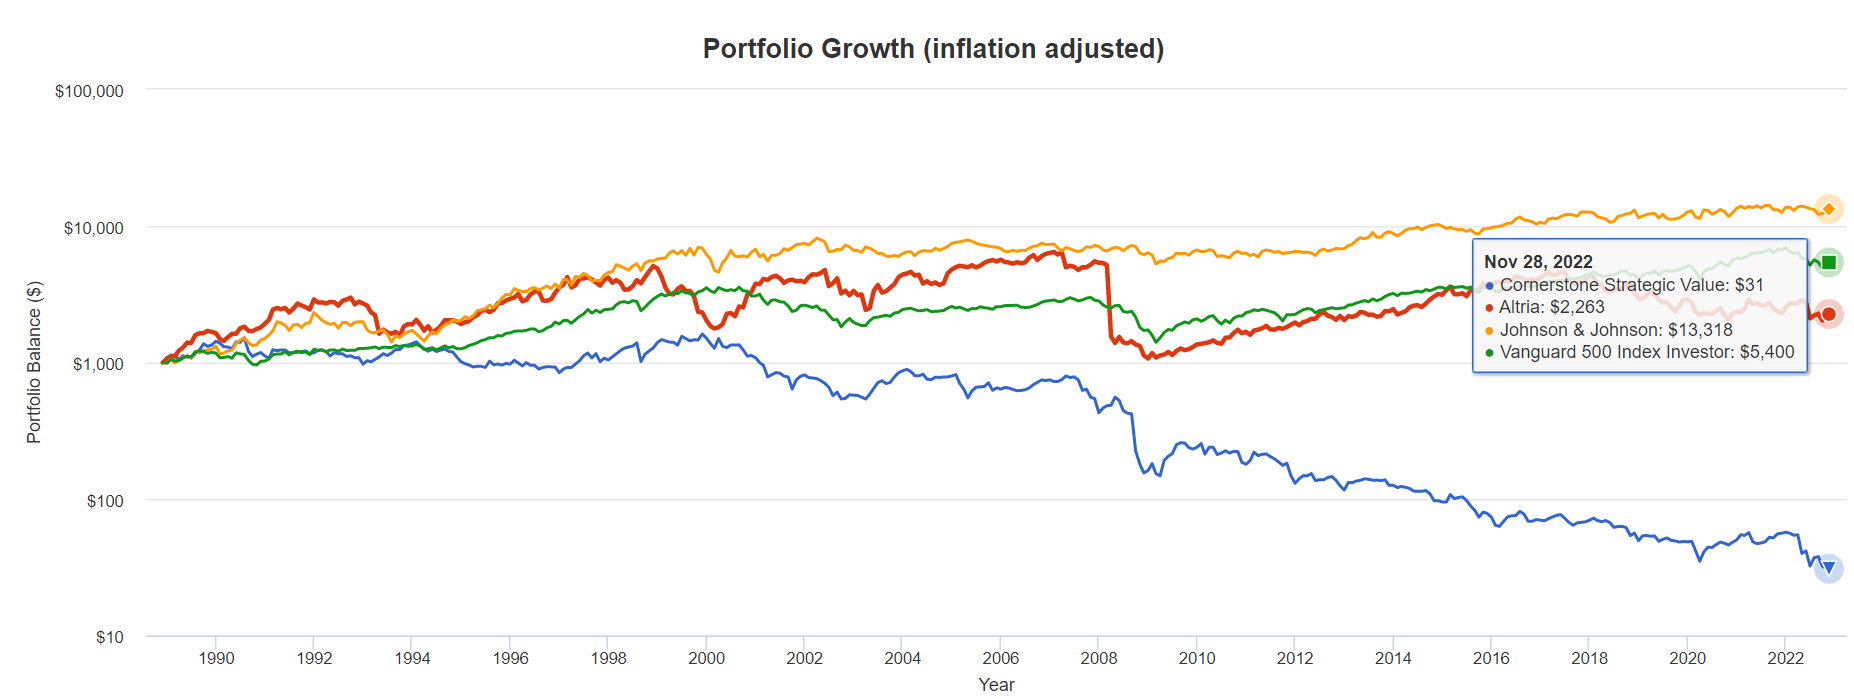
Portfolio Visualizer Premium
Even factoring in inflation, CLM investors APPEAR to have more than tripled their money.
Yes, the volatility was pretty extreme, including a 73% peak decline in the Great Recession, but buy and hold investors didn’t lose money. So how is this a yield/value trap?
The key with CLM and all high-yield CEFs is in how they are structured, and whether or not you reinvest the distributions or take your income in cash.
Remember CLM yields 18%, and has historically always yielded double digits. So how did it only generate 6% annual returns?
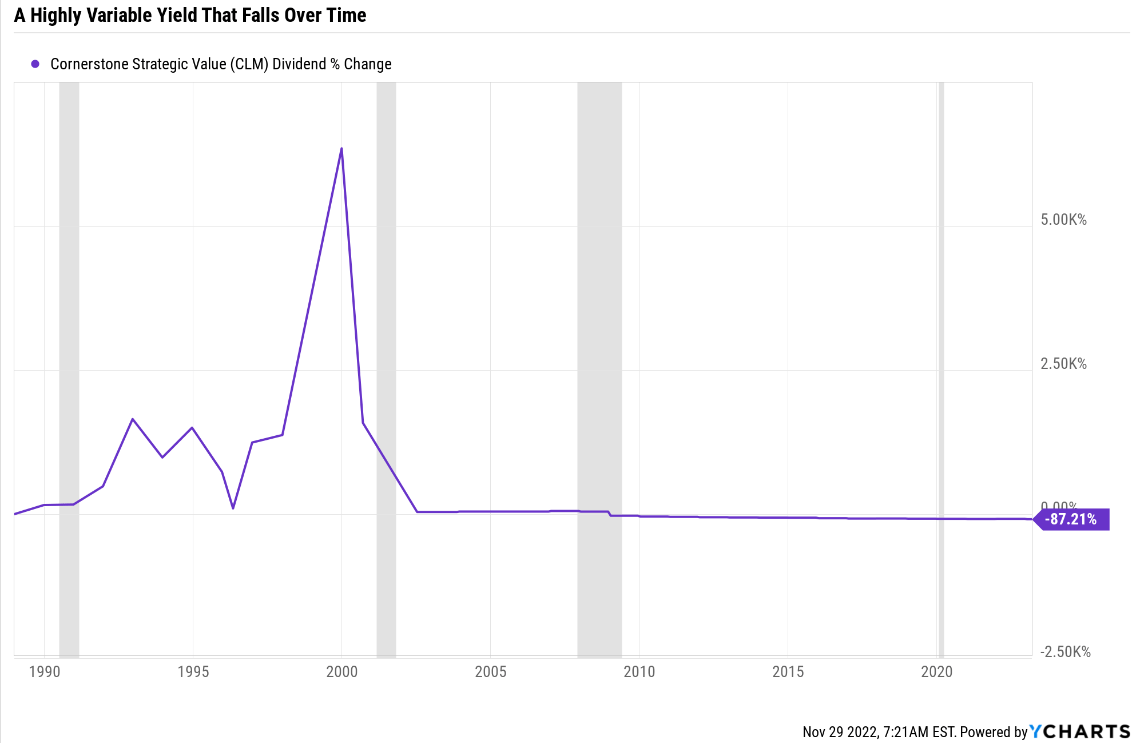
Ycharts
The answer lies in its variable payout policy which has resulted in the distribution falling by 8.5% annually for nearly a quarter century.
Total Returns Since December 1988 (Dividends In Cash, Not Reinvested)
Portfolio Visualizer Premium
If you take your dividends in cash, to live on in retirement, and don’t reinvest them, then total returns will equal yield + long-term income growth.
And with CLM that is a highly negative number, thus resulting in a $1,000 investment ending up worth $76 after 24 years.
But wait it gets worse.
Portfolio Visualizer Premium
| Stock | Ticker | Inflation-Adjusted Return Since 1988 | Annual Real Return Since 1988 |
| Cornerstone Strategic Value | CLM | -97% | -13.5% |
| Altria | MO | 126% | 3.5% |
| Johnson & Johnson | JNJ | 1232% | 11.4% |
| S&P | SPY | 440% | 7.3% |
(Source: Portfolio Visualizer Premium)
Do you know what we call an investment that loses 97% of its real value over time, and has a negative 8.5% annual dividend growth rate? A value and yield trap.
This is the Buffett-inspired DK value trap test and it’s very simple.
- if a stock’s dividends are taken in cash and not reinvested
- and it’s inflation-adjusted returns are negative over 20+ years
- then there is a 91% statistical probability it’s a fundamentally flawed investment
- you should avoid like the plague
- no matter how attractive the yield might appear
- or how low the valuation
Why CLM Is A Value/Yield Trap
Why is CLM such a terrible high-yield investment over the long-term? That comes down to its fundamentals, or how it’s run.

Nuveen
CEFs often use managed distribution policies, meaning they pay out a fixed amount of their investable capital each month.
In the case of CLM it’s 2.2% of NAV each month.
Or to put another way, in order for CLM’s 18% yield to be sustainable the fund managers would have to generate 26.3% annual returns.
- Buffett is the greatest investor of all time
- 20.5% annual returns for 55 years at Berkshire
What kind of strategy does CLM attempt to use to generate the greatest investment returns in history? Is it some advanced quant trading strategy? Leverage? Options? Other kinds of derivatives?
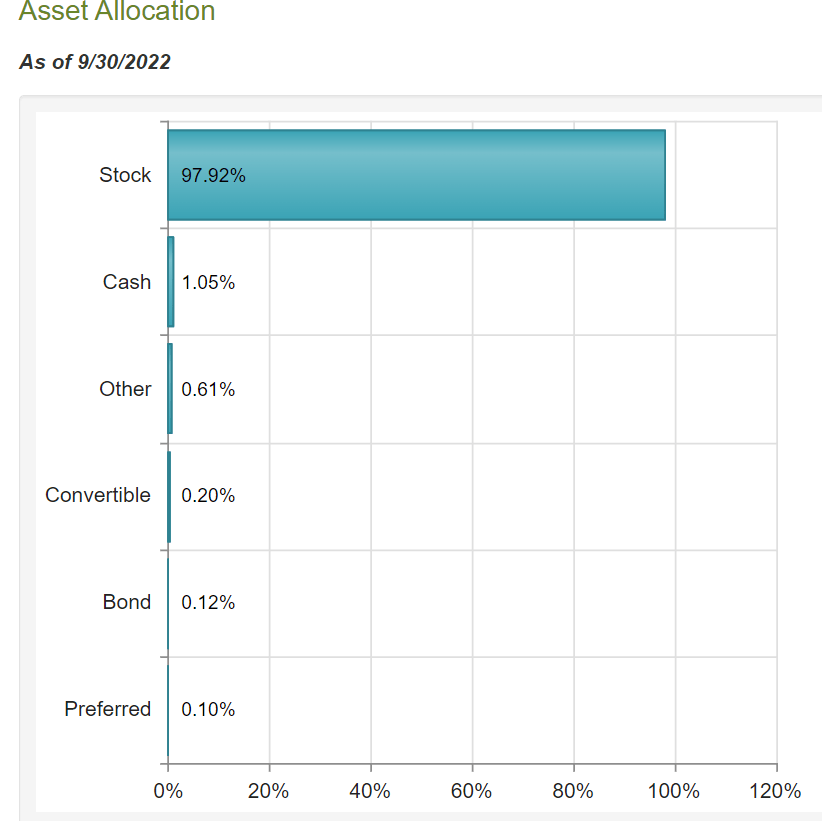
Nuveen
This is a stock based CEF. One that doesn’t use leverage and charges a modest 1% fee plus 0.12% additional expenses.
- 1.12% annual fee to lose your money at a 13.5% annual rate
OK, so the managers of this CEF must have some powerful investing strategy right? One based on value along the lines of what Buffett and Graham used early on?
After all, 26% annual returns are almost 2X as high as Cathie Wood is trying to achieve at ARKK. What kind of magic companies does CLM’s management think can deliver long-term Buffett-beating returns?
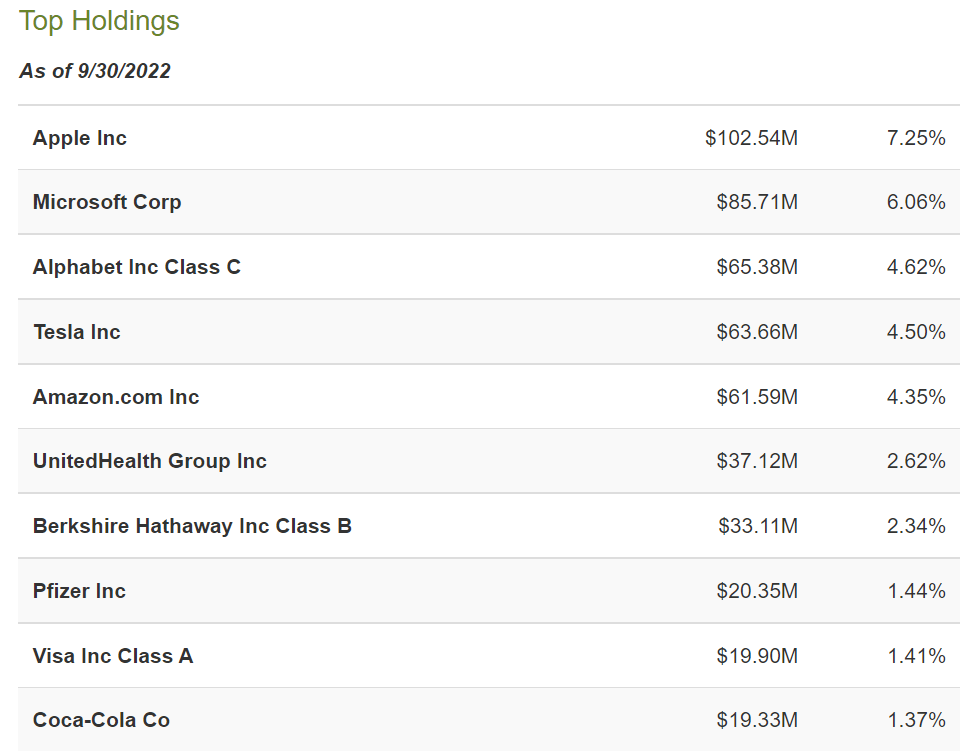
Nuveen
These are all famous world-beater blue chips. Does this allocation to these companies seem familiar? It should.
S&P 500
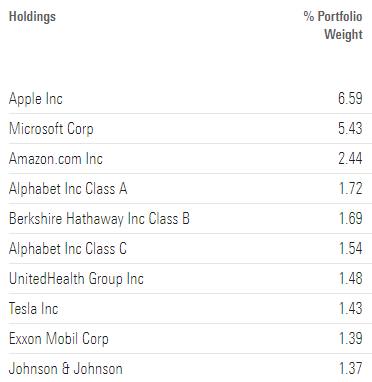
Morningstar
CLM is basically mirroring the S&P 500 with almost all of its $1.4 billion in assets under management.
But wait a second. The S&P’s historical returns over the last 20 to 206 years is about 10% per year. So how does management think that it can sustainably pay out 2.2% of assets each month investing in the US stock market?
The answer is simple. They can’t and never expected to.
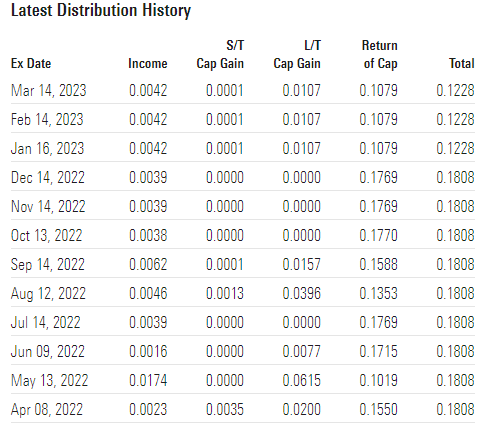
Morningstar
When you see a CEF paying out 87% of its distributions as return of capital, for over 20 years, it means that management isn’t generating income for you.
They are simply giving you back your own money and calling it a dividend.
Isn’t this a ponzi scheme?
When a fund distributes more than it earns, and it uses investors’ own capital to make up the difference, isn’t that a classic Ponzi scheme?
No. In a Ponzi scheme, new investors are continually brought in to pay the lofty returns promised to existing investors, while the perpetrator of the fraud siphons off money. Ultimately, the scheme collapses when the promoter disappears, the number of new recruits slows or investors start demanding their money back.
This is fundamentally different from a mutual fund that pays out more than it makes. When a cash distribution includes return of capital, investors are essentially getting a portion of their own money back, and their capital in the fund will fall by a corresponding amount. However, their units are backed by real assets, and they can redeem them at any time, unlike a Ponzi scheme, where the money may be tied up in a criminal’s yacht collection or Nigerian bank account.” – Global Mail
No, because of several important distinctions.
But if CLM’s long-term cash returns are so terrible, and its underlying investment strategy is so terribly unsustainable, then why does it exist at all?
- 1.12% annual fees on $1.4 billion in assets = $15 million in annual management fees
Management is making money, and that’s all that matters to Cornerstone.
It’s why they created this CEF and why so many ultra-yield CEFs exist.
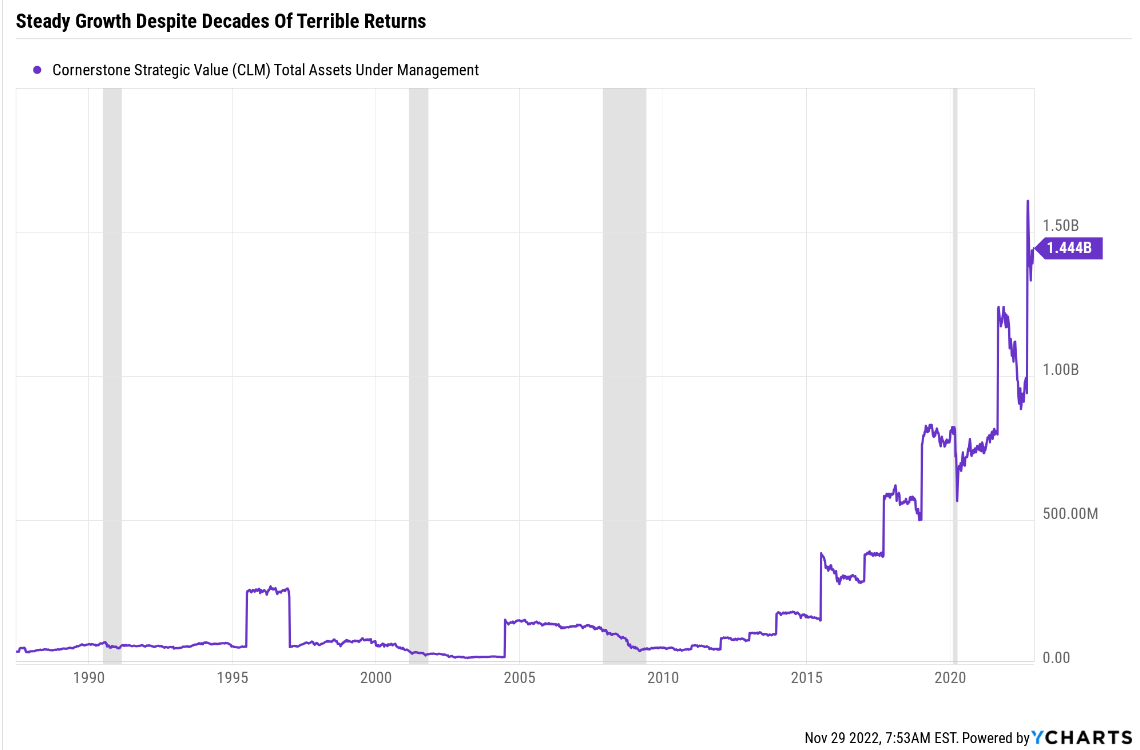
Ycharts
CLM has collected an average of approximately $7.5 million per year in fees, for a quarter century.
- approximately $180 million in cumulative fees
You might think that such terrible real returns for so long might cause investors to abandon this CEF and all those like it.
But remember that CLM’s total returns, if you invest the dividends, are approximately 3% after inflation.
- as long as investors never take dividends in cash and always reinvest the dividends, they make returns equal to 40% of the S&P 500 over the very long term
In other words, while CLM is a yield trap and a value trap, investors don’t realize it.
How does anyone find this thing? By screening for maximum yield on places like Yahoo Finance.
And unless you understand how CEFs work, and where to look to perform due diligence to verify whether they are sustainable, you can easily fall for this value trap or others like it.
- Preparing For Recession Part 22: 5 Safe High-Yield Monthly Paying CEFs To Consider
- Preparing For Recession Part 25: Introducing The DK Great ETF/CEF Database
The good news is that there are five high-quality high-yield CEFs that have been providing decades of monthly 6% to 7% income for retirees.
The bad news? There are just five high quality CEFs that we can recommend that aren’t yield traps.
- stock based CEFs are almost always yield traps
- bond CEFS are much safer
Beware Of Royalty Trusts
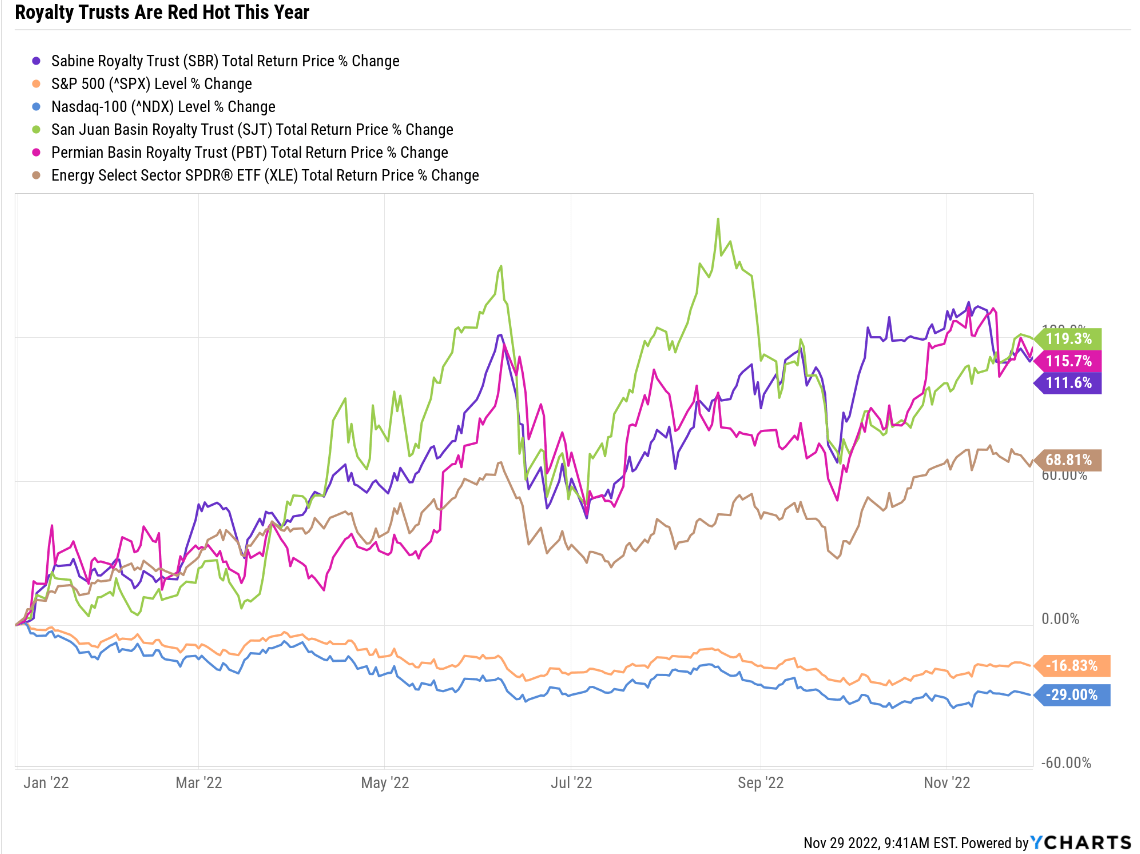
Ycharts
Energy is the best performing sector of the year thanks to oil prices soaring after the Russian invasion of Ukraine.
Royalty trusts like SJT are doing twice as well. Why? Because royalty trusts are a stock with a single asset, the cash flow from royalty payments, usually oil and gas but sometimes other commodities.
While oil companies like Exxon (XOM) or Chevron (CVX) are highly leveraged to oil and gas prices, royalty trusts like SJT are a pure undiluted play on energy prices.
Total Returns Since November 1987 (Dividends Reinvested)
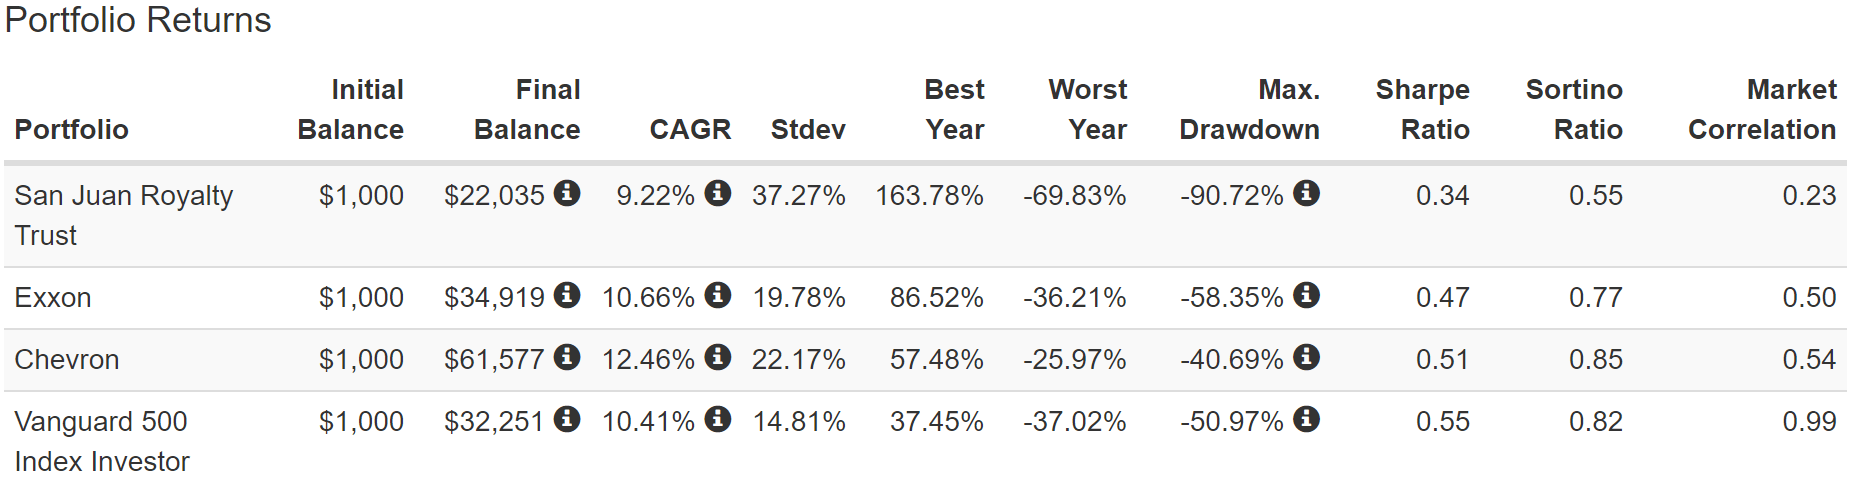
Portfolio Visualizer Premium
At first glance you might think that oil trusts are a good long-term investment. And historically that’s actually been true.
But let’s see what happens when we run SJT and the oil aristocrats through the value trap test.
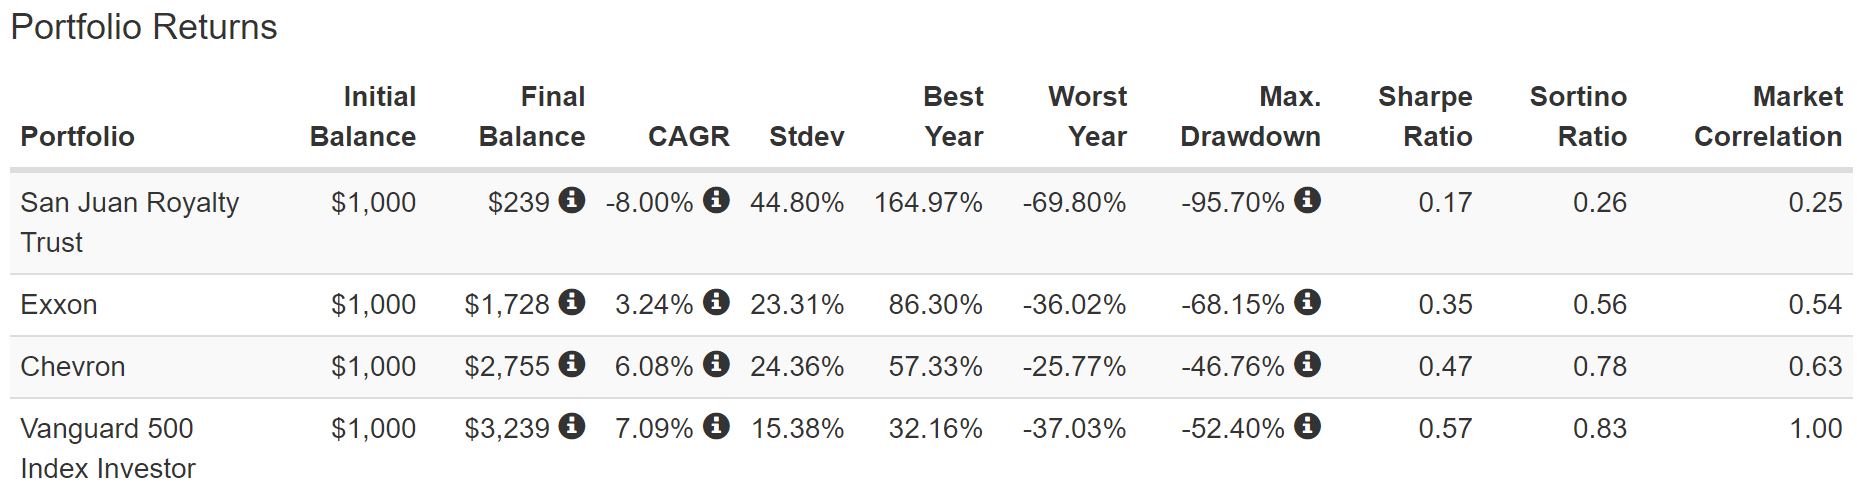
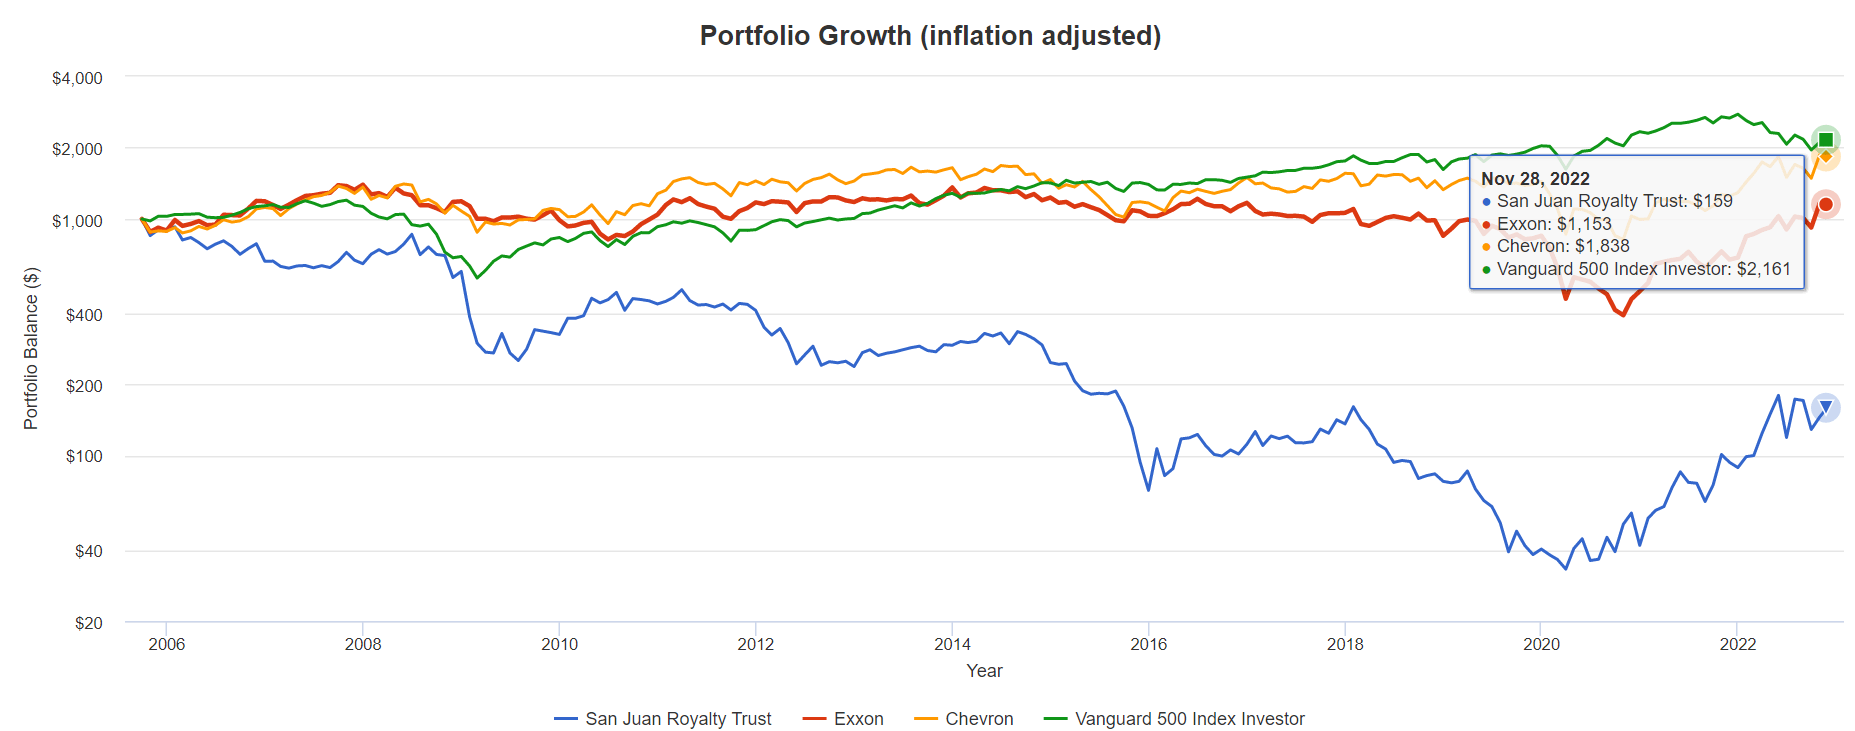
Total Returns Since November 1987 (Dividends In Cash)
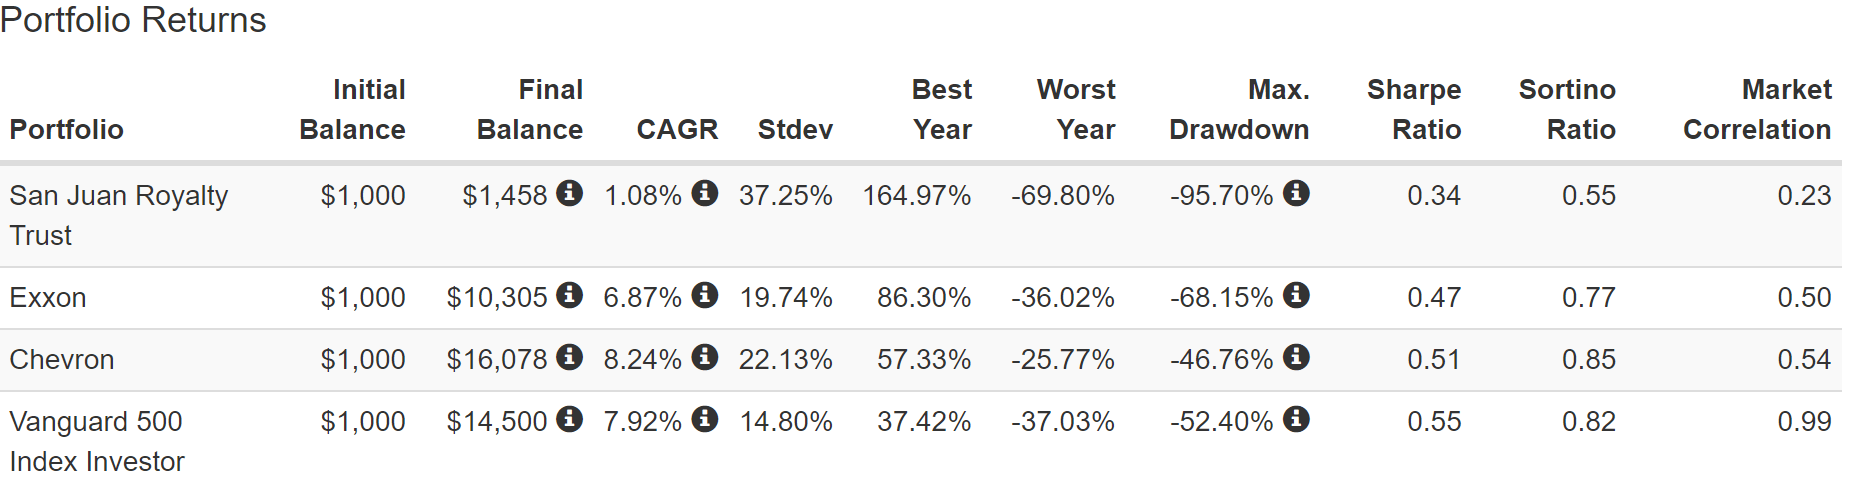
Portfolio Visualizer Premium
If you had taken all your dividends in cash, then over the last quarter century SJT would have delivered almost zero returns.
Portfolio Visualizer Premium
| Stock | Ticker | Inflation-Adjusted Return Since 1988 | Annual Real Return Since 1988 |
| San Juan Basin Trust | SJT | -44% | -2.4% |
| Exxon | XOM | 299% | 5.9% |
| Chevron | CVX | 522% | 7.9% |
| S&P | SPY | 461% | 7.5% |
(Source: Portfolio Visualizer Premium)
SJT has proven a value trap for long-term income investors over time though not nearly as terrible as CLM.
But oil aristocrats proved to be far better investments if you were taking all your dividends in cash.
Why? Because oil companies are corporations run by skilled management that can adapt to falling oil prices. Royalty trusts have no recourse when energy prices fall.
They are a single asset stock and are completely at the mercy of volatile commodity prices.

(Source: Portfolio Visualizer Premium)
Exxon and Chevron, with no dividend reinvestment, have continued to provide steadily growing income, because they are two of the most conservatively managed oil companies in the world.
Do you know the only thing that gives me pleasure? It’s to see my dividends coming in.” – John D. Rockefeller
They were spun off from Standard Oil, whose founder, John Rockefeller, was famous for his love of dividends.
- likely the reason they are the only two aristocrats among big oil companies
Note how SJT’s income is incredibly volatile, with a yield ranging from 2.0% in 2020 (when oil hit -$38) to 40.7% in 2005.
- 2005 was during oil super cycle when oil peaked at $147 in 2008
Today SJT’s distribution is once more sky-high, thanks to booming oil prices.
Cumulative Dividends Since 1988: $1,000 Initial Investment, No Dividend Reinvestment
| Metric | Exxon | Chevron | San Juan Basin Trust |
| Total Dividends | $5,376 | $7,670 | $4,686 |
| Total Inflation-Adjusted Dividends | $2,083.72 | $2,972.87 | $1,816.28 |
| Annualized Income Growth Rate | 8.2% | 9.5% | 1.1% |
| Total Income/Initial Investment % | 5.38 | 7.67 | 4.69 |
| Inflation-Adjusted Income/Initial Investment % | 2.08 | 2.97 | 1.82 |
| More Inflation-Adjusted Income Than Exxon | NA | 1.43 | 0.87 |
| Starting Yield | 5.0% | 5.7% | 4.2% |
| Today’s Annual Dividend Return On Your Starting Investment (Yield On Cost) | 33.0% | 50.8% | 17.5% |
| 2022 Inflation-Adjusted Annual Dividend Return On Your Starting Investment (Inflation-Adjusted Yield On Cost) | 12.8% | 19.7% | 6.8% |
(Source: Portfolio Visualizer Premium)
When you don’t reinvest dividends and take your income in cash, only organic dividend growth can grow your income over time.
For SJT that organic growth rate is historically 1.1%. For Exxon and Chevron it’s 8.2% to 9.5%.
The power of consistent and dependable dividend growth every year, even when oil prices were crashing, resulted in more income than SJT delivered, along with far better inflation-adjusted post-cash returns.
In fact, XOM and CVX, if you bought them in late 1987 now have inflation-adjusted yield on costs of 12.8% and 19.7%, respectively.
This is the power of owning part of world-class oil giants with adaptable and skilled management.
What SJT Actually Owns

SJT Annual Report
SJT owns 75% of the royalty rights in the San Juan basin of Northern New Mexico. The land is drilled by Hilcorp, a private oil company. At the end of 2021 98% of SJT’s reserves were natural gas.
The major issue I have with all royalty trusts like this is that they are going to end one day.
The Trust will terminate if (a) its gross revenue for each of two successive years is less than $1 million per year or, if earlier, (b) the Unit Holders of at least 75% of all of the Units outstanding vote in favor of termination. Upon termination of the Trust, the Trustee must sell the Royalty and distribute the proceeds to Unit Holders after satisfying or establishing reserves to satisfy the liabilities of the Trust.” – SJT 10-K
Exxon and Chevron are essentially living corporations, buying and selling assets, and adapting their business models including to survive the energy transition.
Royalty trusts are temporary entities that can’t grow their assets over time. And their revenue isn’t just dependent on commodity prices either.
Hilcorp is the one making those royalty payments that investors are getting. If Hilcorp decides to ramp up production? Then it’s boom times for SJT (like in 2005).
If Hilcorp suffers a major setback? Such as an industrial accident that takes production off line? Then the cash flow can dry up, even if gas prices are high.
If Hilcorp decides to maximize free cash flow rather than production? As most energy companies are doing now? Then volume can decline and the royalty payments can fall short of expectations.
In other words, if you own SJT you’re effectively investing in Hilcorp. What is Hilcorp?
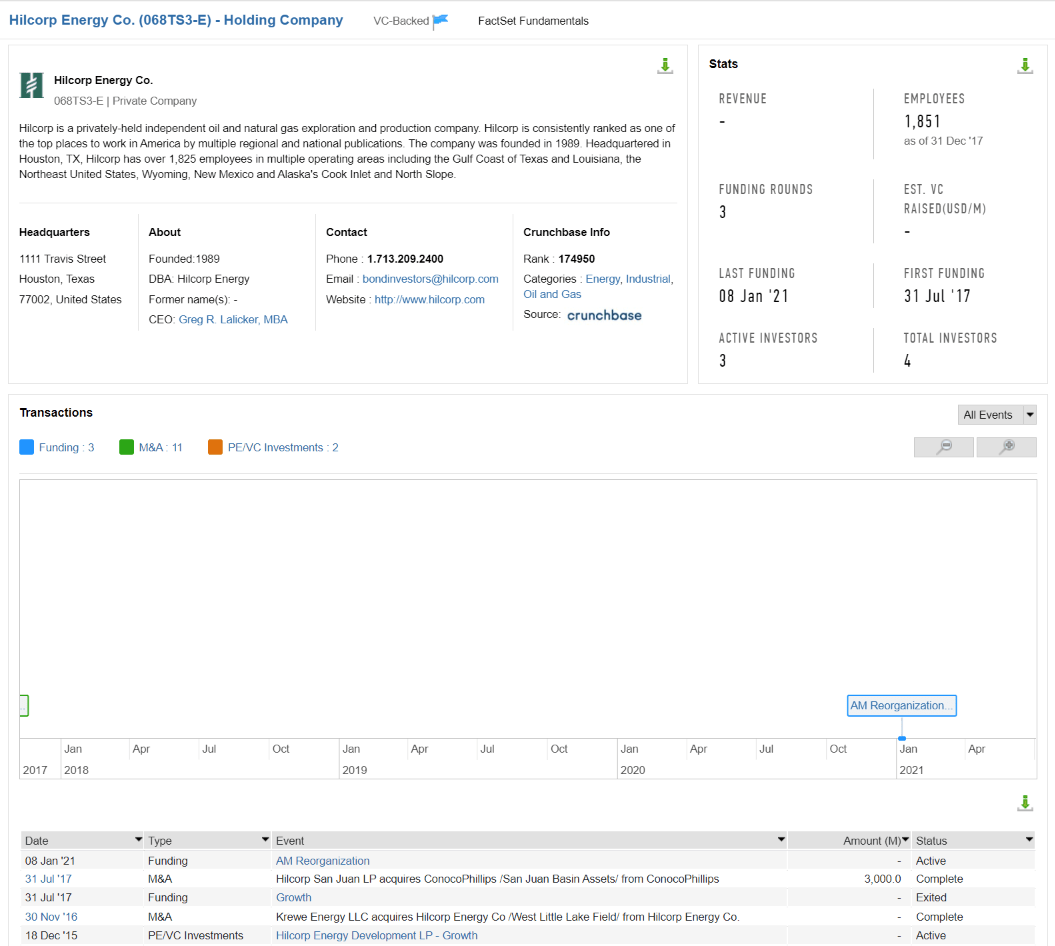
FactSet Research Terminal
Private investors in Hilcorp, or those with a FactSet or Bloomberg terminals, can find out that Hilcorp is a small 1,825 employee gas driller founded in 1989. One that ran into trouble and needed a reorganization funding round in early 2021.
- it was on the verge of bankruptcy but avoided it
Does this sound like something that you want to hitch your retirement income too?
SJT Annual Income Per $1,000 Investment (No Dividend Reinvestment)

Portfolio Visualizer
Does this kind of income volatility sound appealing?
Guess what? This is the risk profile of all royalty trusts.
- they eventually get liquidated (you can become a forced seller at the worst possible time)
Imagine that in a future oil crash SJT’s royalty income falls below $1 million for two years (not adjusted for inflation). The trust is liquidated and you are cashed out at a 50% loss.
Think that’s extreme?
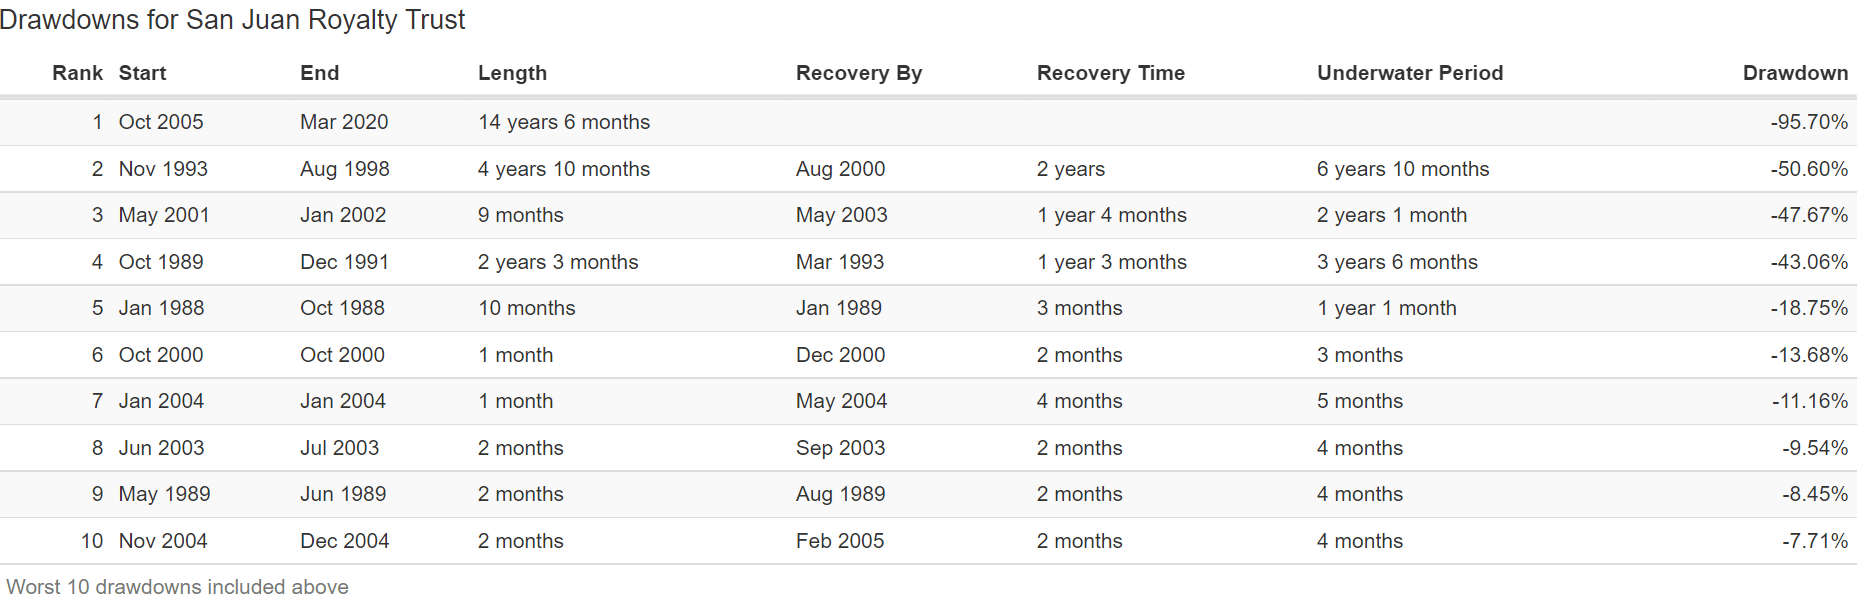
Portfolio Visualizer
SJT is still in its worst bear market in history, which began in October 2005, and has lasted for 14.5 years. It fell 96% by March 2020, and investors who bought at the 2005 peak might never break even.

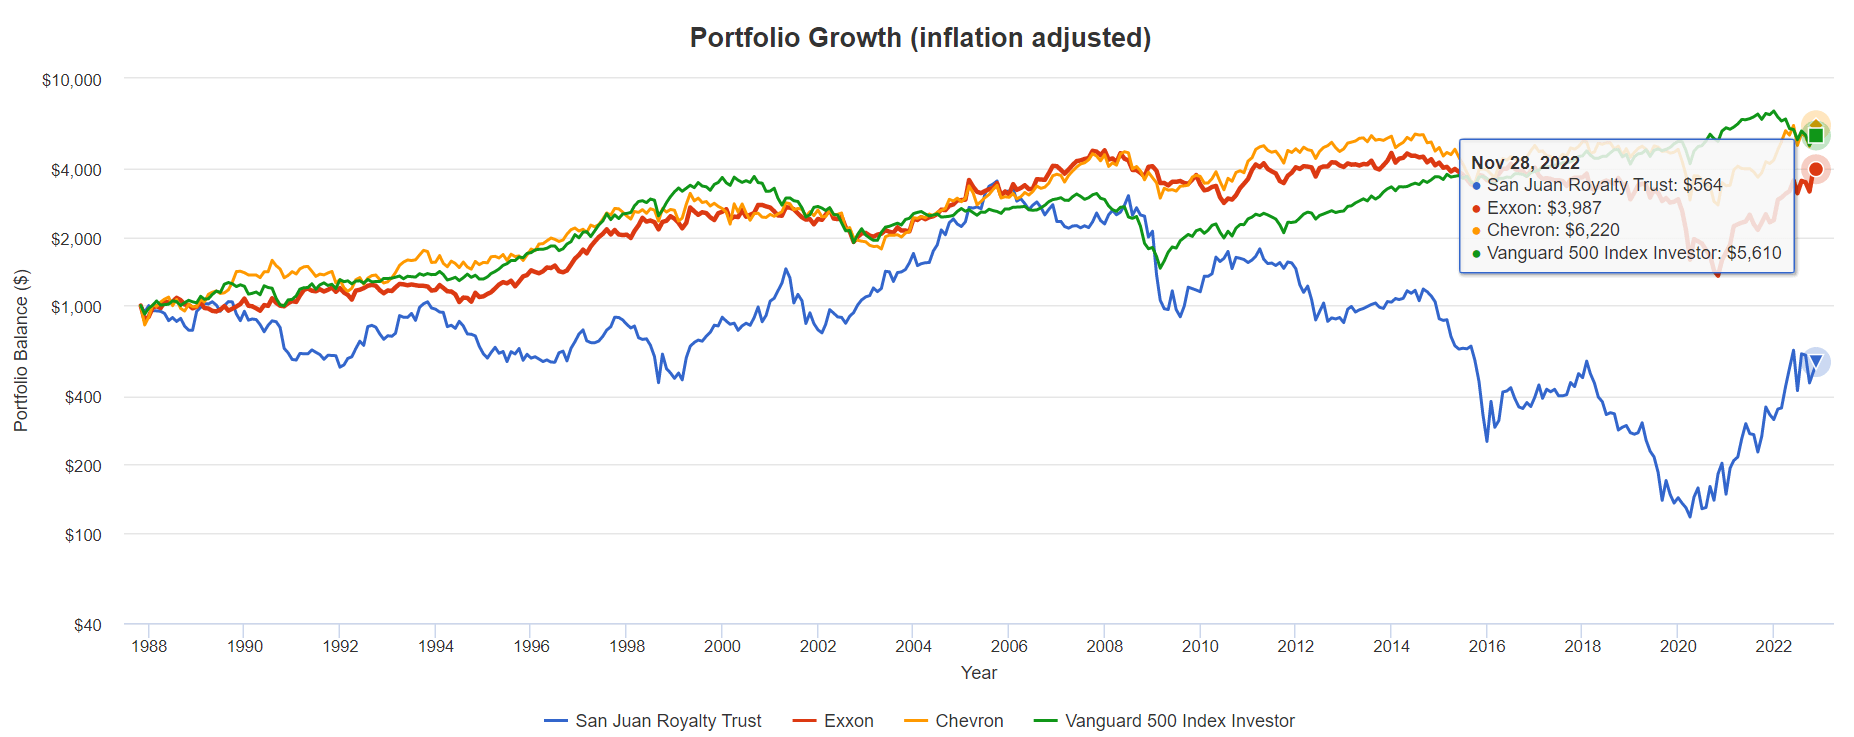
Portfolio Visualizer Premium
Exxon and Chevron has had long bear markets too, but nothing like the kind of crashes that SJT has suffered.
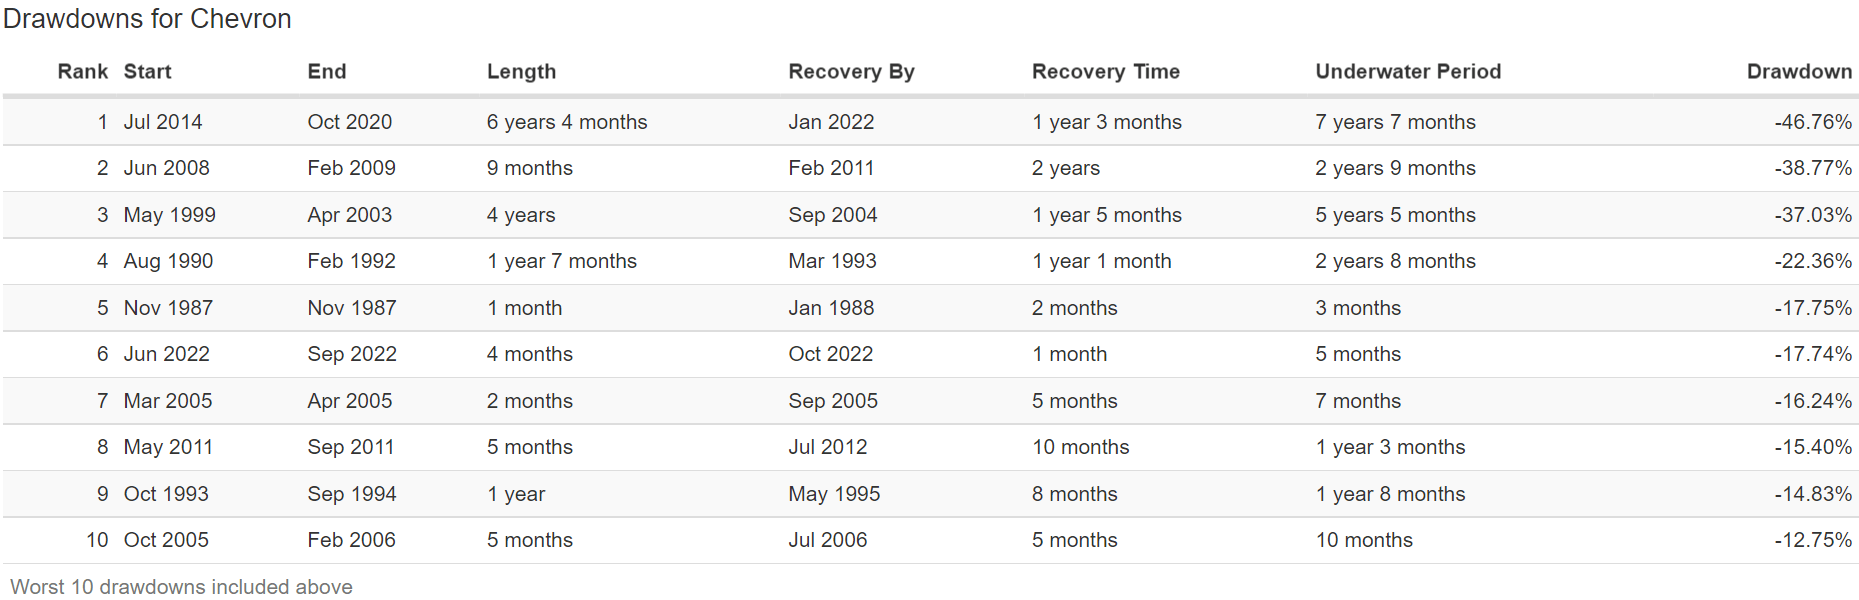
Portfolio Visualizer Premium
And while XOM and CVX can be very volatile at times, SJT is a lot more volatile.
Portfolio Visualizer Premium
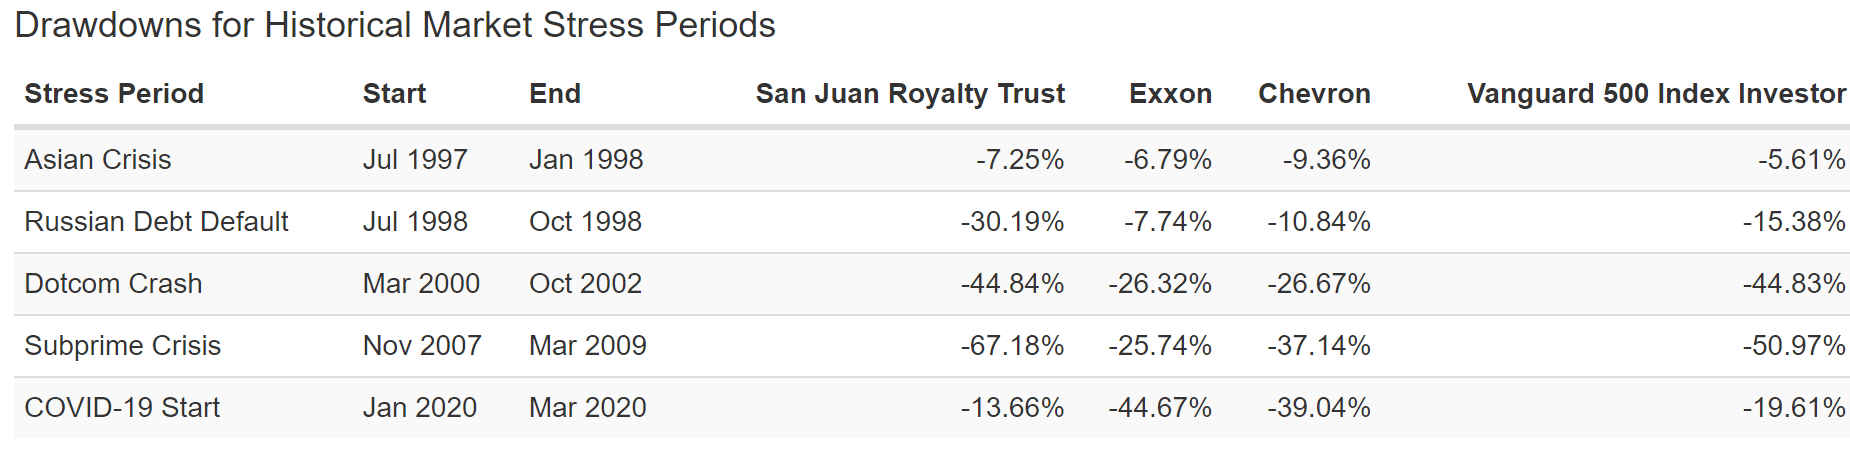
In the Great Recession XOM and CVX did a lot better than the market and SJT did a lot worse.
In the tech crash the same thing happened.
In the Russian default crisis? XOM and CVX were defensive and SJT fell off a cliff.
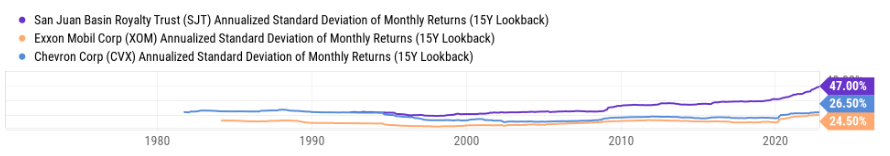
Ycharts
In any given year XOM and CVX might fall 24% to 27%. SJT can fall as much as 47%.
All for a limited life asset, that will one day cash you out, and most likely when the price has crashed along with energy prices.
For an income producing asset whose income is incredibly volatile and guaranteed to eventually go to zero.
Exxon and Chevron? They have plans to pivot to green energy and still be around in 100 years. SJT? It has virtually no chance of being around that long.
Bottom Line: Ultra-Yield CEFs And Royalty Trusts Can Kill Your Retirement If You’re Not Careful
Whenever you’re screening for yield, you have to remember that sky-high yield is a warning flag. There are some safe double-digit stocks out there, but they’re speculative.
- BDN and OMF are two worthy of consideration and MPW was yielding 12% a few weeks ago
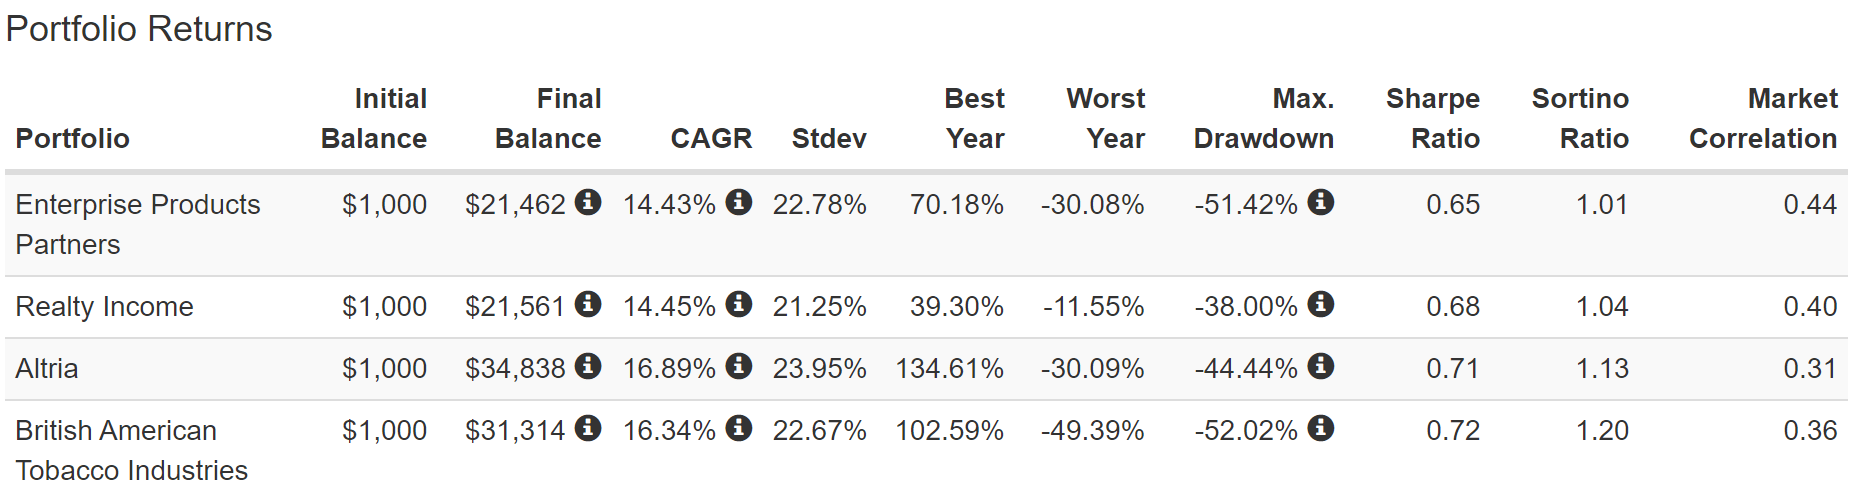
Blue-chip or even SWAN (sleep well at night) yields in the double digits can be found in recessions.
- EPD’s yield peaked at 17% in 2020 and 11% in 2009 and 2000
- MMP’s yield peaked at 19% in 2020
- MPLX’s yield peaked at 43% in 2020
- O’s yield peaked at 11% in 2000 and 2009
- MO’s yield peaked at 15% in 2008
When it comes to safe double-digit CEFs there are none. Are there variable paying CEFs and ETFs? Yes, such as QYLD, which use covered calls and options.
But whenever you see a double-digit yield, you need to be very skeptical about how sustainable those distributions or dividends are.
Royalty Trusts and some mining stocks can at times pay massive dividends, but these must be a very small part of your portfolio if you want stable income you can rely on.
And as we’ve just seen with SJT’s returns and income compared to oil aristocrats like XOM and CVX, over the long term world-class blue chips will always beat highly variable income sources. Especially ones with a liquidation date that is almost guaranteed to cause massive permanent losses for new investors.
My goal isn’t to scare you away from all ultra-yield stocks, just the dangerous yield and value traps that can destroy your retirement.
If you don’t believe me just ask SJT investors who bought in 2005 who are still sitting on massive losses.
Returns Since October 2005 (No Dividend Reinvestment)
Portfolio Visualizer Premium
Portfolio Visualizer Premium
SJT investors who bought in 2005 and took their distributions in cash are still down 84% adjusted for inflation. And they might never break even.
And CLM investors? They are down 97% adjusted for inflation... after 25 years.
In contrast, here’s what happens when you take advantage of double-digit blue-chip yield which periodically becomes available.
Total Returns Since March 2000 (The Great Tech Bubble Value Bear Market Bottom)
Portfolio Visualizer Premium
If you buy ultra-yield blue chips and SWANs in bear markets, you can retire rich. If you buy ultra-yield traps you might not retire at all.
The difference between the two is pure fundamentals, and that’s what I’ve devoted my life to studying and helping you understand.
Be the first to comment