

Vertigo3d
When you are a bear, everything looks bearish. You want to read bearish news; you want to talk bearishly. The market, however, doesn’t care a wooden nickel. In the market, you are either right or wrong, and you can measure that in money. If there is some secret illuminate controlling everything, then your job is to predict it. If it is truly a random walk, then it is your job to measure the noise and make money from it. You win because you are right, you lose because you are wrong. That is the beauty of markets, and a lot of people hate them because of that.
I don’t want to fight the bulls or beat the Street, etc., in general, there is no “they” driving things, and narrative is normally valueless. Making money from markets is a job and like all jobs you need tools. Charts are important.
Charts are meant to be useless because the future is not linked to the past. The past is clearly linked to the future as anyone who has worn their shirt for two days knows, but like it or not that connectivity is quite fragile, and you can make the argument that when that connection breaks you will lose all the money you made from when that connectivity was in place. Overall, the random walk view on markets is extremely strong, but there are good profits to be had where it isn’t.
In crypto, “the random walk” is not very strong at all. As such, charts are of particular use.
So here is an interesting example.
Bitcoin (BTC-USD) appears to be very cyclical in a calendar sense. Here is a chart showing that:
ADVFN.com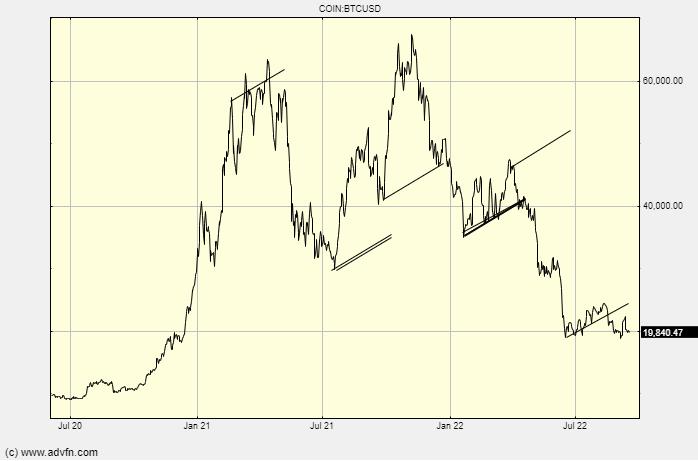
It seems that three months is an important period. People are very good at finding patterns that are not real, but you can clearly see the quarterly-sized action here. This is interesting because we are at the end of the latest small cycle, and to a bear, it says we are soon on the way down. For me, this would be the last wave down.
If you look at the same charts as everyone else and use the same techniques as in the old books, it’s likely that won’t work. Markets morph to trade away obvious edges. You have to look at things differently in order to see what others don’t.
I like to look at very long-term charts for that as, in general, most people only care about the recent now.
So, this chart of BTC is interesting:
ADVFN.com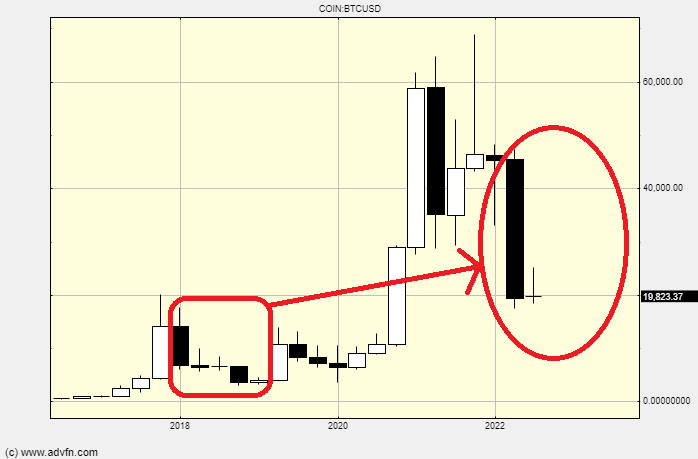
I am, of course, implying repetition, and I think we are quite likely to get it. 2024 is the year of the “halvening” and that is the ETA for the next big rally, so a bear market until then seems very plausible.
I would not argue against a long campaign of stake building at these levels. However, I prefer to buy the aftermath rather than enter into a “buy and hold” strategy during a very difficult bear market with a view to ignoring short-term losses for the promise of much higher highs in due course. To me, the chance of seeing $15,000 this year is high and if this is not the bottom right now, Bitcoin can halve before the bottom levels are reached.
Be the first to comment