

It’s time for a dance. vizland/iStock via Getty Images
Get ready for charts, images, and tables because they are better than words. The ratings and outlooks we highlight here come after Scott Kennedy’s weekly updates in the REIT Forum. Your continued feedback is greatly appreciated, so please leave a comment with suggestions.
We’re going to keep this quick. There are several shares I want to touch on, so each topic will be brief.
NLY-F vs NLY-G vs NLY-I
On November 3rd, I wrote an article about opportunities in mortgage REITs and preferred shares. There were two major points. One was about the preferred shares and the other was highlighting one of our common share picks.
Regarding the preferred shares, we argued that there was no reasonable basis for investors to value NLY-F at $24.00, NLY-G at $20.87, and NLY-I at $20.63. The relative prices were simply absurd. I wrote:
“The difference in performance is absurd. Investors in AGNCN and NLY-F are roughly even year-to-date (including dividends). Maybe down as much as 2%. That’s amazing given the 20% drop on other shares. How much would you pay to have shares float two years earlier? 20%? That would be a really dumb idea. Who pays 20% so they can get two years of collecting about 11% rather than collecting about 8.3%? Is an extra 3% or so for two years’ worth 20%? No, because math still works. Paying 20% to get back somewhere around 6% is just an awful idea.
Paying more today than can hope to get back in the future is not investing. That’s literally the opposite of investing. Terrible.”
What happened?
Shares of NLY-G and NLY-I absolutely dominated NLY-F since then. You can see the swing in relative valuations using the $100k chart to see how much needed to be invested on any prior day to reach $100k today:
The REIT Forum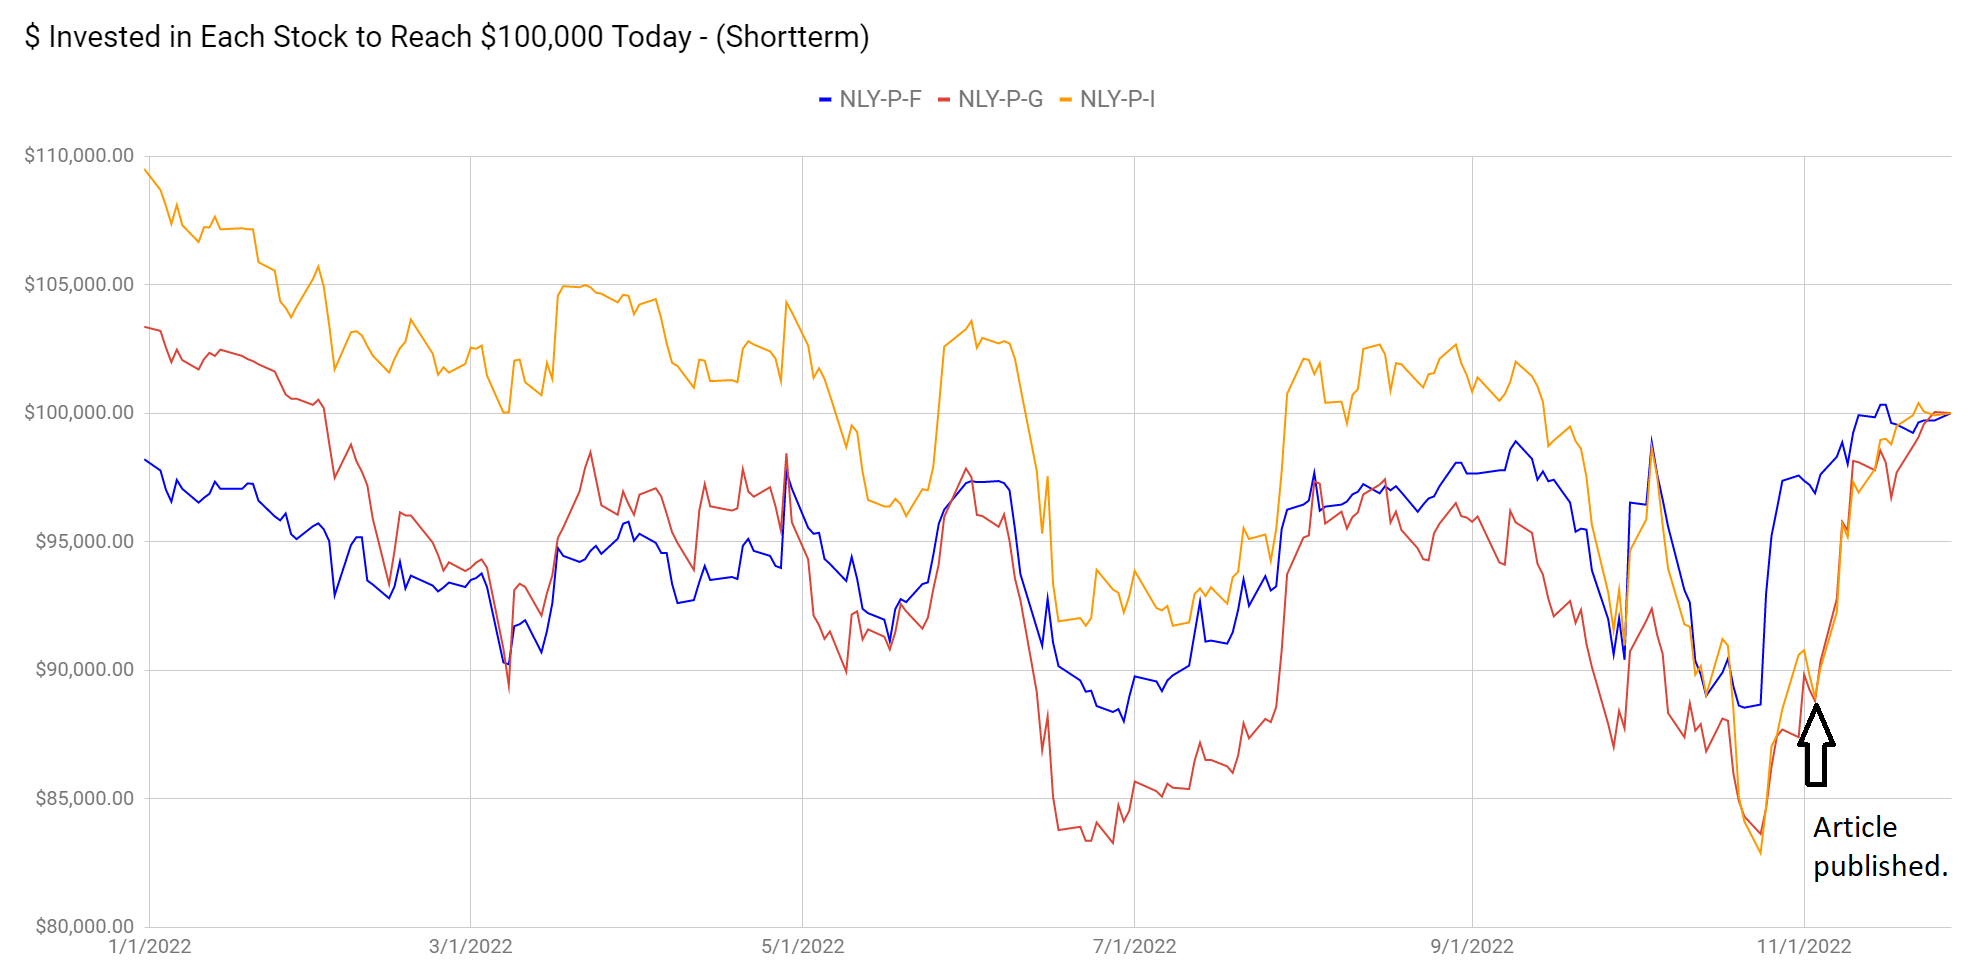
If you’re not familiar with reading that chart, you can use the change in share prices since the article was published:
The REIT Forum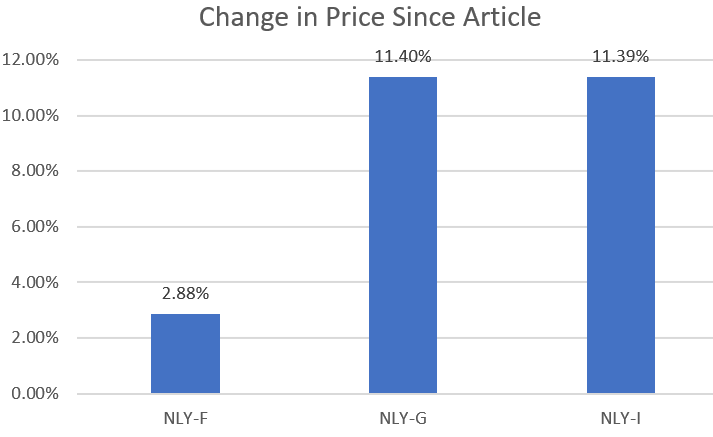
For preferred shares from the same REIT that all have a fixed-to-floating feature, that’s a huge swing in relative performance.
If you took the opportunity to enhance your returns, you’re welcome. If not, better luck next time.
Relative valuation today is dramatically more reasonable. Shares are not perfectly even when valued with discounted cash flows, but the gap is dramatically smaller. In my opinion, from most attractive to least attractive the ranking today would go:
- NLY-I at $24.69
- NLY-F at $22.98
- NLY-G at $23.39
The gap between NLY-I and NLY-F is tiny now. The higher rate on NLY-I nearly offsets the entire difference in price over the next 7 dividends. If we focus on short-term projections, NLY-F may actually have slight edge. For investors who just want to buy and hold, the two shares are pretty close to equal.
NLY-G may seem more attractive to some investors as it has more “upside” than NLY-F to call value. However, the difference in the floating spreads is material and it makes NLY-F slightly more attractive than NLY-G today. I don’t think NLY-G will be called.
There are still some opportunities to trade between shares and I’ll be preparing another article on the topic for members of The REIT Forum.
Rithm Capital Corp
Our other commentary was to highlight Rithm Capital Corp. (RITM). As it stands, RITM is still attractive, but we caught a bottom in the price:
Seeking Alpha
As it stands, RITM still only trades at 72% of our estimate for book value per share. Consequently, RITM still has a substantial amount of upside and we’re still bullish on RITM. While the 10% rally since that call was good, it should still climb further. Shares still carry an 11.3% dividend yield.
Arlington Asset Investment Corp.
Before I say anything else, I’ll remind investors that we actively trade in the sector. A mortgage REIT with no dividend can be a viable choice if we have a good reason to believe the share price will eventually increase. However, we are not looking for prices to increase over the span of several years. We’re trading in and out of positions based on swings in the price-to-book ratio. It’s simply a better technique. Our strategy delivered dramatically better performance than the sector. From the start of 2016 through the end of October, we were up 107.27%. MORT (one of the largest mortgage REIT ETFs) only delivered 8.7% during that period. Arlington Asset Investment (AAIC) has been even worse during that period. However, AAIC’s dreadful performance was leading up to the middle of 2020. The REIT has done a much better job protecting book value lately and still trades at an enormous discount.
AAIC has been able to improve results on book value per share by repurchasing common shares and preferred shares at significant discounts. This is a technique more REITs should learn to use. In Scott’s update on Q3 2022 earnings for AAIC, OCSL, and PFLT, he wrote:
AAIC also reported BV accretion of $0.07 per common share directly due to the repurchase of 0.4 million net shares of common stock and 0.1 million shares of preferred stock during the third quarter of 2022. The weighted average price paid on the common stock was $3.14 per share while being $20.54 per share on the preferred stock.
As it stands AAIC still trades at a 0.46 price-to-book ratio (using our estimate for book value per share). While we believe AAIC should trade a significant discount to our projected book value of $6.65, they have dramatic upside from $3.06. However, investors should be aware that liquidity is pretty weak as AAIC is a very small mortgage REIT.
Stock Table
We will close out the rest of the article with the tables and charts we provide for readers to help them track the sector for both common shares and preferred shares.
We’re including a quick table for the common shares that will be shown in our tables:
Let the images begin!
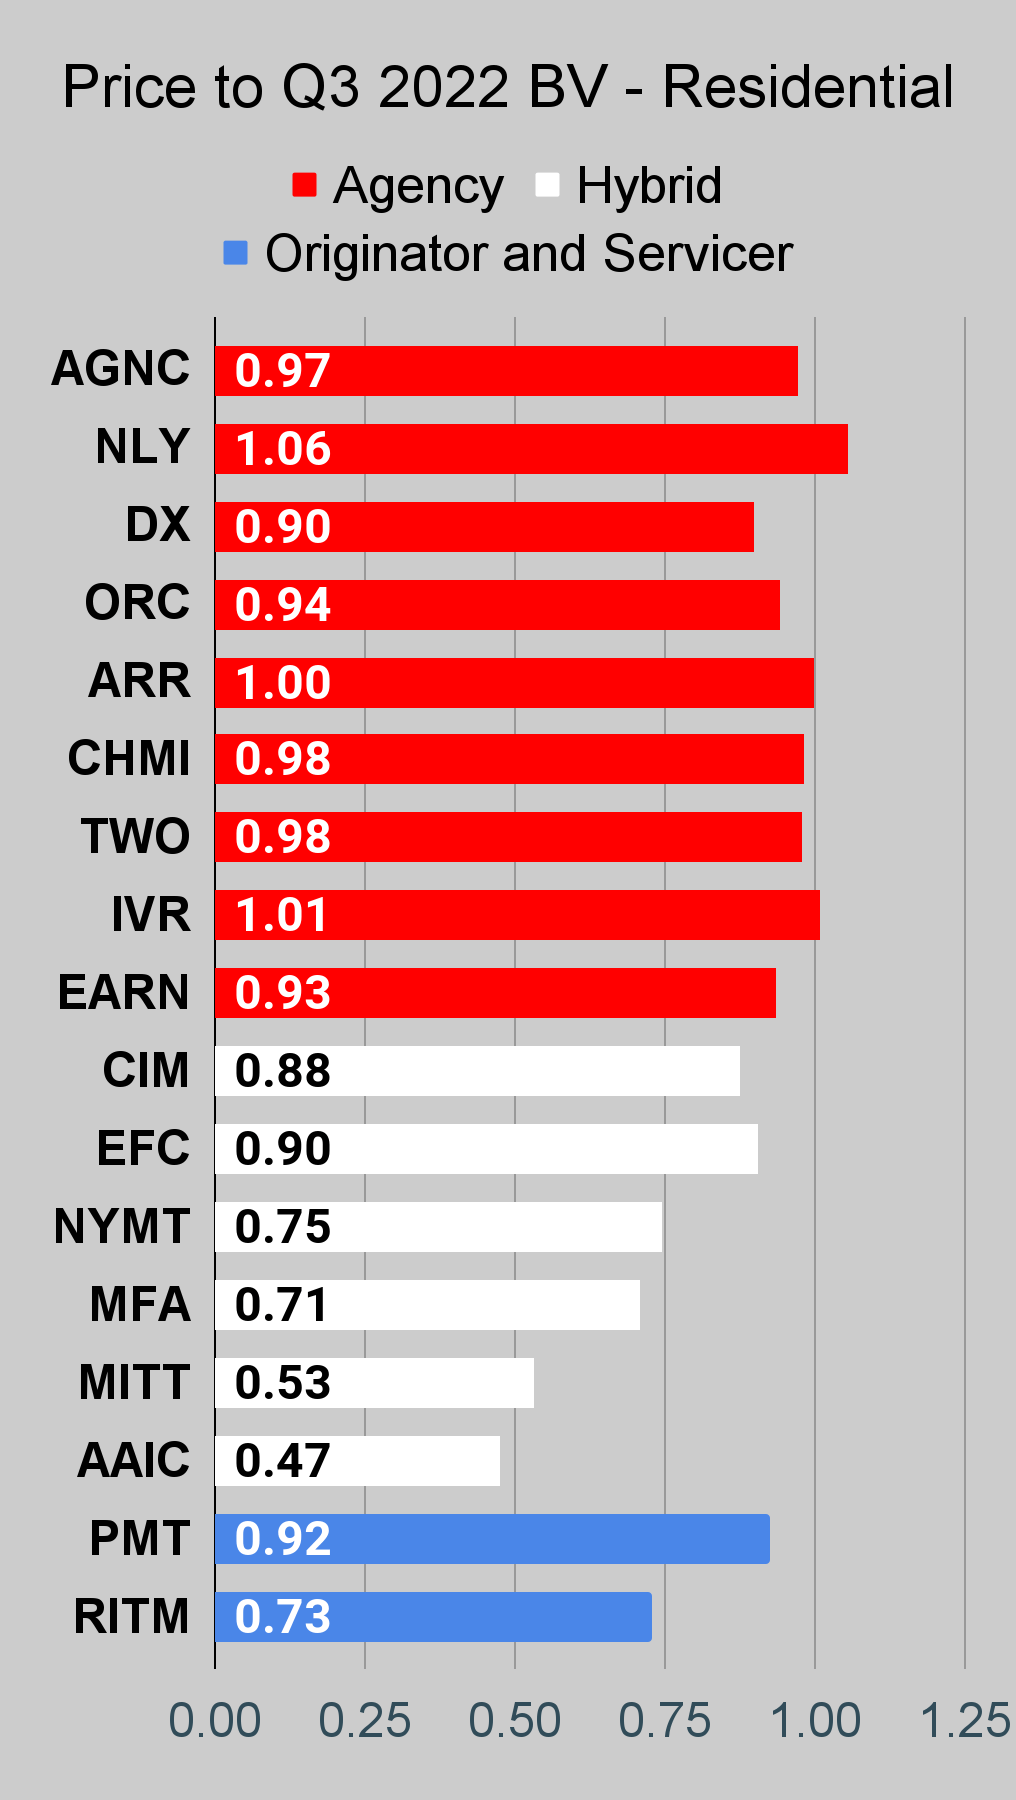
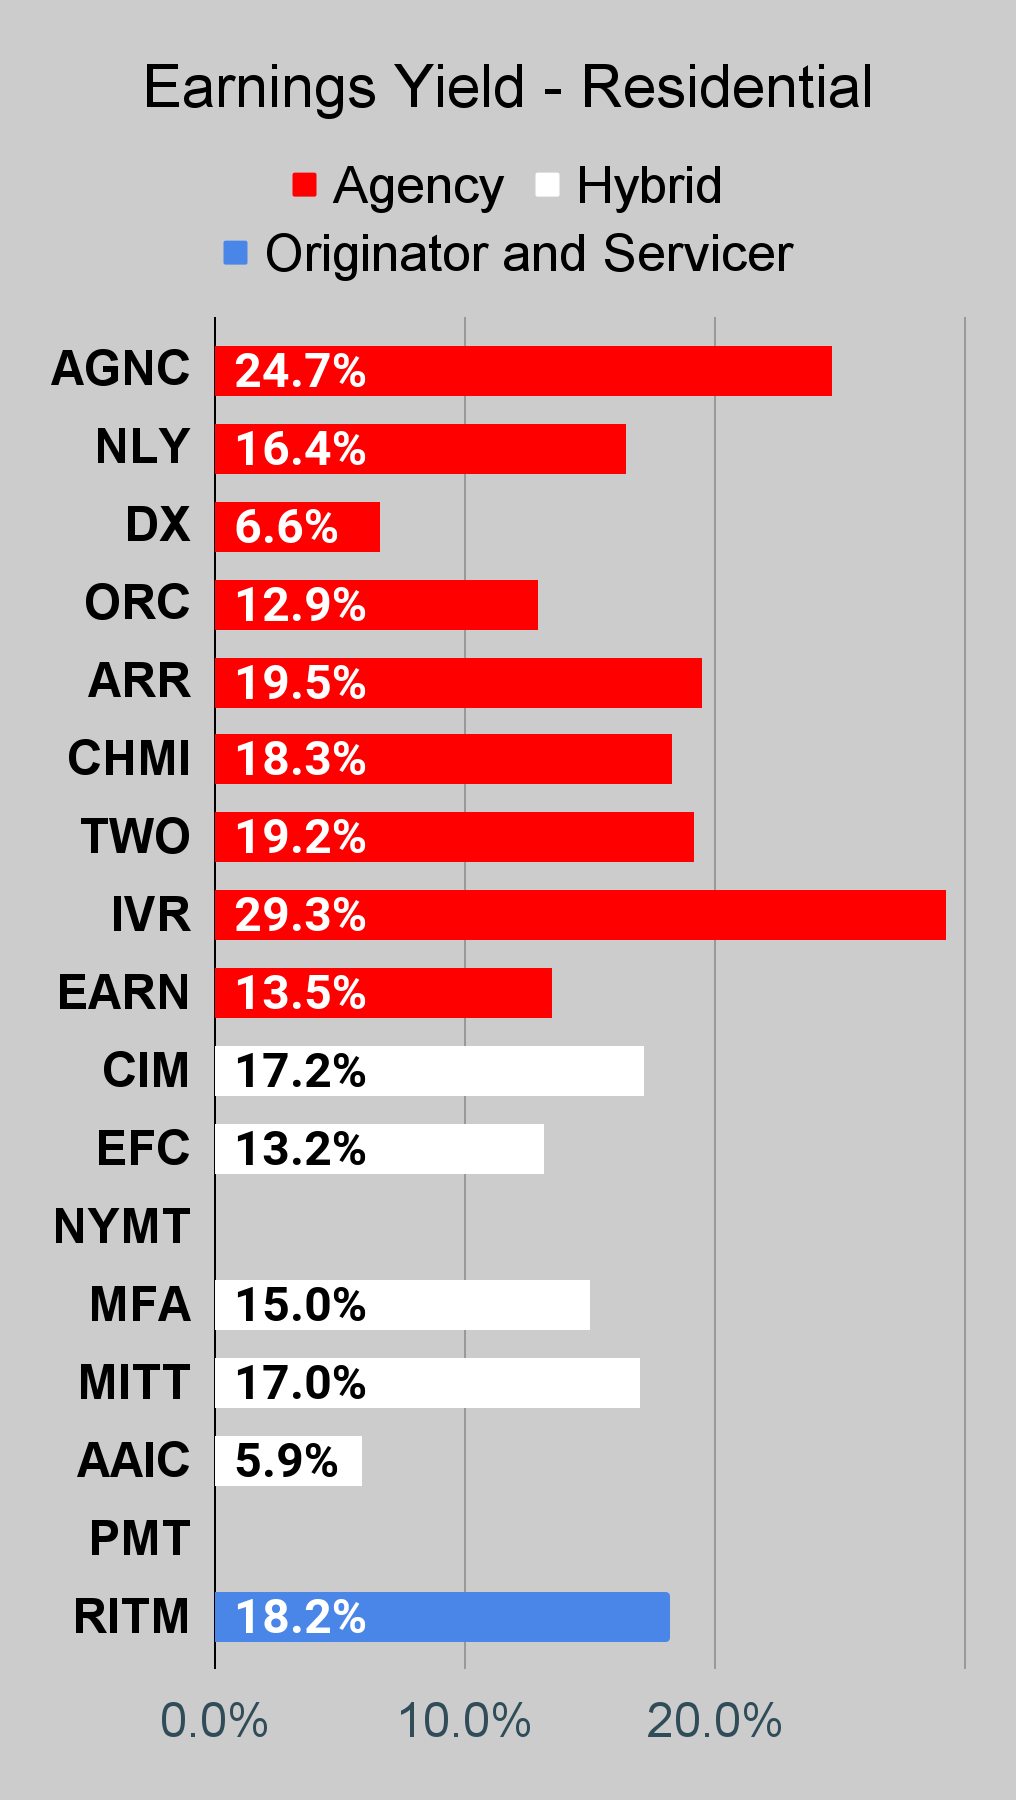
Residential Mortgage REIT Charts
Note: The chart for our public articles uses the book value per share from the latest earnings release. Current estimated book value per share is used in reaching our targets and trading decisions. It is available in our service, but those estimates are not included in the charts below. PMT and NYMT are not showing an earnings yield metric as neither REIT provides a quarterly “Core EPS” metric.
 The REIT Forum |
 The REIT Forum |
 The REIT Forum |
Commercial Mortgage REIT Charts
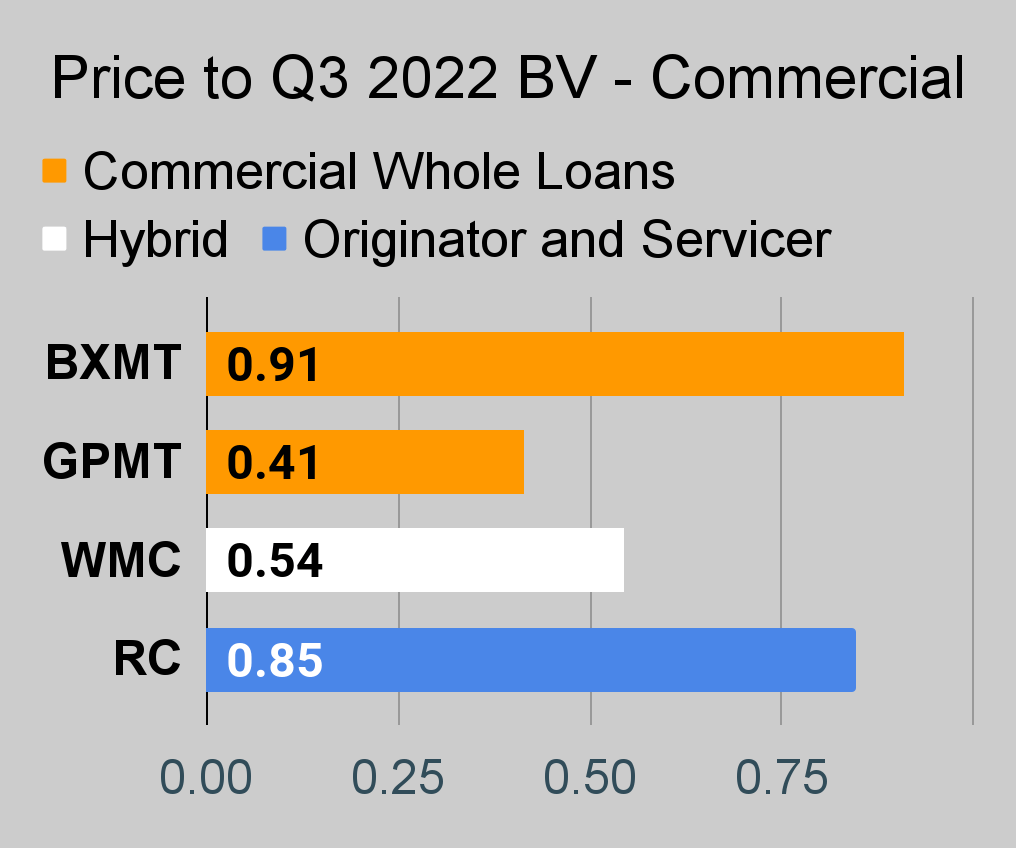 The REIT Forum |
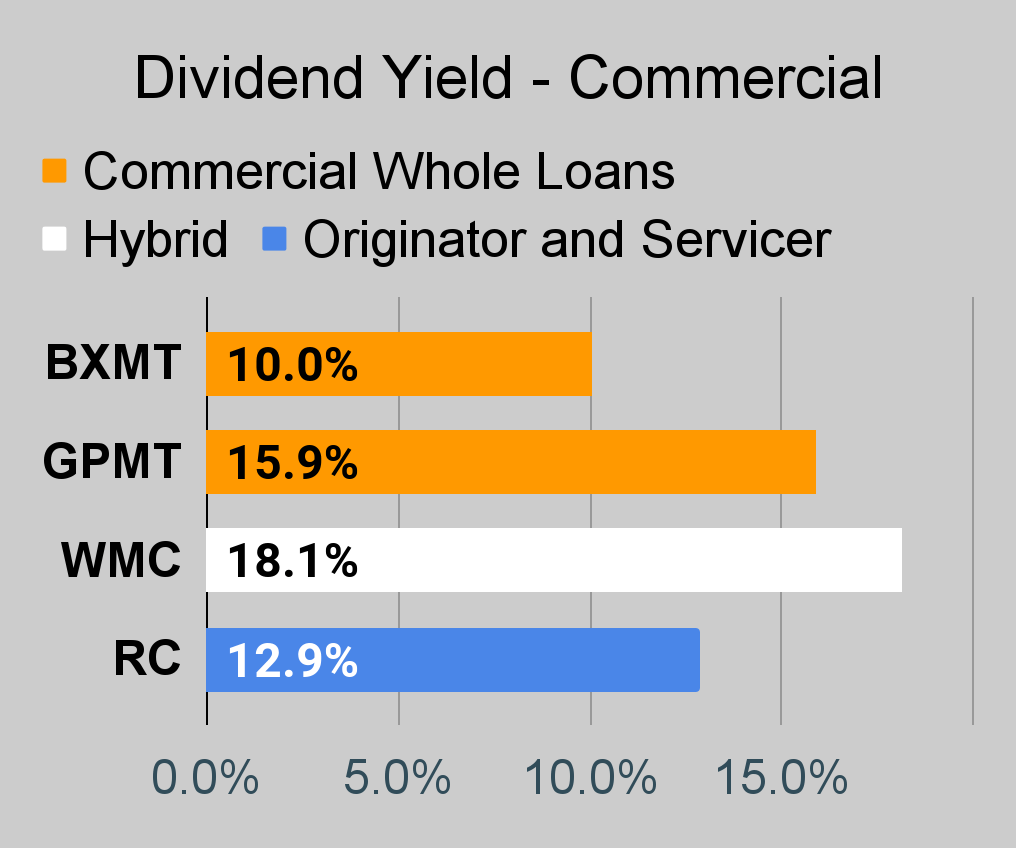 The REIT Forum |
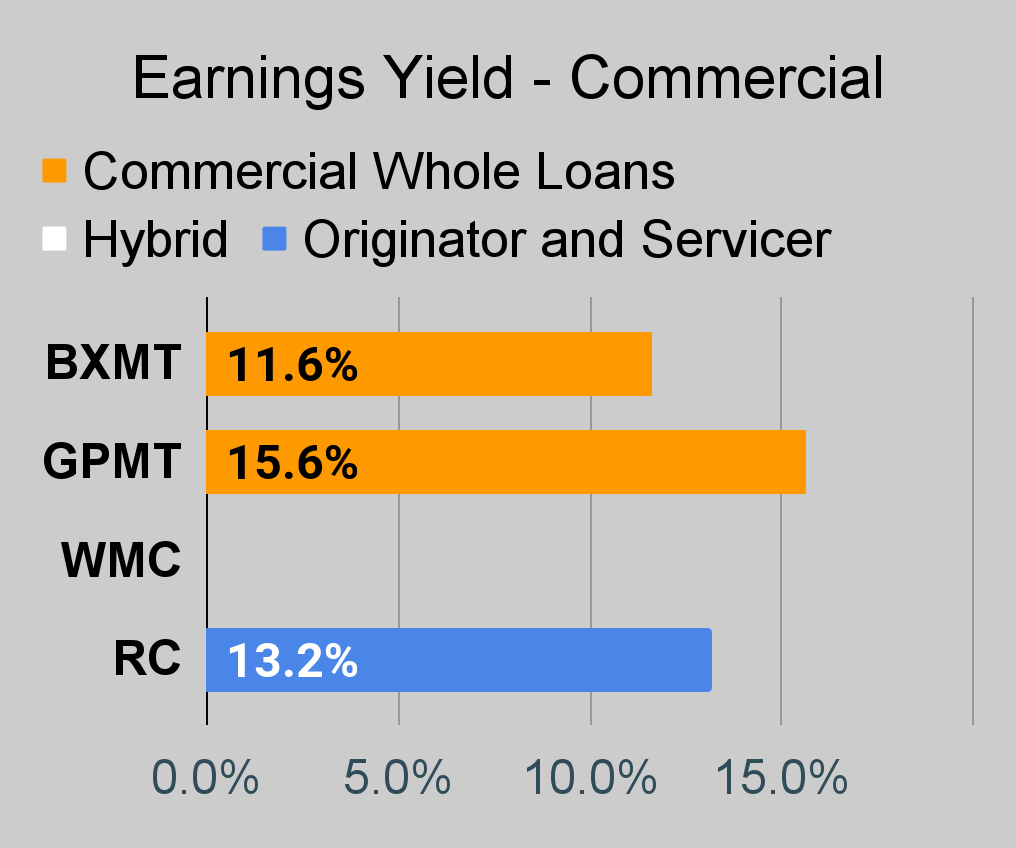 The REIT Forum |
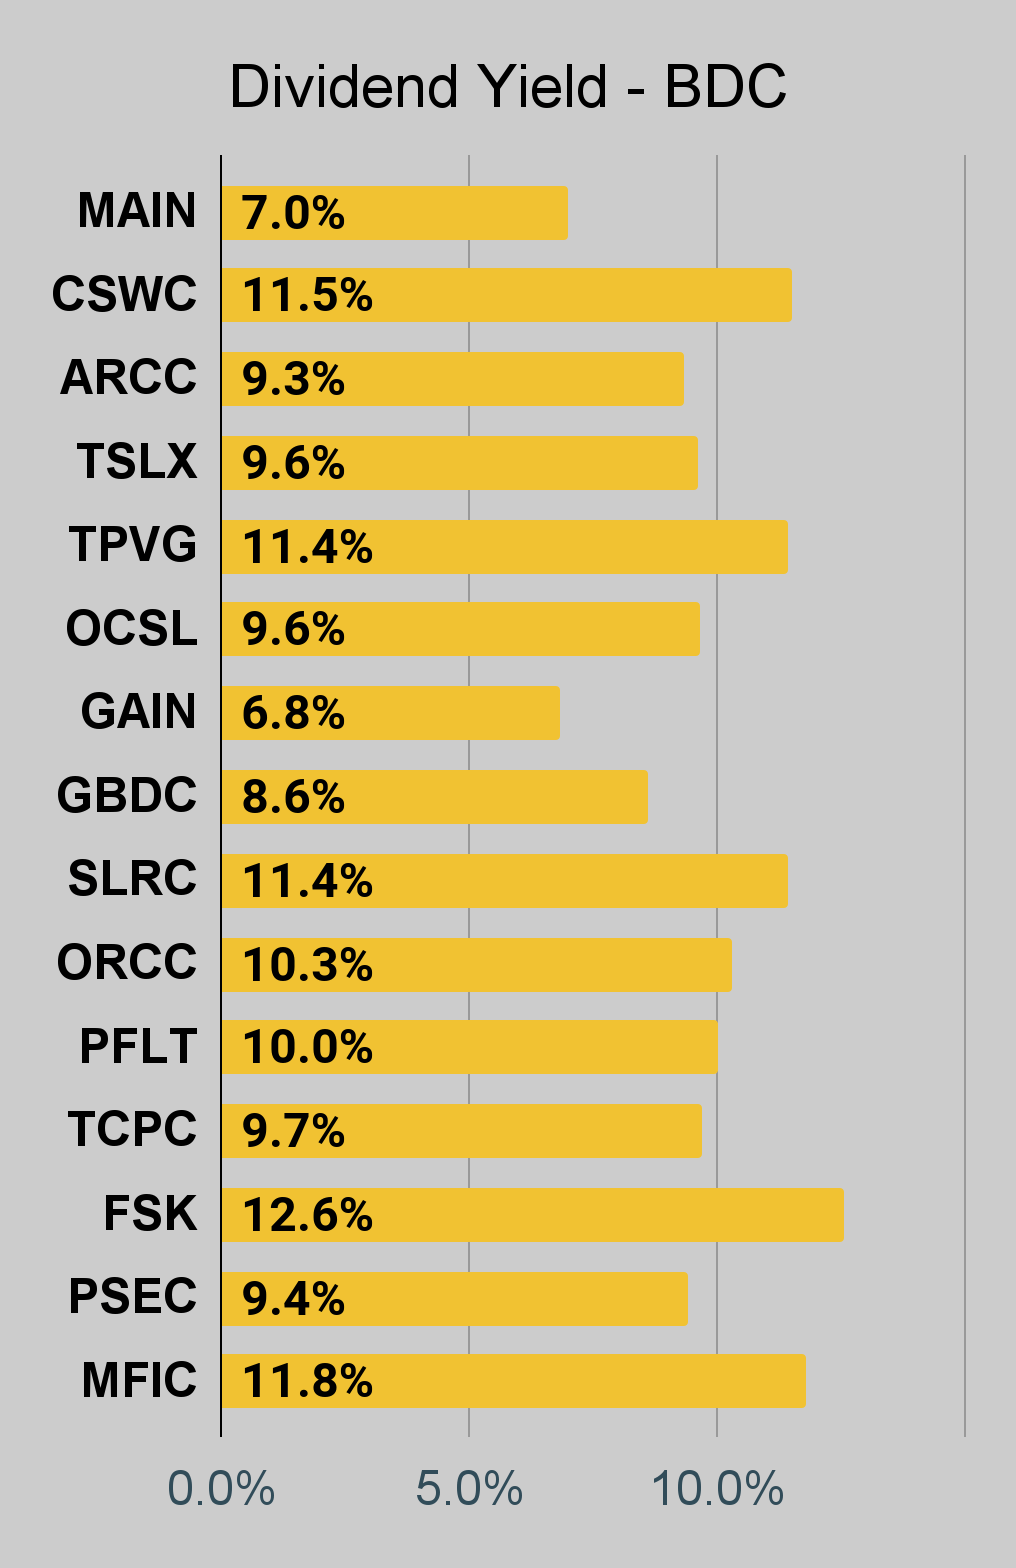
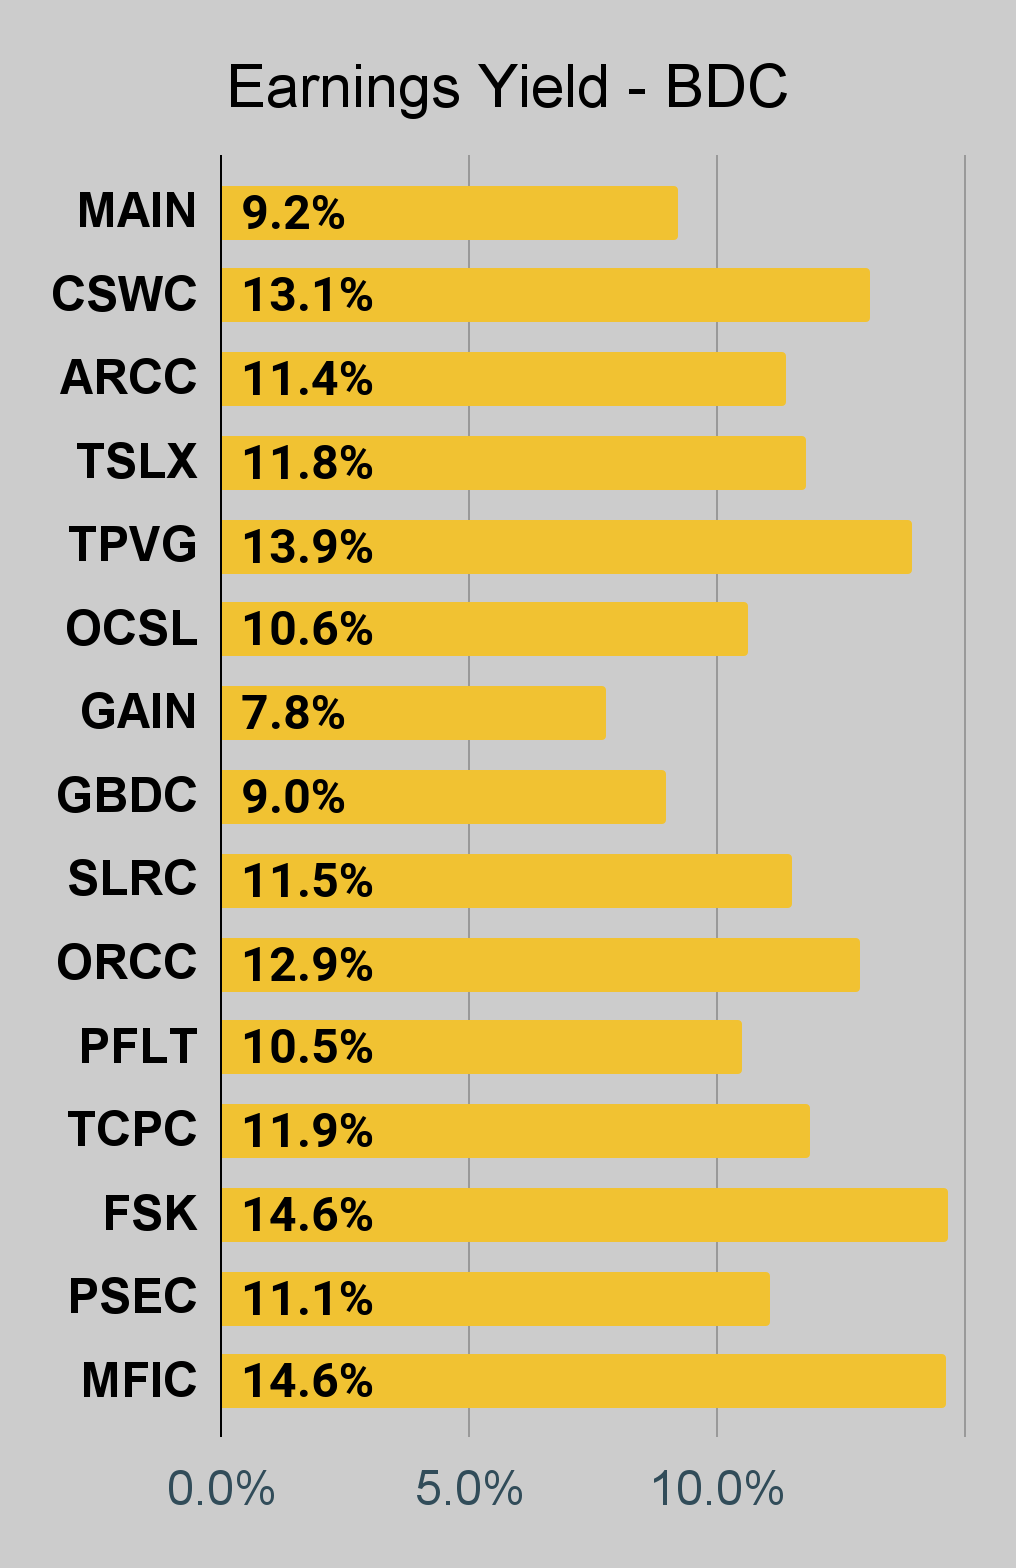
BDC Charts
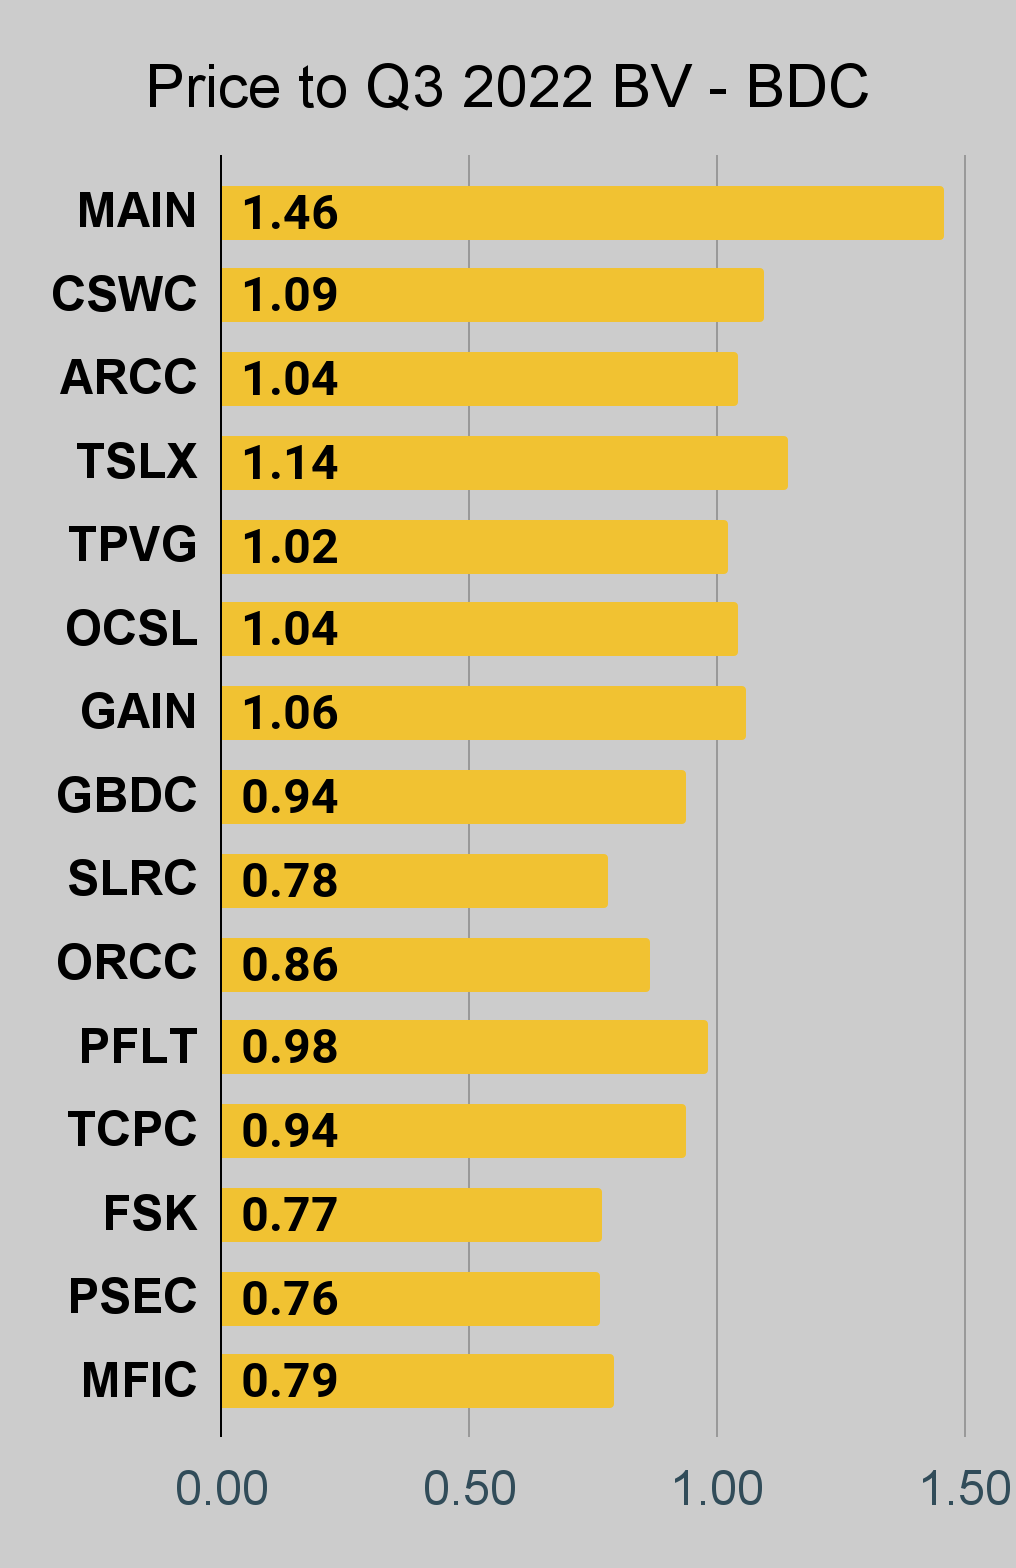 The REIT Forum |
 The REIT Forum |
 The REIT Forum |
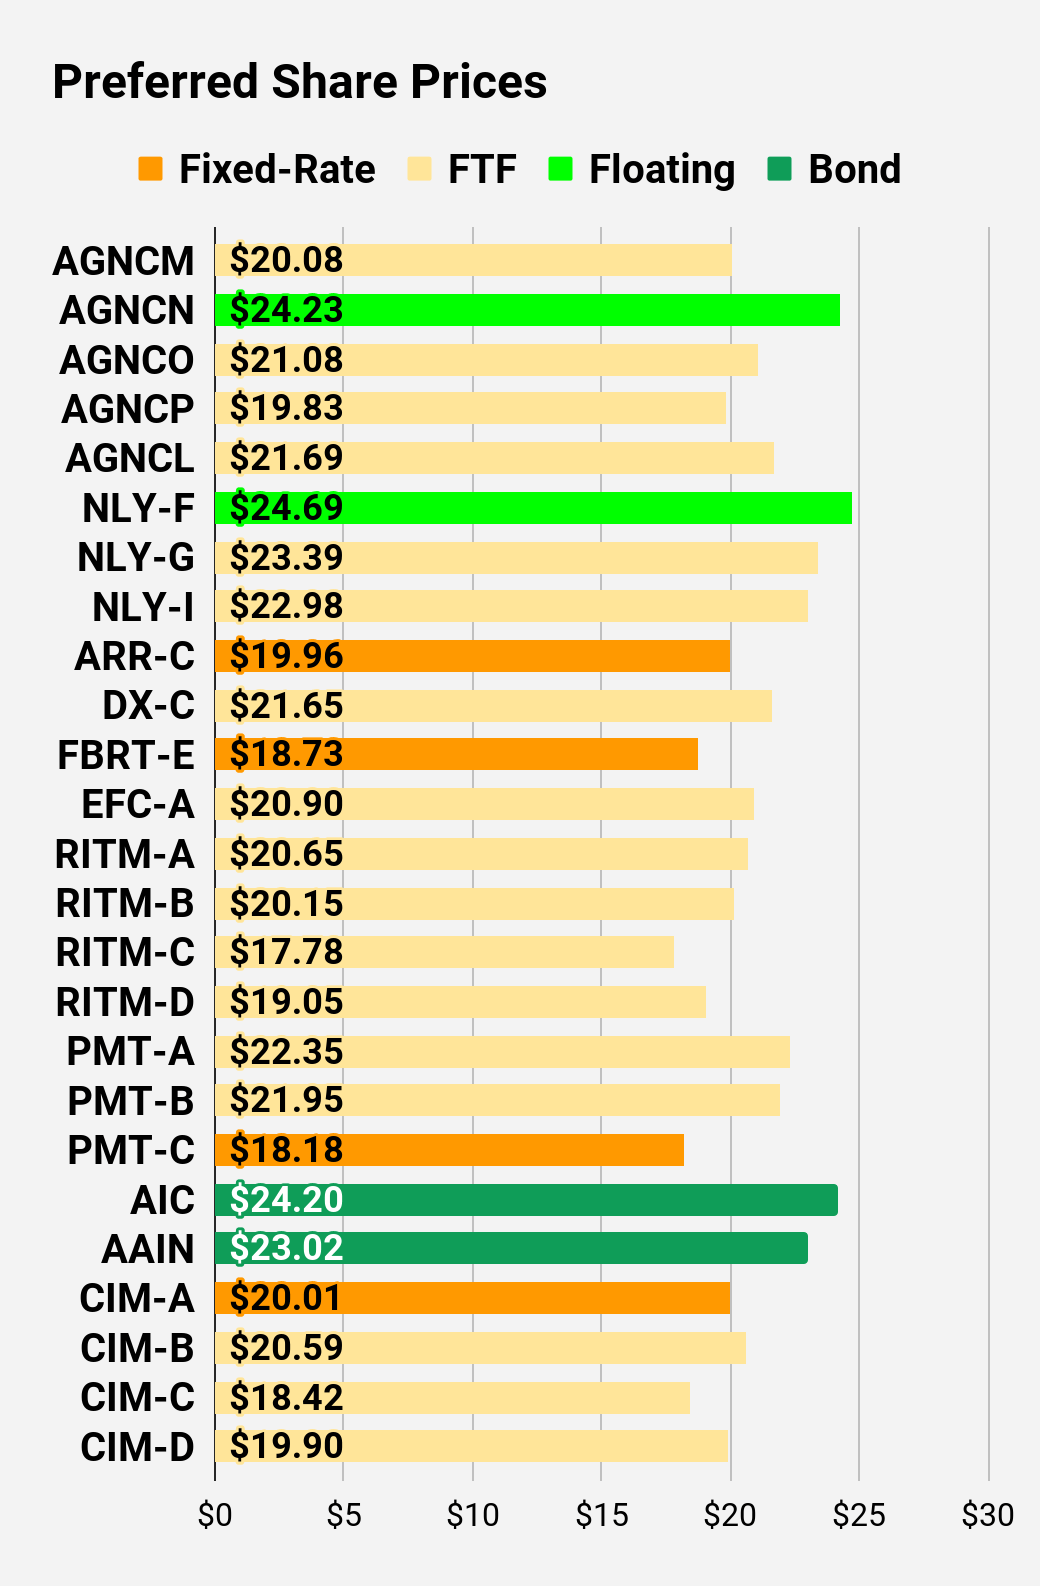
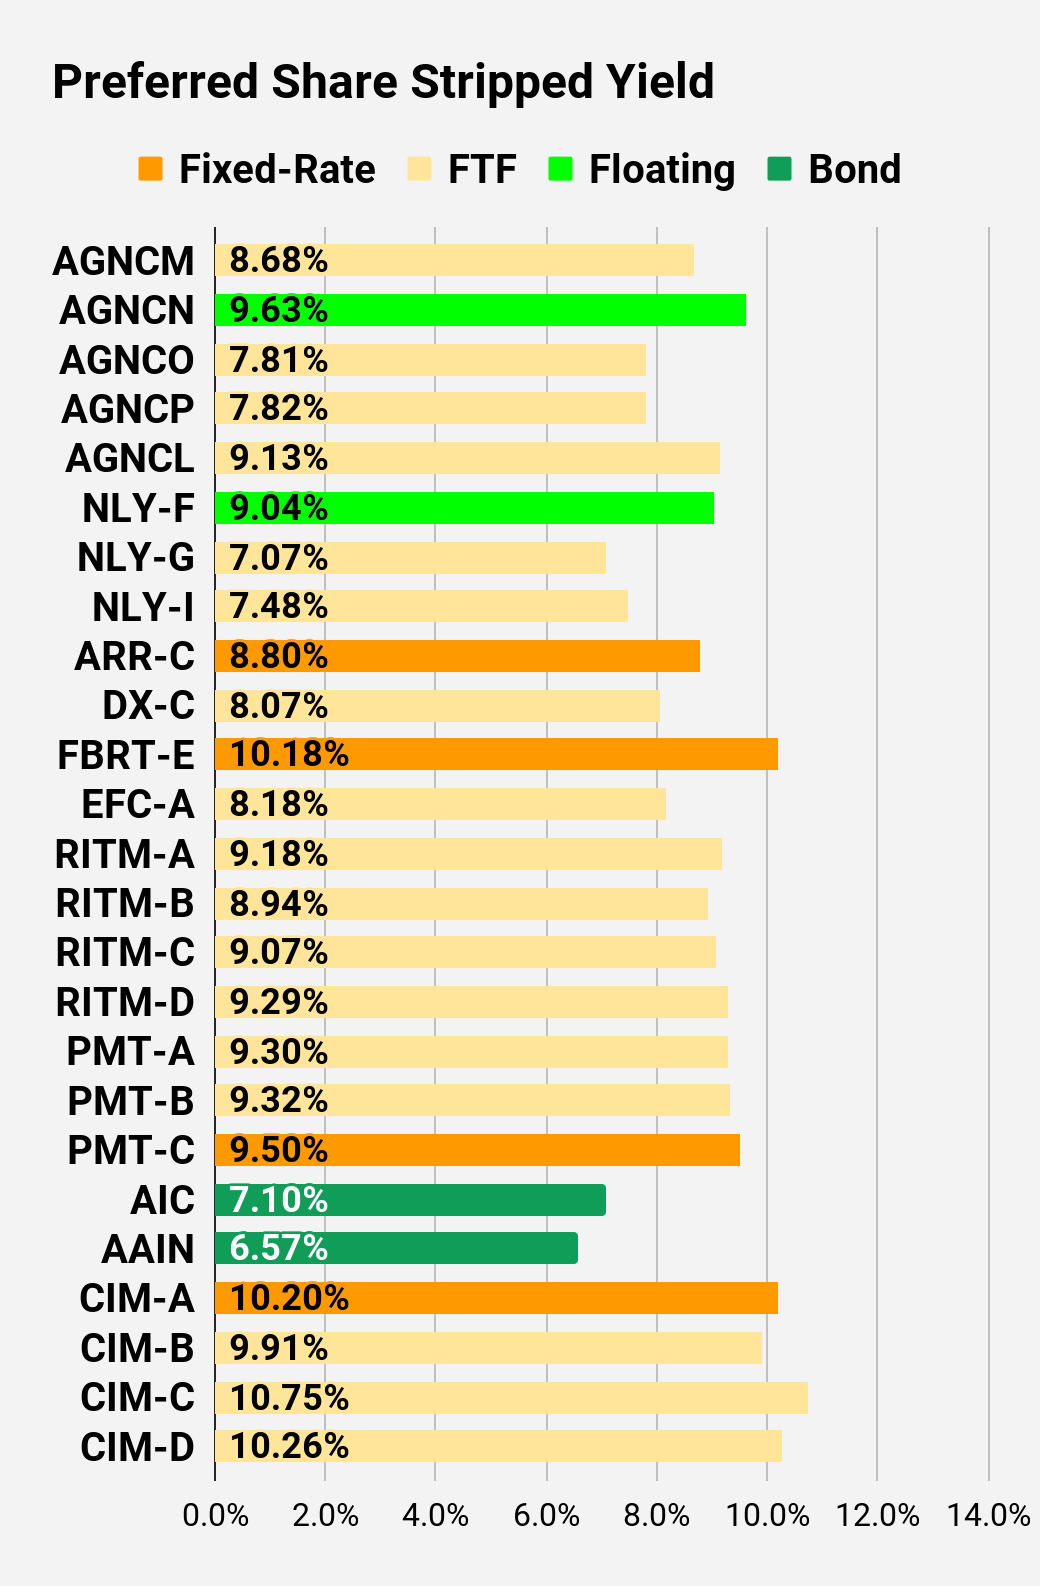
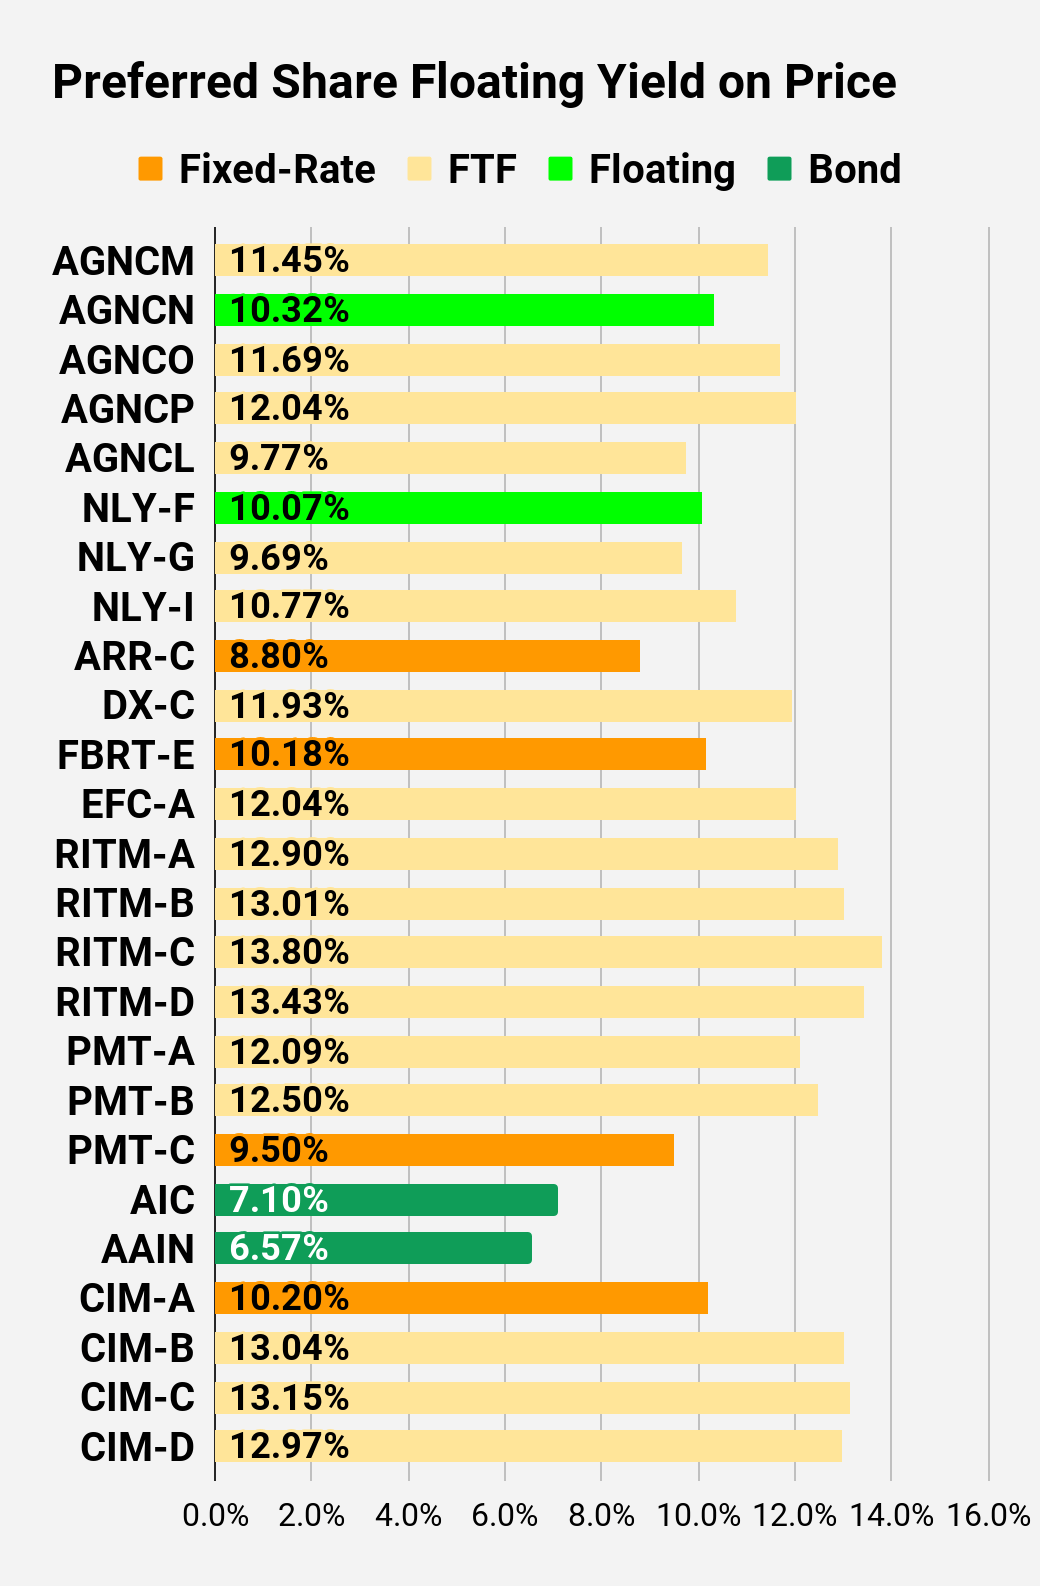
Preferred Share Charts
I changed the coloring a bit. We needed to adjust to include that the first fixed-to-floating shares have transitioned over to floating rates. When a share is already floating, the stripped yield may be different from the “Floating Yield on Price” due to changes in interest rates. For instance, NLY-F already has a floating rate. However, the rate is only reset once per 3 months. The stripped yield is calculated using the upcoming projected dividend payment and the “Floating Yield on Price” is based on where the dividend would be if the rate reset today. In my opinion, for these shares the “Floating Yield on Price” is clearly the more important metric.
 The REIT Forum |
 The REIT Forum |
 The REIT Forum |
 The REIT Forum |
 The REIT Forum |
 The REIT Forum |
Preferred Share Data
Beyond the charts, we’re also providing our readers with access to several other metrics for the preferred shares.
After testing out a series on preferred shares, we decided to try merging it into the series on common shares. After all, we are still talking about positions in mortgage REITs. We don’t have any desire to cover preferred shares without cumulative dividends, so any preferred shares you see in our column will have cumulative dividends. You can verify that by using Quantum Online. We’ve included the links in the table below.
To better organize the table, we needed to abbreviate column names as follows:
- Price = Recent Share Price – Shown in Charts
- BoF = Bond or FTF (Fixed-to-Floating)
- S-Yield = Stripped Yield – Shown in Charts
- Coupon = Initial Fixed-Rate Coupon
- FYoP = Floating Yield on Price – Shown in Charts
- NCD = Next Call Date (the soonest shares could be called)
- Note: For all FTF issues, the floating rate would start on NCD.
- WCC = Worst Cash to Call (lowest net cash return possible from a call)
- QO Link = Link to Quantum Online Page
Second Batch:
Strategy
Our goal is to maximize total returns. We achieve those most effectively by including “trading” strategies. We regularly trade positions in the mortgage REIT common shares and BDCs because:
- Prices are inefficient.
- Long-term, share prices generally revolve around book value.
- Short-term, price-to-book ratios can deviate materially.
- Book value isn’t the only step in analysis, but it is the cornerstone.
We also allocate to preferred shares and equity REITs. We encourage buy-and-hold investors to consider using more preferred shares and equity REITs.
Performance
We compare our performance against 4 ETFs that investors might use for exposure to our sectors:
The REIT Forum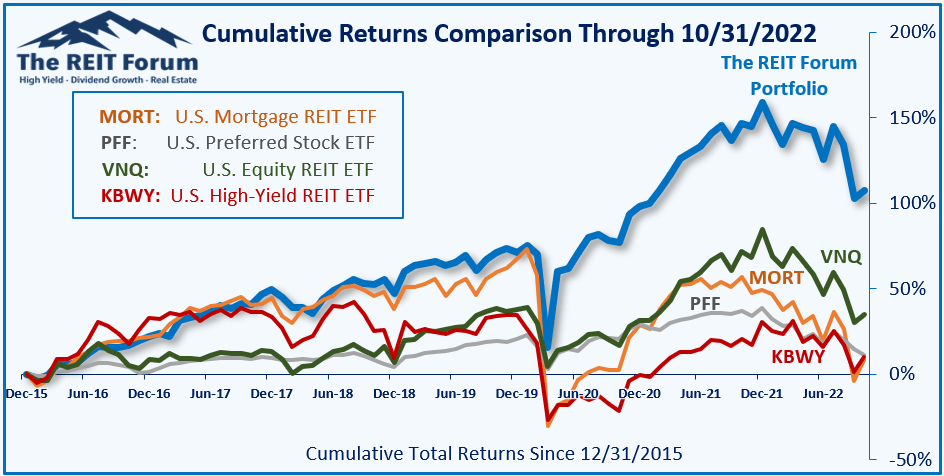
The 4 ETFs we use for comparison are:
|
Ticker |
Exposure |
|
One of the largest mortgage REIT ETFs |
|
|
One of the largest preferred share ETFs |
|
|
Largest equity REIT ETF |
|
|
The high-yield equity REIT ETF. Yes, it has been dreadful. |
When investors think it isn’t possible to earn solid returns in preferred shares or mortgage REITs, we politely disagree. The sector has plenty of opportunities, but investors still need to be wary of the risks. We can’t simply reach for yield and hope for the best. When it comes to common shares, we need to be even more vigilant to protect our principal by regularly watching prices and updating estimates for book value and price targets.
Ratings: Bullish on RITM and AAIC.
Be the first to comment