


naphtalina/iStock via Getty Images
Introduction
As we started 2022, the market was wrestling with a number of issues: a looming government shutdown, rising interest rates, massive deficit spending, 40-year highs in inflationary pressures, a tight labor market, and continuation of COVID difficulties (Omicron). It did not factor in a Russian invasion of the Ukraine.
Looking ahead, we think it is important to remember the path the market was on before this conflict started. The global economy was on track to re-open and accelerate sharply, with factory output surging, inventories lean, and the service sector rebounding. Despite today’s turbulent and unsettling conditions, we believe a lot of risk is already priced into the marketplace. Sentiment seems downright depressed, and investor positioning is more weighted towards cash, than equities.
In our newsletter, as we often do, we will address a few macro issues like jobs, interest rates, commodities, inflation, and the Fed. Then, we will dive into some specific FINTECH topics: the exchanges, SWIFT access, sanctions, and payment trends. At the end of our newsletter, make sure you read our “useless” Cliff Clavin facts. In trying times like these, everybody can use a quick laugh, right?
Volatility
John F. Kennedy once said, “The Chinese use two brush strokes to write the word ‘crisis’. One brush stroke stands for danger; the other for opportunity. In a crisis, be aware of the danger – but recognize the opportunity.”
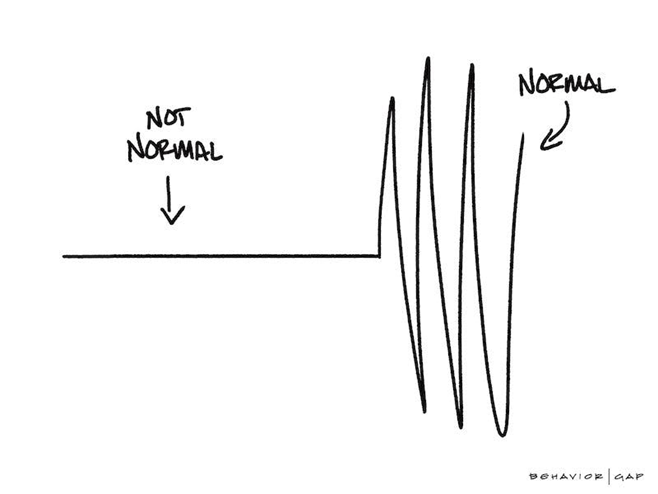
In 2021, the S&P 500 was up +28.7%, with relatively few days of elevated volatility. We agree with this Carl Richards graphic that shows that volatility and uncertainty are fairly “normal,” while steady and predictable equity markets are “not normal.”
Carl Richards picture (Carl Richards)
We expect market volatility to continue, especially as this Ukrainian and Russian conflict intensifies. Short-term traders will whip their positioning around and make trades based upon the latest fearful news flooding the internet, inboxes, and phones. But even before this war, risk assets were expected to be more volatile this year, as the Fed unwound its unprecedented monetary stimulus (following COVID).
We are long-term investors and will remain disciplined in our process, strategy, and philosophy. We have been managing money for over 20 years, and we have experienced cycles and periods like this before. We believe that investors should recognize the current uncertain environment but plan for and anticipate what the future holds. We focus our attention on modeling various scenarios and understand that reacting to today’s crisis is almost always counterproductive (and costly). If the economy can deliver outcomes even barely better than most expect, we believe stocks (and especially our FINTECH positions) are likely to respond positively. The equities market in 2022 may not have started out well, but we believe it is set up nicely to perform.
Jobs & Labor
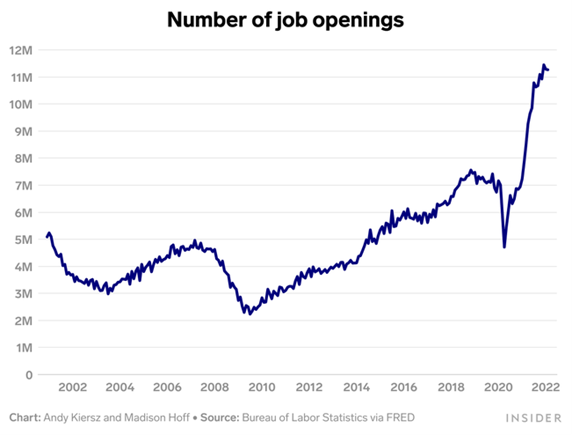
As the chart on the right shows, US job openings are at a two-decade high. Initial Jobless Claims were recently released and came in at 202,000, which was slightly higher than the number a week ago. These figures are equivalent to pre-pandemic levels, indicating that we seem to be fully recovered from COVID.
Bureau of Labor Statistics chart (Bureau of Labor Statistics chart)
To put some perspective on the jobs market, the US is getting close to half-century highs. Easy monetary policies have clearly supported a strong labor market recovery. Despite last winter’s Omicron surge, the US economy has added 3.5 million jobs over the last six months. As of last year, there were nearly 5 million more jobs than unemployed workers.
Remember, the Fed has dual mandates of “maximum employment and maintaining stable prices.” At the beginning of 2020, as COVID impacted our economy, the Fed slashed interest rates to combat an economic shutdown. The pandemic crippled financial markets and sent 22 million Americans to the unemployment line. Thankfully, this is now an afterthought.
With unemployment at 4% and expected to fall to 3.5% by the end of the year, the Fed can safely check the maximum employment mandate off of its “to do” list. Now, it can focus its attention on taming inflation. With inflation risk still skewed to the upside, the Fed will likely not deviate from the market’s current pricing of steady rate hikes this year and next.
Inflation
Before the war took over the news cycle, inflation was the largest concern for the market. Demand for all types of goods and services is well in excess of supply chain capabilities, which remain clogged and below pandemic-era peaks. Current price increases are running at the fastest pace in roughly 40 years. Unprecedented spending, more than $10 trillion of fiscal and monetary stimulus, clearly led to this inflation surge.
The Consumer Price Index (CPI) is one of the main indicators of economic inflation. It has steadily increased for each of the last six months. Back in December of 2021, it was at an alarming +7.0%. Fed Chairman Powell finally capitulated his “transitory” language, but still felt inflation would begin to decline. Then, in January of 2022, CPI came in at +7.5%. Now, in February of 2022, CPI rose to +7.9%, with energy accounting for over 30% of the entire increase. Some forecasts are for gas prices to go up another 20% from here. In addition, clothing prices rose +6.6%, motor vehicle repair costs increased +6.3%, airline fares jumped +12.7% and shelter costs, which are 1/3 rd of total CPI, increased +4.8%. The troubling aspect of all of this data is that it was calculated before the impact of the Russian invasion of Ukraine (on February 24th). Some prefer to use the Core CPI inflation metric, because it strips out volatile food and energy prices. It was up +6.4%, which was the highest reading since August of 1982.
Initial Fed commentary blamed supply-chain constraints for elevated prices and believed that higher employment would lead to higher wages, which would then help offset prices. For years, the Fed almost ignored its inflation goal of 2%, as prices were stubbornly below this target. In September of 2020, the Fed approved a new approach to inflation, which would allow it “to run hotter in the interest of a full and inclusive employment goal that spans across race, gender and wealth.” This new approach was almost immediately followed by the worst inflationary environment since the early 1980’s, when Fed Chairman Paul Volcker increased interest rates to 19% to ultimately tame inflation. We highly doubt that today’s Fed has the stomach to be that aggressive fighting elevated inflation.
Is the Fed behind the 8-ball? Did the Fed allow inflation to get “too hot” before raising interest rates or ending QE? Frankly, it doesn’t matter if they erred or not. It’s more important to look forward and adjust to the current environment. While the war in Ukraine erupted after the Fed’s last meeting and is certainly new information to be considered at the next meeting, Chairman Powell has asserted that the initial interest rate rise will only be 25 basis points, not the 50 basis points that some analysts had predicted.
When probed during his Washington DC testimony, Chairman Powell outlined the repercussions of the Fed’s policy decisions and how it intends to counteract inflation. “If inflation does become too persistent, if these high levels of inflation get entrenched in our economy, and in people’s thinking, then inevitably that will lead to much tighter monetary policy from us, and it could lead to a recession, and that would be bad for workers,” he said.
During his testimony, two Republican senators voiced concerns that the Fed was “acting too slowly.” Senator Richard Shelby (Republican from Alabama) said: “I’m concerned that the Fed ‘missed the boat’ on addressing inflation sooner.” Then, Senator Pat Toomey (Republican from Pennsylvania) bluntly said that the Fed’s monetary policy framework “has caused it to be behind the curve.”
Inflation is raging at a pace not seen in 40 years, making it a certainty that the Fed will continue to raise interest rates. The Fed has penciled in interest rate increases at each of the six remaining meetings this year, plus another three in 2023. The only dissenter was St. Louis Fed President James Bullard, who wasn’t against the higher interest rates, but stated that he wanted a 50-basis point increase, not 25. In fact, he is advocating for the equivalent of 12 increases this year. We are sorry to say, but a 25-basis point hike is really just the first step in slowing the rapid pace of price increases felt at the mall, the grocery store, and especially the gas pump.
One Fed Hawk
On the Fed’s FOMC (Federal Open Market Committee), the lone dissenter to a gradual approach to raising interest rates is President Bullard, who said he’d prefer the Fed to “quickly adjust the policy rate to a more appropriate level for the current circumstances.”
In his personal statement, he said inflation is hurting people the Fed is trying to help the most, namely those on the lower rungs of the economic ladder. “The burden of excessive inflation is particularly heavy for people with modest incomes and wealth and for those with limited ability to adjust to a rising cost of living.”
We typically do not focus too much attention on the Fed’s dot plots, but we have to assume that the highest dot belongs to Bullard. He is indicating that the Fed finish the year at a range of 3.0% to 3.25%, which would be as aggressive as the Fed was in 1994 to 1995.
Bullard referred to the results in the second half of the 1990’s as “booming,” emphasizing how the Fed achieved its 2% inflation target and that it should strive to attain a similar outcome today.
Interest Rates
Fed Chairman Powell and the Fed raised interest rates by 25 basis points at the March meeting. This was the first increase since 2018. As his Congressional testimony, Powell said, “It is really time for us to begin to move away from those emergency pandemic settings to a more normal level. We’re really just going to be moving over the course of this year to a policy that is closer to normal, but it’s a long road to normal from where we are now.”
The market is already pricing in several more interest rate hikes this year and next. Will one meeting get 50 basis points versus a more traditional 25 basis point increase? The last 50-basis point hike came in 2000, but we might see another one at the May FOMC meeting. Does it really matter whether we get three or four or even five interest rate increases in 2022?
The bigger issue is that we end this extremely loose monetary policy, which was primarily instituted to offset a global pandemic. While COVID will likely be an issue for years to come, the need for government stimulus and easy monetary policy can safely end. In our opinion, interest rate increases and decreases are essentially meaningless to debate. The clear and simple answer is that interest rates are headed higher, and the Fed will be less accommodative than it has been.
Another key takeaway (from our perspective) is that this is a positive event. The rationale for raising rates is to tame an overheating economy and combat higher inflation. Isn’t a resilient and robust economy a good thing? Our economy is rebounding from a once-in-a-generation pandemic, and we remain the envy of the world, but it is far from actually overheating.
Stock Performance with Rising Interest Rates
Yahoo finance chart (Yahoo finance chart)
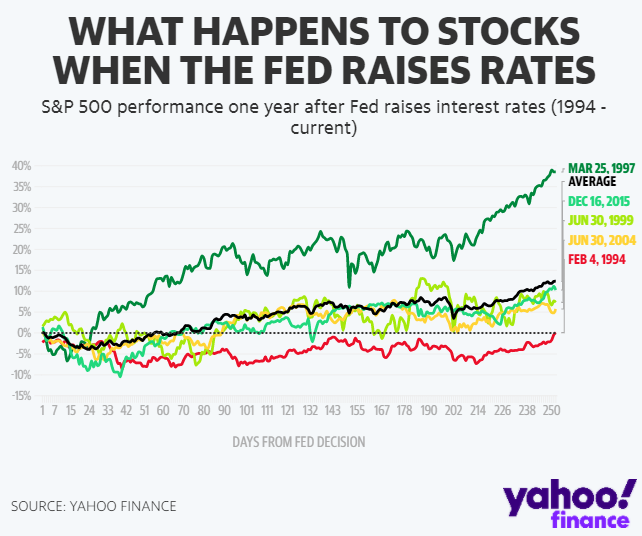
The thought that rising interest rates hurt stock returns is simply not a thesis based in data.
As this Yahoo Finance chart shows, S&P 500 performance post Fed interest rate increases, indicates a positive correlation. Over the last five rate cycle increases, the S&P 500 has experienced an average increase of +12%. As long as higher interest rates are due to strong economic conditions, the equity market tends to perform nicely.
We believe there is a great explanation for why stocks tend to outperform as the Fed raises interest rates. Most of the time, the Fed is tightening conditions to “cool down” a possibly overheating economy. In our opinion, this is precisely what we are experiencing today. The Fed is seeking to modestly taper demand and tame higher-than-expected inflation.
We saw this data showing S&P 500 performance following 200-basis point increases in Fed Funds. Only during the stagflationary environment of the early 1970’s did the S&P 500 not show a positive response to higher interest rates. During that time period, the United States was mired in a deep recession and dealing with an oil embargo. Conditions today are much better than they were during that era.
|
Fed Raising Rates by 200 bps |
Fed Funds Rate change (over the period) |
S&P 500 Index change (over the period) |
|
July 1954 to October 1957 |
2.7% |
+33% |
|
May 1958 to November 1959 |
3.4% |
+32% |
|
May 1967 to September 1969 |
5.2% |
+5% |
|
February 1972 to July 1974 |
9.6% |
-26% |
|
January 1977 to July 1981 |
14.4% |
+28% |
|
February 1983 to August 1984 |
3.0% |
+13% |
|
March 1988 to March 1989 |
3.3% |
+14% |
|
December 1993 to April 1995 |
2.7% |
+33% |
|
June 2004 to July 2006 |
4.2% |
+12% |
|
November 2015 to January 2019 |
2.3% |
+30% |
Data also shows that bull markets usually end on the Fed’s last rate hike, not its first one. We suggest that investors embrace these early rate hikes as a sign of a healthy economy, instead of fear them.
Russia’s Invasion of Ukraine
During the February 2022 Beijing Olympics, there were numerous warnings about Russia invading Ukraine. Over the last month, the tragedy and violence has escalated rapidly. Belarus has sent troops into Ukraine from the north, and a convoy of Russian vehicles is surrounding Kyiv, the capital of Ukraine.
When Vladimir Putin put Russia’s nuclear forces on high alert and its military caused a fire at the nuclear Chernobyl site, the world truly became spooked. Diplomatic discussions have not led to any material progress, and a cease-fire still seems unlikely.
Clearly, the invasion of Ukraine by Russia is causing tremendous human and economic hardships. Over 3 million people (mostly women, children, and the elderly) have fled Ukraine. Cities across the country continue to be assailed. In addition, neighboring countries, like Poland, are being overwhelmed for basic services. Just last week, Russia attacked a Ukrainian military training center that was less than 10 miles from the Polish border. Following this attack, the US warned that NATO would respond if Poland were to be hit by a Russian bomb.
On most subjects, America remains politically divided: Democrats versus Republicans. However, almost all Americans are supportive of assisting Ukraine, both financially and with military aid. The more controversial aspect is what economic sanctions to impose on the Kremlin and whether or not the US will outright ban the purchase of Russian energy. In normal environments, financial markets are regulated by stringent legal rules and trust. During war, trust tends to collapse, and rules can quickly change.
Stock Performance During Conflicts
The war in Ukraine is clearly rattling markets. Market volatility is always expected when there are geopolitical and regional conflicts. Add rising inflation, and certain analysts begin to call for a recession.
According to Ned Davis Research, since 1907, there have been over 50 crisis events. During these periods, the DJIA (the Dow Jones Industrial Average) has fallen by an average of (7.1%). What is interesting to note is that stocks tend to bounce back and rise once the fighting breaks out. In the six months following the start of a crisis, the DJIA gains an average of +9.7%. Data compiled by BMO shows similar results, that 12 months after a geopolitical conflict commences, the S&P 500 gains an average of +8.0%.
When Russia began its invasion on February 24th, 2022, global stock markets suffered, and market volatility followed. But based on history, the markets will breathe a sigh of relief, return to the fundamentals of corporate earnings, and benefit from economic growth.
Energy
We are FINTECH investors and clearly not energy analysts. However, we always utilize various scenarios to understand how our businesses are impacted by volatile markets. Now is not the time to begin to understand which of your businesses is impacted by dramatically rising commodity costs.
Last year, even after doubling in price, natural gas remained one of the world’s cheapest forms of energy. In the US, natural gas trades at roughly 1/10 th of the price that Europe pays. The US is currently exporting about 10% of its daily output, in the form of LNG (liquefied natural gas). In January, the US passed Russia as Europe’s leading LNG exporter, and that number is expected to grow by 50% by 2027.
The last period of high oil prices (over $100 per barrel) was from 2011 to 2014. Not to continue to “beat the drum” for the stock market, but the S&P 500 increased by over +65% during that time period, which means that higher oil prices do not necessarily mean an economic recession is imminent. The shale boom was unfortunately heavily financed with debt, so when prices eventually plummeted, it led to a wave of bankruptcies. Now, as prices have soared, some worry that shale producers will be slow to ramp back up supply. We disagree!
At the end of last year, shale producers had a break-even cost of $37 per barrel. With oil trading 3x those levels, there is ample profit to be made, and the incentive to come back online is high. In the Permian basin, shale exploration and rig activity are already back to about 70% of pre-pandemic levels. In fact, with technology advancements, oil production in this region is close to crossing an all-time high, above 5 million barrels per day. In the Haynesville (known for its natural gas), activity is already at its highest level in a decade. US oil production in February was over 8.5 million barrels per day, which is close to the all-time record production set in November of 2019.
According to sell-side analysts who cover the energy industry, spending budgets among US independent producers are up mid-teens, year-over-year. Chris Wright, CEO of Liberty Oilfield Services, said, “Drilling economics today are better than they’ve ever been since the shale revolution started.” We anticipate that production will continue to ramp up, but management teams may look to employ less leverage than in the past. The key will be if these companies can kickstart production and have enough labor and key resources to meet their goals.
Exchanges
We define FINTECH as “anything utilizing technology to improve an established process.” Many of our loyal readers know we find the exchange space to be a great example of FINTECH businesses. When turmoil strikes, traders seek the tightest bid/ask spreads and the best liquidity. We believe that occurs on exchanges like the Chicago Mercantile Exchange (ticker CME), Intercontinental Exchange (ticker ICE), New York Stock Exchange, Nasdaq (ticker NDAQ), and Chicago Board Option Exchange (ticker CBOE). Working as a middleman, intermediary or toll-taker, these exchanges are generating very high incremental margins and free cash flow. There will winners and losers on each trade, but “the house” continues to earn sustainable and recurring revenue.
A month or two ago, most traders were focused on Fed interest rate changes in 2022 and 2023. Today, traders are occupied by crude oil, natural gas, and commodity swings. CME has the most diversified set of tradeable contracts, spanning interest rates, equities, foreign currencies, commodities, agricultural products, energy, and metals. A couple of dominant products traded on the ICE are Brent crude oil and natural gas contracts.
During periods of heightened volatility, the exchanges strictly adhere to their risk management techniques and safeguards. This ensures trades are properly collateralized and smoothly running through their centrally cleared and vertically integrated clearinghouses. This isn’t the “first rodeo” for these exchanges, as many not so fondly recall the Lehman Brothers and Refco bankruptcies.
As commercial customers and banks interact on the exchanges, clearinghouses must follow their dynamic risk scoring practices. Stringent financial protections exist to ensure customer defaults do not occur. As investors in the exchanges, we track numerous items to confirm trading is smooth during these periods of stress. We like to monitor open interest levels, real-time trading results, margin rules, guaranty funds, waterfall protections, corporate contributions, and exchange assessment powers.
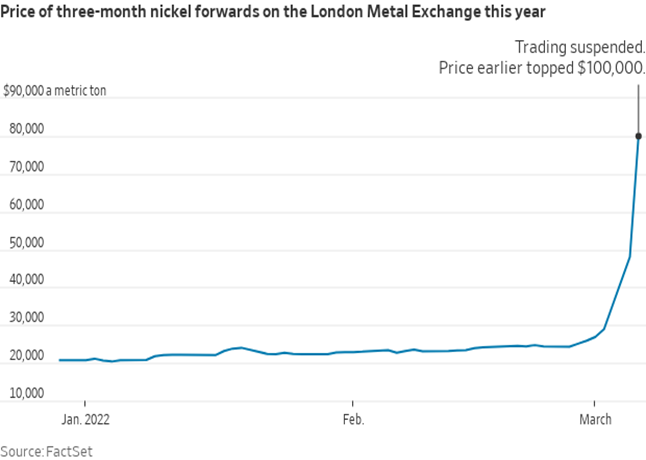
Each crisis and market environment presents its own set of challenges. For example, the nickel market (as seen in this chart) just experienced some violent price moves. Nickel trades on the London Metals Exchange (LME), and problems with short squeezes caused certain brokers to miss important margin calls. This was the first time that the LME suspended trading on a metals contract since the collapse of an international tin cartel in 1985.
Factset chart (Factset chart)
We have had conversations with all of our exchange holdings, and we have received assurances that there have been no material clearing or market structure issues, like those experienced by the LME with nickel. Whether it is nickel, crude oil, natural gas, or wheat, commodities are experiencing significant price changes. We want to ensure that our exchanges manage this market stress and do not have any resultant dislocations.
Few individuals knew the current geopolitical events were going to occur, and even fewer understood the ramifications of a Russian invasion. But the end result is often the same: a material increase in the number of trades that occur in these important commodities. Instead of investing or speculating on highly volatile commodities, we prefer to invest in the exchanges where those products trade. With our large exposure to the exchange industry, we benefit from skyrocketing volumes, without any material clearing or counterparty risk. As volatility explodes higher, we are confident that our exchanges are navigating these turbulent times and also generating excellent free cash flow.
With the Russian and Ukrainian conflict, ADV (average daily volume) has been up over +20% year-over-year. Some complain that elevated volumes this year will create a high comparison to grow over next year. However, we are fairly certain the market will have another crisis to wrestle with next year.
Russia
The Russian economy makes up only 2% of global GDP. For S&P 500 companies, combining both Ukraine and Russia accounts for only 1% of revenue and profit. Despite a global economy that has become hugely intertwined, Russia isn’t nearly as integrated as other developing countries.
During a time when oil, gas, and metals markets are experiencing tight supplies and surging demand, disruptions from Russian output is driving up prices. With concerns that rising oil prices could kill the economic expansion and bull market, many investors are wondering if their investments are prepared for what might come.
As this chart from the EIA (US Energy Information Administration) shows, the global oil supply is quite diverse. Russia, the world’s largest exporter of natural gas, is the third-largest oil producer. The US is the largest, followed by Saudi Arabia.
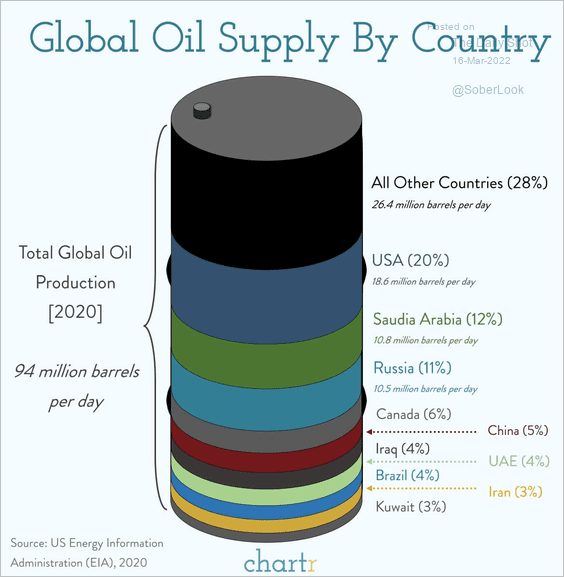
EIA chart (EIA chart)
We have seen estimates that oil and gas exports account for roughly 40% of Russia’s revenue and 60% of its exports. According to Bruegel think tank, the EU imported 45% of its natural gas from Russia last year. European dependence upon natural gas from Russia makes banning importation almost unbearable.
When the Soviet Union invaded Hungary in 1956, Western Europe continued to trade with it. When the USSR invaded Czechoslovakia in 1968 and Afghanistan in 1979, trading still occurred. German Chancellor Olaf Scholz recently halted the certification of the Nord Stream 2 pipeline, owned by Russia’s state-backed energy company Gazprom, but somewhat reluctantly. Germany’s government stated: “It would take three years to become independent of Russian gas.” This is clearly not a spigot that can easily be turned off.
This Nomura chart shows key Russian exports. While most investors knew energy was Russia’s main export, many were surprised to find out that Russia is a low-to-high teens percentage of the world trade in nickel, wheat, platinum, lumber, and aluminum.
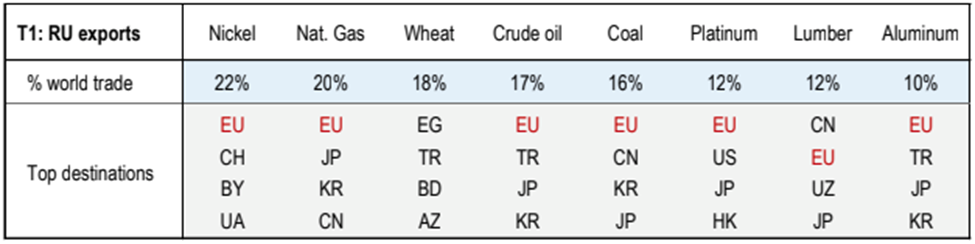
Nomura chart (Nomura chart)
Also of note, the EU is the top destination for most of Russia’s exports, as indicated in the chart in red, and it is the EU’s fifth-largest trading partner.
Over the last three decades, the world has become more and more intertwined. Now, valuable commodity and input materials are at risk of delaying supply and manufacturing operations. It isn’t only energy, but many important inputs to everyday products. Because of the global nature of manufacturing, sanctions against Russia will cause derivative problems across multiple verticals.
Sanctions
Russia’s army has initiated a “military” war against Ukraine, and the world has responded with “economic” warfare against Putin, his allies, and Russia’s economy. In the past, sanctions have targeted small or isolated countries, like Cuba, Iran, and Myanmar. Russia is twice the combined size of any economy that the US has ever embargoed. The potential disruption from recent sanctions is only beginning to be understood.
Western sanctions sent the ruble into a nosedive, with the currency tumbling over 40% to an all-time low versus the US dollar. In response, Russia’s central bank more than doubled its interest rate to 20%, boosted liquidity, and ordered exporters to sell 80% of their hard currency revenues. In another bid to shield some of its assets, Russia partially re-opened its stock market, after a nearly month-long suspension of trading. This did little to protect Russia’s largest bank, Sberbank, which has fallen by over 70%.
The world economy is truly integrated, and two small bonds provide evidence of this. These Russian bonds were trading at $0.20 on the $1, and the rating agencies were preparing to deem them an official “default.” There are numerous factors that go into this type of declaration, but these debt securities have an impact on Russia’s ability to finance its economy, debt, and infrastructure. The Kremlin threatened to repay international bondholders with deflated rubles, but ultimately acquiesced. Russia made a modest interest rate payment of $117 million, but sanctions made this payment a challenge.
While Russia likely has the money to service its debts (from energy sales), it is struggling to access it. Russian Finance Minister Anton Siluanov claimed that making this payment was a strain on his country’s finances, as nearly half of its $643 billion in foreign reserves have been frozen. The likely outcome from sanctions is a deep Russian recession, but there does not enough appear to be enough integration with other economies to cause a global crisis.
Russia is being pressured in other ways as well. Norway’s sovereign wealth fund (Norges Bank Investment Management) is one of the world’s largest funds with over $1.3 trillion in assets. It just announced that it will no longer own (and ultimately sell) all of its Russian positions.
The sanctions on Russia have turned an already precarious energy situation into a deeper problem. Will this lead to further issues with food costs? Will populist parties leverage this uncertainty to political gains? Time will tell, but clearly, there has been a major shift in the assumptions underpinning our existing financial asset landscape.
Seizing Yachts
Another interesting twist occurred when the US imposed sanctions on certain billionaire Russian oligarchs. It has been reported that $39 billion was seized from Putin’s close friends on the first day.
But many Russian oligarchs seem to be masters of the dark art of global asset protection. Some use shell companies, trusts, or offshore jurisdictions to hide true ownership of assets. Russian oligarch Alisher Usmanov’s 512-foot yacht called Dilbar is registered in the Cayman Islands through a Malta-based corporate entity.
It isn’t the only yacht owned by a separate legal entity, rather than by an individual. Many are registered in countries with favorable trust privacy laws, like the Cayman Islands, British Virgin Islands, and Panama.
We wonder how much real estate in London and Miami is registered to Russian-owned entities.
SWIFT Sanctions
On February 26, 2022, the EU, US, UK, Australia, Japan, and Canada agreed to block Russian banks from the SWIFT (Society for Worldwide Interbank Financial Telecommunication) network. SWIFT is the dominant global financial-messaging infrastructure that connects most of the world’s banks. This bank-owned global cooperative (based in Belgium) delivers financial messaging services to about 11,000 member banks in over 200 countries.
The last major country to get disconnected from SWIFT was Iran, back in 2018. Due to its exclusion, it is estimated that Iran lost half of its oil export revenue and 30% of all foreign trade. The cutoff from SWIFT terminated all international transactions, triggered huge currency volatility in the Iranian rial and caused massive capital outflows.
In 2020, it was estimated that Russia made up 1.5% of all transactions within the SWIFT network. Projections predict that the removal of Russian banks from SWIFT would cause its GDP to fall by over 5% (per the Carnegie Moscow Center). T he sanctions initially targeted two state-owned Russian banks, Vnesheconombank (VEB) and Promsvyazbank (PSB), and then hit the 42 distinct subsidiaries.
A bank being unable to make necessary payments is similar to Lehman’s inability to make payments through trading clearinghouses during the Financial Crisis. These actions have widespread and often misunderstood or unintended consequences. Banks play a crucial role in carrying out sanctions, as they oversee and control the flow of money in and out of Russia. As these sanctions become better understood, we wonder how these missed payments will ripple through the global economy.
A Russian Bank That Avoided Sanctions:
Unlike the two large, state-owned Russian banks hit with sanctions last month, Gazprombank (Russia’s third-largest bank) has so far gone unscathed. Why? The simple answer is energy.
Gazprombank was specifically created to serve the financial needs of Russia’s largest natural gas exporter: Gazprom. When Russia’s economy crashed in 1998, Gazprombank essentially took over most of the gas export contracts with foreign countries. That made this specific bank a key dealer of foreign currencies, as well as the primary link between Russia and the global financial system. Gazprombank has correspondent-banking relationships with several Western banks, which enables it to move US dollars, euros, and other currencies on behalf of its important Russian clients. The bank is a vital component of trading, as it serves as the only way for countries to pay for Russia’s natural gas exports. Until foreign countries can wean themselves off of Russian energy, Gazprombank will likely stay off of SWIFT’s list of banned banks.
SWIFT Alternatives
To cushion the economic blow from its expulsion from traditional financial payment networks, Russia has taken targeted steps. The Kremlin has built a Russia-based SWIFT rival called the System for Transfer of Financial Messages. This platform has the potential to serve as a substitute for SWIFT usage. In addition, Russia sponsors the CIPS network, and approximately 1/2 of its global cross-border payments use this network.
As countries continue to purchase Russian oil and natural gas, we assume Russia’s specific platforms can be used for payments, avoiding SWIFT entirely. If these Russian platforms were also to face sanctions, businesses that purchase oil and gas could revert back to pre-1973 modes of communication, like telex and the telephone. While less secure, they could serve to temporarily assist Russia in funding its energy sales.
The Russian government may not have properly assessed the Ukrainian willingness to fight or the resolve of the country’s people, but it isn’t terribly surprised by many of these economic sanctions. Unfortunately, most of the brunt of these sanctions fall onto ordinary Russian citizens, not Vladimir Putin. Cutting off Russia’s banks from SWIFT sanctions are one tool, but we are certain that Putin will find other economic alternatives. Russia has had eight years to understand Western sanctions, and it has enacted safeguards to protect its economy. Completely cutting Russia off from global financial networks is just one way to economically penalize their aggressive behavior. The hope is that asset seizures will lead to Russia going bust, just like the Soviet Union did during the Cold War.
No More Big Macs
As governments have isolated Russia with sanctions, other businesses have made critical decisions about their specific Russian exposure. Terminating Russian businesses because of the unprovoked invasion of Ukraine might seem like a simple and effective punishment, but that course of action can materially alter manufacturing, supply chains, financial institutions, and millions of individual workers.
Industries from oil to media to consumer brands have severed or suspended operations in Russia, and the burden to act is now spreading to the food businesses. McDonald’s temporarily closed all of its Russian locations (9% of total revenue, 3% of total operating income), as did Starbucks, Coca-Cola, Pepsi and Yum Brands (Kentucky Fried Chicken, Taco Bell, Pizza Hut, etc).
FedEx and UPS suspended transportation and shipments into Russia. Intel and AMD have suspended chip shipments into Russia, and Goldman Sachs and Morgan Stanley have also ceased operations there. BP has done business in Russia for three decades, but it decided to divest its 19.75% stake in Russian oil company Rosneft, leading to a whopping $25 billion charge. Unfortunately, all of these actions will impact the innocent Russian people, as opposed to penalize their ruthless dictator.
Competition to Visa and MasterCard
We hate to make grandiose assumptions, but we’re pretty sure nobody reading this newsletter has a Mir card (seen here).

Free MIR card picture (Free MIR card picture)
Following the Crimean invasion of 2014, Russia began to promote its own domestic payment network, called Mir. We couldn’t make this up if we tried, but Mir translates in Russian to “world” and “peace”.
Understanding its reliance upon the Visa and Mastercard platforms, Russia has made Mir a focus for its economy’s transactions. In terms of new card issuance, Mir now captures 1/3 rd of all Russian financial institution cards. Back in 2016, Mir only had 2 million branded cards, but now there are close to 100 million cards in force.
NSPK (National Payment Card System) operates the Mir network and essentially runs its financial plumbing. Back in 2016, NSPK had only 0.6% market share, but that has increased to roughly 25% today. Mir competes with international networks like Visa and Mastercard, but unlike these two giants, Mir is not a globally accepted brand outside of Russia and some smaller Eastern European countries.
So why have Visa and Mastercard, both widely accepted in over 200 countries and at millions of different merchants and retailers, failed to experience enormous growth in China?
Because, for years, China’s government has been instituting its own form of domestic protection by supporting a state-sponsored payment platform called UnionPay (CUP). According to Reuters, major Russian banks are now rushing to issue CUP branded cards, to allow their citizens to transact globally.
Maybe some of China’s domestic payment protections are in place to ensure Western governments cannot shut down its economy? Maybe, the Chinese government wants to continue to have insight into the transactions of its citizens? Either way, countries like China, Iran, North Korea, and Venezuela will examine the sanctions Russia is experiencing and take the necessary precautions to safeguard their economy versus hostile governments.
India already has taken steps to force card networks to use domestic host payment transactions. The RBI (the Reserve Bank of India) has passed rules that require foreign card networks to store Indian payment data within the country, so the regulator can have “unfettered supervisory access.”
In the long run, these sanctions might fuel the creation of domestic protections that have the potential to negatively impact some of our payment holdings.
Payments
Our regular readers know that we view the payments industry as the quintessential FINTECH industry. Whether it is the payment networks, gateways, acquirers, or processors, we appreciate earning predictable and recurring revenue per swipe.
The networks have not been immune to the war in the Ukraine, as Visa, Mastercard, American Express, and PayPal have all banned card transactions inside of Russia. Depending on the network, this accounts for 3% to 5% of their payment volumes. While Russians holding Visa and Mastercards cannot transact outside of Russia, these branded cards still work domestically, as those transactions run on the NSPK network.
As sanctions take hold and cause significant economic hardships inside of Russia, the rest of the world continues to migrate away (slowly but surely) from cash and towards card-based payments. For the first time ever, worldwide eCommerce sales will exceed $5 trillion this year. In New York City, over 2.4 million packages are delivered each and every day. Over the next five years, it is expected that $14 trillion of global consumer payments will migrate from cash to cards.
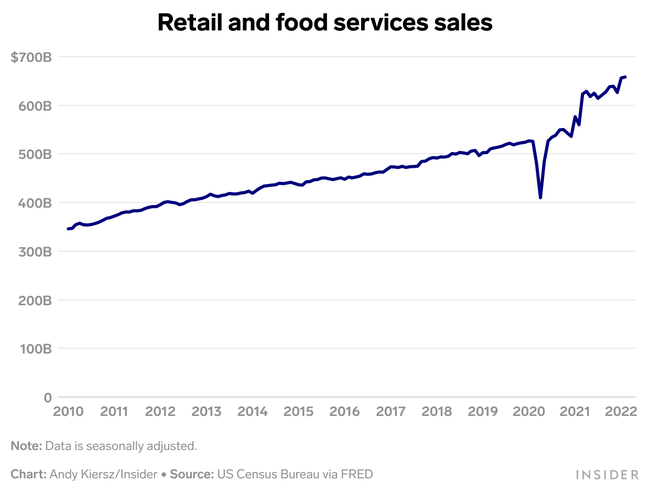
US Census Bureau chart (US Census Bureau chart)
If we ignore the year-over-year fluctuations from war and COVID, we can clearly see in this US Census Bureau chart the steady growth in retail and food service sales, dating back to 2010. Stripping out the massive decline experienced in early 2020, current sales are nearing 2x the level of 2010. These transactions continue to occur with cards, as opposed to checks and cash.
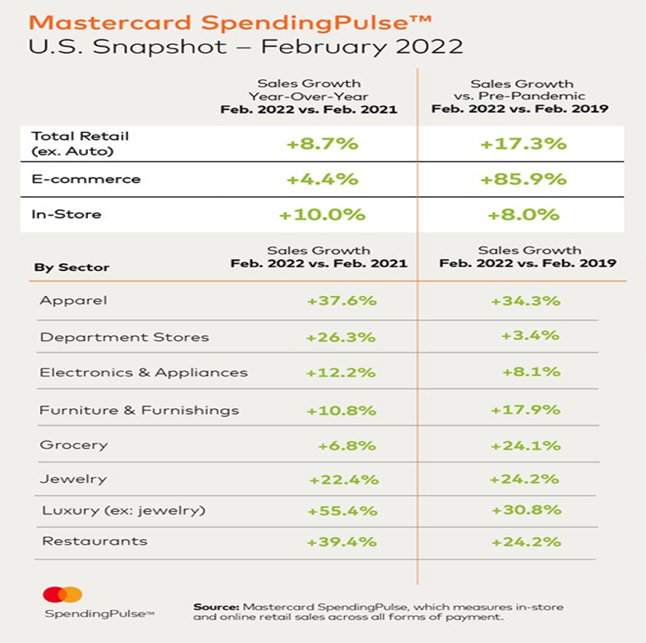
Mastercard provides evidence of global retail spending trends, with its monthly Spending Pulse metrics. These are not just transactions on the Mastercard network, but measurements of all in-store and online retail sales, across all forms of payments.
In February 2022, global retail spending impressively grew +8.7% year-over-year, but we prefer to look at results and compare the numbers to 2019, pre-COVID. Global retail spending was up +17.3% last month versus February 2019. In addition to total spending, we like to analyze eCommerce trends, as online shopping must be completed with a digital form of payment (not cash). eCommerce spending was up +4.4% year-over-year, but up an eye-opening +85.9% versus pre-COVID 2019. One never can predict which verticals will be “hot” and which will be “soft,” but one key trend remains: the migration away from cash towards digital forms of payments.
Take a look at this Mastercard chart to see which verticals and segments are showing relative strength. Just keep in mind, regardless of which product, service, or industry is doing well, all of those transactions are likely to occur on one of our payment networks.
Mastercard Spending Pulse chart (Mastercard Spending Pulse chart)
So, do what Americans are great at – SPEND! Whether it is at the mall or on vacation or at a restaurant, spend with the most convenient card in your wallet (or phone).
Rest assured, your portfolio will benefit from this, even if it is fractions of a penny, billions of times. To better understand exactly how the economics of a card transaction works, click on our proprietary research here or here or here.
Fundamentals Still Matter
We continue to believe that fundamentals are the primary driver of equity returns. In our perspective, the ability to generate free cash flow is critically important, especially in periods of stress and uncertainty. As we consistently discuss, there are several characteristics we look for in any of our investments. Click here to view our investment presentation and see the important traits we require in our holdings. One of the most important aspects our of investment philosophy is that management teams rationally allocate “our capital” on their balance sheets.
As this chart from S&P Dow Jones shows, dividends have steadily increased since the Financial Crisis, but stock buybacks are much more volatile as compared to traditional dividends.
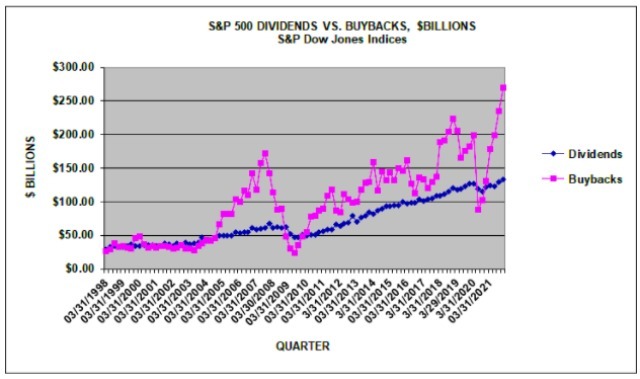
S&P Dow chart (S&P Dow chart)
Following the initial shock of COVID in the 1 st quarter of 2020, buybacks have been the dominant capital allocation tool for many management teams. The amount spent by companies in the S&P 500 for buybacks hit a record in the 4th quarter of 2021 of $270.1 billion.
For 2021, share repurchases hit a record of $881.7 billion, up 70% versus 2020. Analysts at Goldman Sachs expect buybacks to hit a record $1 trillion this year. Stock buybacks have been running over $250 billion per quarter and should remain healthy, especially with this recent pullback in equity valuations and stock prices.
From our companies, we have heard “loud and clear” that they intend to purchase shares in the businesses they know the best and have the most confidence in – themselves. For example, Visa just announced a $12 billion stock buyback, and Mastercard approved a $8 billion authorization. Instead of spending significant amounts of capital on uncertain M&A, our companies are re-investing back into their businesses, in the form of R&D and buybacks. If stock prices remain depressed, these buybacks should boost earnings growth.
Conclusion
When talking heads on TV say to immediately put 100% of your portfolio in cash or rush to Treasuries and safety, it reminds us to focus on March of 2009, or March of 2020, or today – March of 2022.
The environment in late 2008 and early 2009 was maybe the most unsettling of our 25+ years on Wall Street. The markets were under tremendous stress, and financial entities, banks, and brokerages seemed to be failing daily. March 9th of 2009 was the peak of despair and worry. The S&P 500 declined by more than (50%). The fear was palpable.
After a year-long bear market, particularly harsh on the Financial sector, the stock market began a massive rally. The S&P 500 has increased by more than +500% since the Financial Crisis. Those who remained patient and did not panic have materially benefitted. The way forward is never clear or obvious. During periods of stress, one must adhere to a disciplined strategy and process. That is what we do each and every day.
Today, inflation is simply too high, but there are numerous reasons for this. Over the next one to two years, the Fed will raise interest rates and decrease the size of its balance sheet. These tightening decisions should not materially alter the positive underlying fundamentals of our robust economy. Corporate earnings remain resilient, the labor market is exceptionally strong, household incomes are solid, and consumer demand is sound.
A few months ago, this newsletter would have been filled with items and metrics regarding our sharp, economic rebound. Instead, we spent too much of our attention on the war, sanctions, and other uncertain items. But rest assured, this will eventually pass, and the good news that is being overlooked right now will soon become the market’s focus.
We strongly believe the US’s pent-up economic demand will spur the global economy and ultimately raise stocks prices. We see an environment where sentiment about the economy and markets is more negative than positive, which signals an unmistakable “wall of worry” that excellent, free cash flowing FINTECH stocks should climb. We know that eagerly anticipating the next Fed rate hike might not be as exciting as the NCAA’s March Madness tournament, but it can be more profitable than betting on the #1 seeds, right?
Warren
Warren Fisher, CFA
CEO of Manole Capital Management
Cliff Clavin Fun Facts:

Free Cliff pic (Free Cliff pic)
In the 1980’s, one of our favorite TV shows was “Cheers.” The know-it-all postal worker was named Cliff Clavin, played by John Ratzenberger. This segment of our quarterly newsletter highlights some useless information that Cliff would be proud of.
Florida once again holds the title of “Lightning Capital of the US.” Our sunshine state averaged 223 lighting events per square mile in 2021, edging out Oklahoma, which earned 2nd place.
In the NCAA Men’s basketball tournament this year, the St. Peters Peacocks became the first-ever 15-seed to win three games and advance to the Elite 8. Unfortunately for the Peacocks, their Cinderella season ended with a loss to the University of North Carolina.
With Russia’s invasion of the Ukraine, the S&P 500 experienced a decline of (2.95%), its worst day since October 2020. During the Financial Crisis (September 2008 to March 2009), the S&P 500 experienced one-day declines of this amount 30 times.
Before it ultimately went bankrupt on September 15th, 2008, Lehman Brothers (ticker LEH) stock had five distinct rallies of +24%, +53%, +26%, +70% and +34%.
Ned Johnson, who led the Fidelity business started by his father into a financial powerhouse, died at the age of 91. Ned ran Fidelity from 1972 through 2014 and oversaw its growth from $3.9 billion to over $2 trillion in assets. In 1963, Ned was the first manager of Fidelity’s flagship fund: Magellan. In eight years of managing Magellan, Ned beat the S&P 500 by an annual average of 22%. As CEO, Ned introduced 401(k) retirement plan management, launched one of the first financial supermarkets, pioneered the sale of mutual funds directly to individual investors (as opposed through stockbrokers), and spearheaded the elimination of those annoying upfront sales charges of 8%. In addition, Ned was the first to offer money market funds permitting customers to actually write checks off of their balances, to compete head on with traditional bank accounts.
Fidelity is now led by Ned’s daughter Abigail, and it has an enormous $4.2 trillion in assets under management. Despite being criticized by Moody’s Investors Services in 2007 for its opaque succession planning, Abigail has overseen material growth at Fidelity. It has more than 35 million individual investors, 25,500 business retirement benefit plans, and 13,500 financial advisory firms. Fidelity remains a closely-held private company, as opposed to a publicly-traded entity, making it unique within its field.
DISCLAIMER:
Firm: Manole Capital Management LLC is a registered investment adviser. The firm is defined to include all accounts managed by Manole Capital Management LLC. In general: This disclaimer applies to this document and the verbal or written comments of any person representing it. The information presented is available for client or potential client use only. This summary, which has been furnished on a confidential basis to the recipient, does not constitute an offer of any securities or investment advisory services, which may be made only by means of a private placement memorandum or similar materials which contain a description of material terms and risks. This summary is intended exclusively for the use of the person it has been delivered to by Warren Fisher and it is not to be reproduced or redistributed to any other person without the prior consent of Warren Fisher. Past Performance: Past performance generally is not, and should not be construed as, an indication of future results. The information provided should not be relied upon as the basis for making any investment decisions or for selecting The Firm. Past portfolio characteristics are not necessarily indicative of future portfolio characteristics and can be changed. Past strategy allocations are not necessarily indicative of future allocations. Strategy allocations are based on the capital used for the strategy mentioned. This document may contain forward-looking statements and projections that are based on current beliefs and assumptions and on information currently available. Risk of Loss: An investment involves a high degree of risk, including the possibility of a total loss thereof. Any investment or strategy managed by The Firm is speculative in nature and there can be no assurance that the investment objective(s) will be achieved. Investors must be prepared to bear the risk of a total loss of their investment. Distribution: Manole Capital expressly prohibits any reproduction, in hard copy, electronic or any other form, or any re-distribution of this presentation to any third party without the prior written consent of Manole. This presentation is not intended for distribution to, or use by, any person or entity in any jurisdiction or country where such distribution or use is contrary to local law or regulation. Additional information: Prospective investors are urged to carefully read the applicable memorandums in its entirety. All information is believed to be reasonable, but involve risks, uncertainties and assumptions and prospective investors may not put undue reliance on any of these statements. Information provided herein is presented as of December 2015 (unless otherwise noted) and is derived from sources Warren Fisher considers reliable, but it cannot guarantee its complete accuracy. Any information may be changed or updated without notice to the recipient. Tax, legal or accounting advice: This presentation is not intended to provide, and should not be relied upon for, accounting, legal or tax advice or investment recommendations. Any statements of the US federal tax consequences contained in this presentation were not intended to be used and cannot be used to avoid penalties under the US Internal Revenue Code or to promote, market or recommend to another party any tax related matters addressed herein.
Be the first to comment