

gradyreese/E+ via Getty Images
A possible recession is on the minds of many investors right now, and for understandable reasons.
Ben Carlson 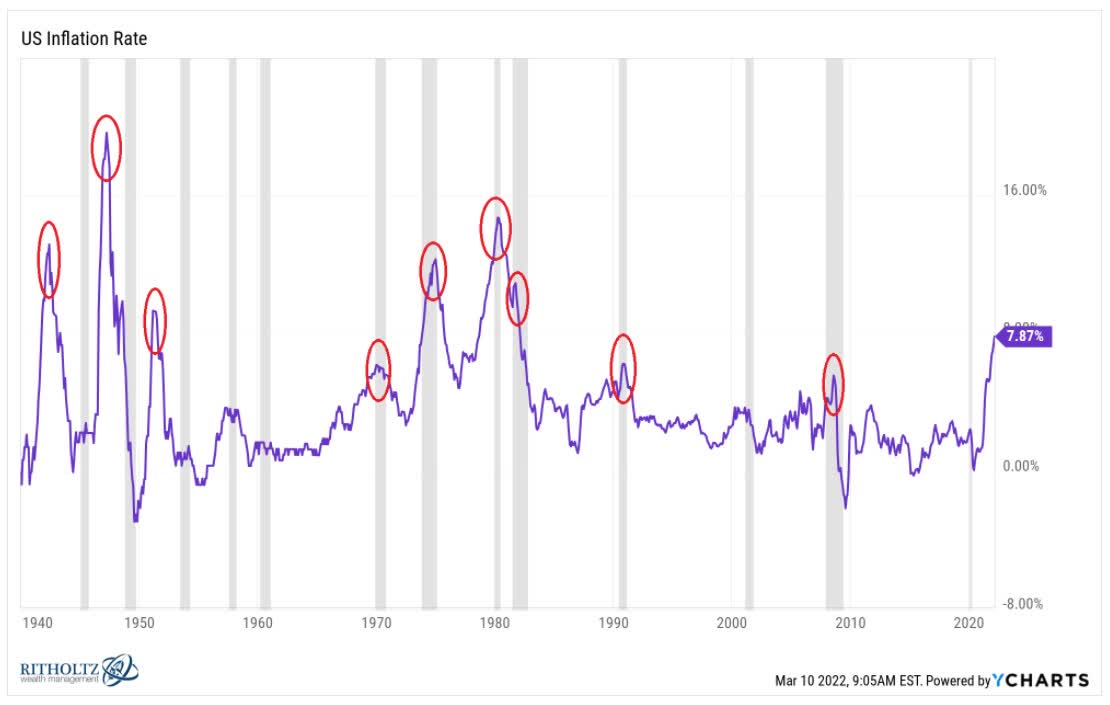
Never in recorded history has inflation been above 5% and the US avoided falling into a recession within a few years.
Well, inflation just hit 8.5% in March, and producer prices just came in at 11.2%, the highest ever recorded.
Consumer prices tend to lag producer prices by about three months, and JPMorgan thinks inflation might peak around 10% by June.
But even after it has peaked high inflation is likely to continue pressuring consumers’ ability to spend.
Charlie Bilello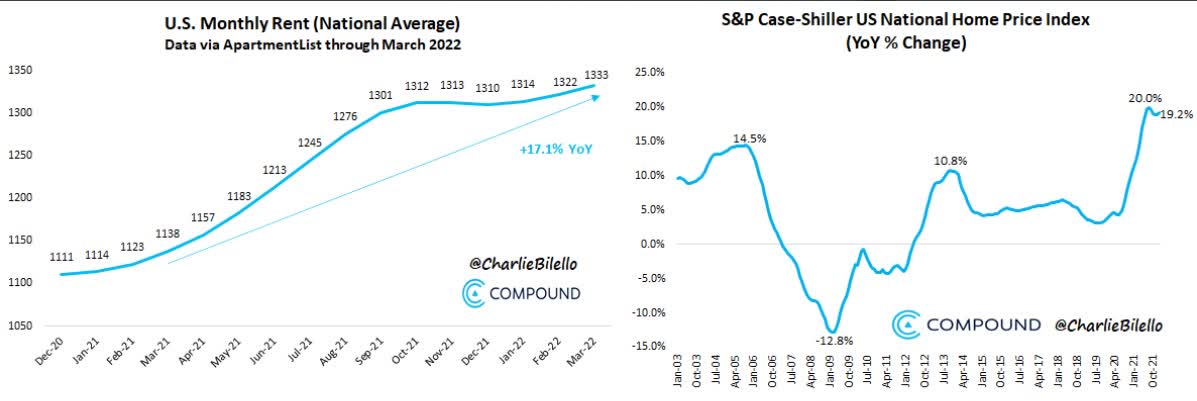
For one thing, actual inflation is a lot higher than the reported figure.
33% of households’ budgets are for housing and home prices are up 19% and rent prices are up 17% in the last year.
Charlie Bilello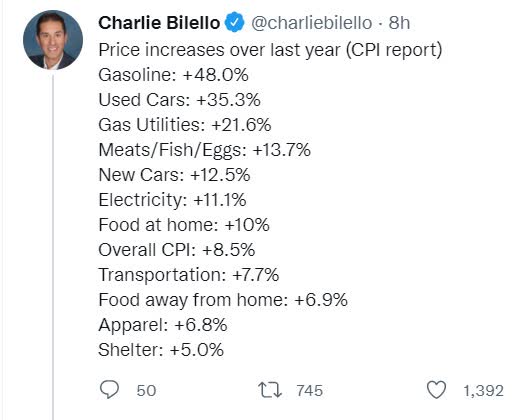
About 80% of household spending is on necessities like housing, transportation, healthcare, and food.
And the prices of all of these things are soaring right now.
Charlie Bilello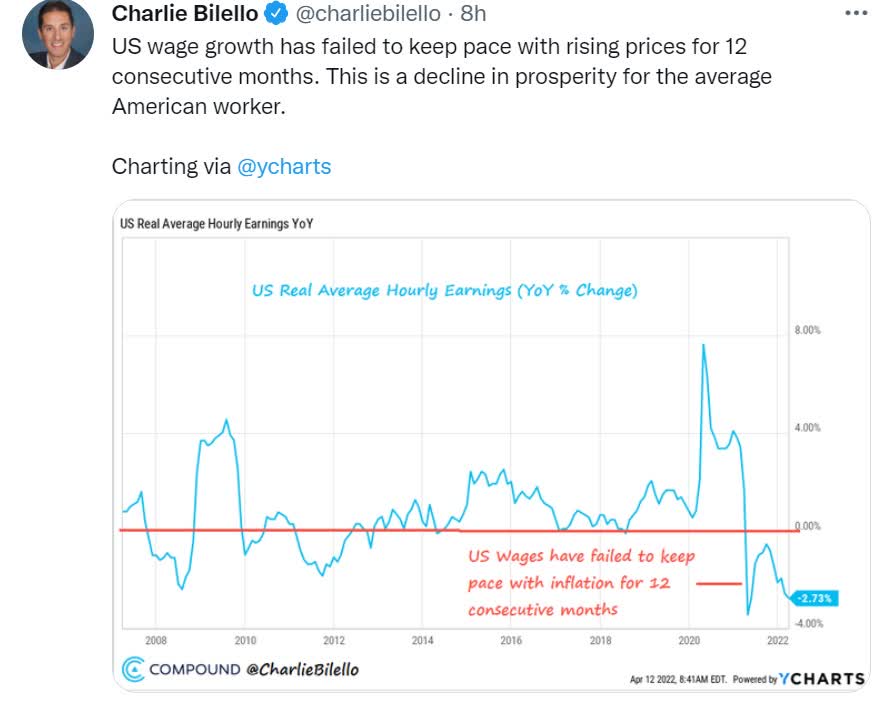
For the last year, the average American has been getting steadily poorer, at least in terms of real purchasing power.
And 65% to 70% of the US economy is powered by consumer spending.
In other words, it’s hard to splurge on a trip to Disney World when you can barely afford the rent.
But there is good news about a future recession.
David Rice 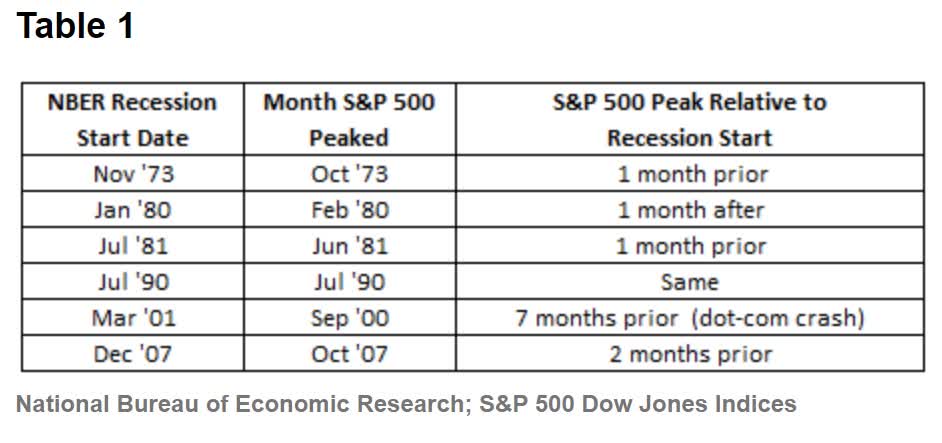
The stock market doesn’t tend to start a bear market until, on average, 50 days before a recession begins.
And the economic data, including 18 leading indicators and the yield curve, the most accurate recession prediction tool ever discovered, doesn’t think a recession is coming anytime soon.
(Source: Final Countdown)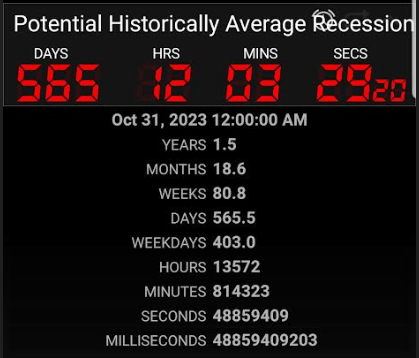
In fact, all the data is pointing to a late 2023 recession start, and possibly not until 2024 or even late 2025.
In other words, there is plenty of time to prepare ourselves emotionally and financially to ride out whatever economic storm may be brewing.
So let me show you, step-by-step, how you can use 11 of the world’s best blue-chips, along with a handful of low-cost ETFs, to build the ultimate sleep well at night, bunker recession-resistant portfolio.
Follow me, to learn how you too can retire in safety and splendor no matter what the economy throws at us in the next few years and decades.
How To Find The World’s Safest Blue-Chip Bargains
One of my favorite DK tools is the safety and quality list.
(Source: DK Safety & Quality Tool) updated daily, sorted by overall quality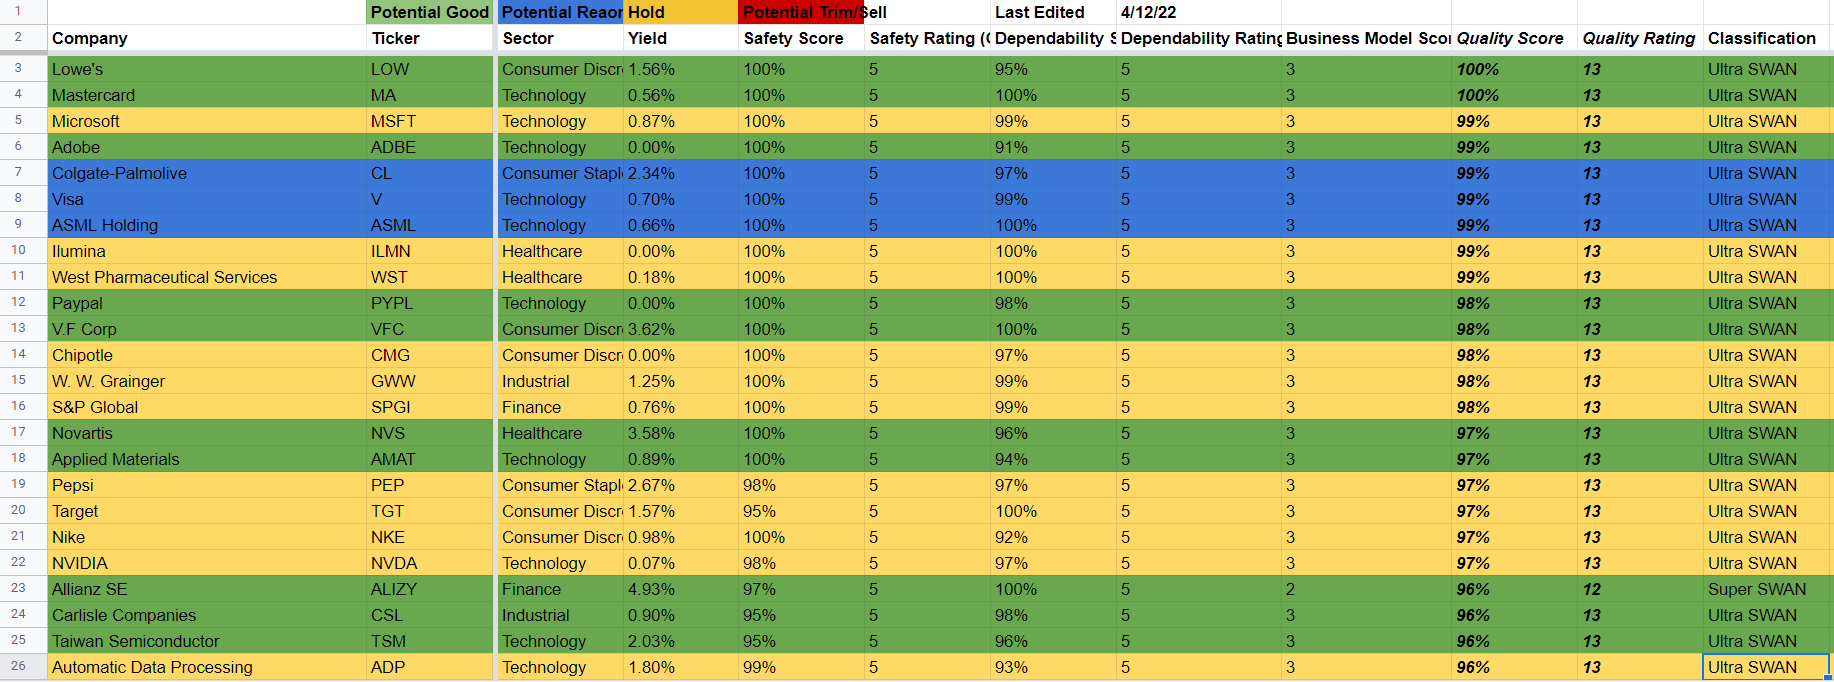
- green = potentially good buy or better
- blue = potentially reasonable buy
- yellow = hold
- red = potential trim/sell
This is sorted each day by overall quality on one of the most comprehensive and accurate safety and quality models on earth.
The Dividend King’s overall quality scores are based on a 248 point model that includes:
- Dividend safety
- Balance sheet strength
- Credit ratings
- Credit default swap medium-term bankruptcy risk data
- Short and long-term bankruptcy risk
- Accounting and corporate fraud risk
- Profitability and business model
- Growth consensus estimates
- Management growth guidance
- Historical earnings growth rates
- Historical cash flow growth rates
- Historical dividend growth rates
- Historical sales growth rates
- Cost of capital
- GF scores
- Long-term risk-management scores from MSCI, Morningstar, FactSet, S&P, Reuters/Refinitiv, and Just Capital
- Management quality
- Dividend friendly corporate culture/income dependability
- Long-term total returns (a Ben Graham sign of quality)
- Analyst consensus long-term return potential
In fact, it includes over 1,000 fundamental metrics including the 12 rating agencies we use to assess fundamental risk.
- credit and risk management ratings make up 41% of the DK safety and quality model
- dividend/balance sheet/risk ratings make up 82% of the DK safety and quality model
How do we know that our safety and quality model works well?
During the two worst recessions in 75 years, our safety model 87% of blue-chip dividend cuts, the ultimate baptism by fire for any dividend safety model.
“In order to win the game first you must not lose it.” – Chuck Noll
And our focus on safety and quality first also helps us achieve fundamentals like these.
DK Zen Phoenix: Superior Fundamentals Lead To Superior Long-Term Results
| Metric | US Stocks | 189 Real Money DK Phoenix Recs |
| Great Recession Dividend Growth | -25% | 0% |
| Pandemic Dividend Growth | -1% | 6% |
| Positive Total Returns Over The Last 10 Years | 42% | 99.5% (Greatest Investors In History 60% to 80% Over Time) |
| Lost Money/Went Bankrupt Over The Last 10 Years | 47% | 0.5% |
| Outperformed Market Over The Last Decade (290%) | 36% | 46% |
| Bankruptcies Over The Last 10 Years | 11% | 0% |
| Permanent 70+% Catastrophic Decline Since 1980 | 44% | 0.5% |
| 100+% Total Return Over The Past 10 Years | NA | 87% |
| 200+% Total Return Over The Past 10 Years | NA | 66% |
| 300+% Total Return Over The Past 10 Years | NA | 44% |
| 400+% Total Return Over The Past 10 Years | NA | 35% |
| 500+% Total Return Over The Past 10 Years | NA | 27% |
| 600+% Total Return Over The Past 10 Years | NA | 23% |
| 700+% Total Return Over The Past 10 Years | NA | 20% |
| 800+% Total Return Over The Past 10 Years | NA | 18% |
| 900+% Total Return Over The Past 10 Years | NA | 18% |
| 1000+% Total Return Over The Past 10 Years | NA | 16% |
| Sources: Morningstar, JPMorgan, Seeking Alpha |
So for this article here’s all I did.
- go down the safety and quality list
- select the highest quality blue-chip in each sector
- that was trading at fair value or better (green or blue color-coding)
This literally took me all of two minutes and gave me the basis for the ultimate Zen Ultra SWAN retirement portfolio to ride out a future recession.
11 Incredible Blue-Chip Bargains For The Ultimate Sleep Well At Night Retirement Portfolio
Here is a diversified and prudently risk-managed Ultra SWAN portfolio.
(Source: DK Research Terminal)
Note UGI’s weighted credit rating from Fitch is BB+ stable making it speculative, and 2.5% or less risk cap, though it’s not actually unreasonable to own more of UGI.
So let me show you why I trust and own these Ultra SWANs in my retirement portfolio.
World-Class Quality You Can Trust In Even The Worst Recession
| Company | Quality Rating (out Of 13) | Quality Score (Out Of 100) | Dividend/Balance Sheet Safety Rating (out of 5) | Safety Score (Out Of 100) | Dependability Rating (Out Of 5) | Dependability Score (out Of 100) |
| Lowe’s | 13 | 100% | 5 | 100% | 5 | 100% |
| Mastercard | 13 | 100% | 5 | 100% | 5 | 100% |
| Colgate-Palmolive | 13 | 99% | 5 | 100% | 5 | 97% |
| Novartis | 13 | 97% | 5 | 100% | 5 | 96% |
| Allianz SE | 12 | 96% | 5 | 97% | 5 | 100% |
| Carlisle Companies | 13 | 96% | 5 | 95% | 5 | 98% |
| Alphabet | 13 | 95% | 5 | 100% | 5 | 89% |
| PPG Industries | 13 | 90% | 5 | 92% | 4 | 89% |
| Enbridge | 13 | 89% | 5 | 88% | 5 | 91% |
| Realty Income | 13 | 85% | 5 | 89% | 5 | 83% |
| UGI Corp | 12 | 83% | 5 | 88% | 4 | 79% |
| Average | 12.8 Ultra SWAN | 93.6% | 5.0 Very Safe | 95.4% | 4.8 Exceptional | 92.9% |
(Source: DK Research Terminal)
For context, the dividend aristocrats average 85% quality and 12.1/13 Super SWAN quality.
This dividend portfolio is one of the safest in the world. How safe?
| Rating | Dividend Kings Safety Score (161 Point Safety Model) | Approximate Dividend Cut Risk (Average Recession) |
Approximate Dividend Cut Risk In Pandemic Level Recession |
| 1 – unsafe | 0% to 20% | over 4% | 16+% |
| 2- below average | 21% to 40% | over 2% | 8% to 16% |
| 3 – average | 41% to 60% | 2% | 4% to 8% |
| 4 – safe | 61% to 80% | 1% | 2% to 4% |
| 5- very safe | 81% to 100% | 0.5% | 1% to 2% |
| Ultimate SWAN Portfolio | 95% | 0.50% | 1.70% |
| Risk Rating | Low-Risk (74th industry percentile risk-management consensus) – speculative | A Stable outlook credit rating 0.66% 30-year bankruptcy risk |
20% OR LESS Max Risk Cap Recommendation (each) |
(Source: DK Research Terminal)
Our dividend safety model is calibrated based on historical recession dividend cut data going back to WWII.
S&P Fundamentals During Recessions
| Recession | S&P Sales Decline | S&P EPS Decline | S&P Dividend Decline | S&P PE Compression |
| 1945 | NA | -6.5% | -8.9% | 33.6% |
| 1948 | NA | 3.4% | 25.1% | -26.6% |
| 1953 | NA | 11.2% | 7.0% | -7.1% |
| 1957 | NA | -15.7% | -3.9% | -6.4% |
| 1960 | NA | -3.1% | 2.9% | 8.6% |
| 1969 | NA | -15.9% | -5.9% | -10.7% |
| 1973 | NA | -18.8% | -9.4% | -54.1% |
| 1980 | NA | -4.8% | -1.2% | 22.1% |
| 1981 | NA | -20.8% | -0.2% | -14.3% |
| 1990 | NA | -27.4% | -2.0% | 1.5% |
| 2001 | -1.2% | -51.4% | -5.7% | -16.3% |
| 2007 | -11.4% | -30.3% | -19.5% | 308.5% |
| 2020 | -3.7% | -14.1% | -2.0% | 26.9% |
| Average | -5.4% | -14.9% | -1.8% | 20.4% |
| Median | -3.7% | -15.7% | -2.0% | -6.4% |
| Max | -1.2% | 11.2% | 25.1% | 308.5% |
| Min | -11.4% | -51.4% | -19.5% | -54.1% |
| Average (Excluding Great Recession & Pandemic) | -1.2% | -13.6% | -0.2% | -6.3% |
| Median (Excluding Great Recession & Pandemic) | -1.2% | -13.6% | -0.2% | -6.3% |
(Sources: S&P, FactSet, Multipl.com)
These Ultra SWANs are so safe that in the average historical recession the risk of any of them cutting their dividends is about 1 in 200.
Even in a severe recession, like the Pandemic or another Great Recession, it’s about 1.7% or 1 in 59.
| Company | Payout Ratio | Industry Safe Payout Ratio Guideline | Debt/Capital | Industry Safe Debt/Capital Guideline |
| Lowe’s | 24% | 60% | 113% | 40% |
| Mastercard | 18% | 60% | 63% | 40% |
| Colgate-Palmolive | 56% | 70% | 91% | 65% |
| Novartis | 53% | 60% | 27% | 40% |
| Allianz SE | 51% | 50% | 22% | 20% |
| Carlisle Companies | 17% | 60% | 47% | 40% |
| Alphabet | NA | 60% | 9% | 40% |
| PPG Industries | 31% | 60% | 47% | 40% |
| Enbridge | 64% | 83% | 50% | 60% |
| Realty Income | 76% | 90% | 38% | 60% |
| UGI Corp | 48% | 75% | 52% | 60% |
| Average | 43.8% | 66.2% | 50.8% | 45.9% |
(Source: DK Research Terminal)
These are very well-covered dividends and their balance sheets are much safer than they appear.
Elevated debt/capital is primarily a result of stock buybacks.
When a company buys back stock above book value, it reduces shareholder equity and pushes up debt/capital. Shares that are repurchased sit on the balance sheet as treasury stock which is primarily used for stock option compensation for employees. It’s treated as a liability. In fact, it’s an asset that can be sold to raise cash.
You can see this from the fact that companies like Colgate and Lowe’s who have been buying back lots of stock for decades. And yet they have strong credit ratings despite relatively high debt/capital ratios.
| Company | Long-Term Risk Management Consensus Industry Percentile | Risk-Rating | Risk-Management Rating | S&P Credit Rating | Credit Rating Outlook | 30-Year Bankruptcy Risk |
| Lowe’s | 87% | Low | Very Good | BBB+ | Stable | 5.00% |
| Mastercard | 82% | Low | Very Good | A+ | Stable | 0.60% |
| Colgate-Palmolive | 85% | Low | Very Good | AA- | Stable | 0.55% |
| Novartis | 93% | Low | Exceptional | AA- | Stable | 0.55% |
| Allianz SE | 87% | Low | Very Good | AA | Stable | 0.55% |
| Carlisle Companies | 60% | Low | Above-Average | BBB | Stable | 7.50% |
| Alphabet | 65% | Low | Above-Average | AA+ | Stable | 0.29% |
| PPG Industries | 68% | Low | Above-Average | BBB+ | Stable | 5.00% |
| Enbridge | 73% | Low | Good | BBB+ | Stable | 5.00% |
| Realty Income | 58% | Medium | Average | A- | Stable | 2.50% |
| UGI Corp | 52% | Medium | Average | NA | Stable | 13.00% |
| Average | 73.6% | Low | Good | A- stable | Stable | 3.7% |
(Source: DK Research Terminal)
S&P estimates the average risk of any of these blue-chips going bankrupt over the next 30 years at 3.7%.
For context, here’s how they compare to the Dividend Kings’ watchlists.
| Dividend King Watchlist | Average S&P Credit Rating |
Average 30-Year Bankruptcy Risk |
| Ultra SWANs | A- Stable | 2.23% |
| Dividend Aristocrats | A- Stable | 2.95% |
| Foreign Dividend Stocks | A- Stable | 3.12% |
| Dividend Kings | A- Stable | 3.63% |
| Dividend Champions | BBB+ Stable | 3.81% |
| Strong ESG | BBB+ Stable | 3.88% |
| Ultimate SWAN Portfolio | A- Stable | 3.69% |
| Blue-Chips | BBB+ Stable | 4.31% |
| Low Volatility Stocks | BBB+ Stable | 4.48% |
| Master List average | BBB+ Stable | 4.74% |
| Hyper-Growth stocks | BBB+ Stable | 6.28% |
| Monthly Dividend Stocks | BBB Stable | 7.13% |
| Safe Midstream | BBB Stable | 7.35% |
(Source: DK Research Terminal)
Six rating agencies also consider these companies’ long-term risk management to be in the top 25% of their peers.
How does that compare to other blue-chips?
| Classification | Average Consensus LT Risk-Management Industry Percentile |
Risk-Management Rating |
| S&P Global (SPGI) #1 Risk Management In The Master List | 94 | Exceptional |
| Strong ESG Stocks | 78 |
Good – Bordering On Very Good |
| Ultimate SWAN Portfolio | 75 | Good |
| Foreign Dividend Stocks | 75 | Good |
| Ultra SWANs | 71 | Good |
| Low Volatility Stocks | 68 | Above-Average |
| Dividend Aristocrats | 67 | Above-Average |
| Dividend Kings | 63 | Above-Average |
| Safe Midstream | 62 | Above-Average |
| Master List average | 62 | Above-Average |
| Hyper-Growth stocks | 61 | Above-Average |
| Monthly Dividend Stocks | 60 | Above-Average |
| Dividend Champions | 57 | Average, Bordering On Above-Average |
(Source: DK Research Terminal)
But rating agencies are hardly the only ones that say these blue-chips are among the world’s safest and highest quality companies.
Ben Graham considered a 20+ year dividend growth streak to be a sign of excellent quality.
Justin Law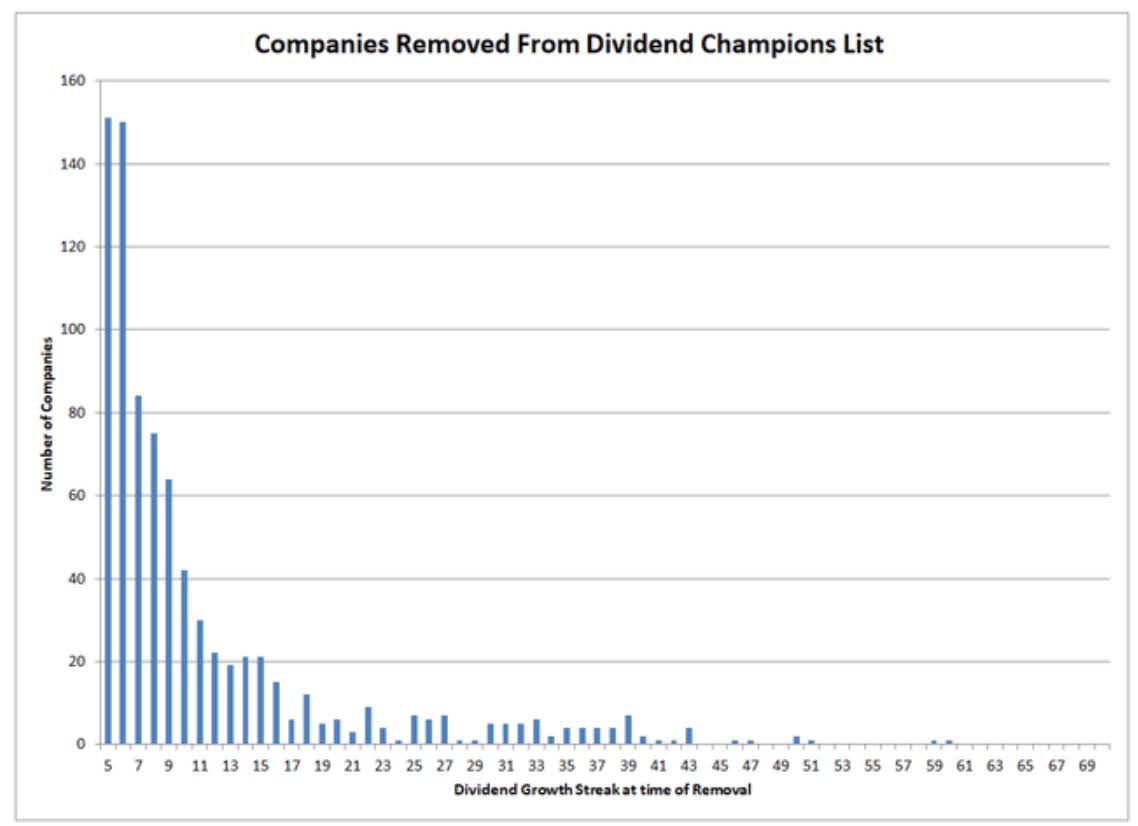
If a company has grown its dividends for 20+ years, there is very little risk that it will cut its dividend or even fail to keep raising it in all economic and industry conditions.
The average dividend growth streak for these blue-chips is 34 years or almost 2x the Graham standard of excellence.
- Effectively an aristocrat portfolio
| Company | Dividend Growth Streak (Years) | ROC (Greenblatt) | ROC Industry Percentile | 13-Year Median ROC |
| Lowe’s | 59 | 32% | 87% | 26% |
| Mastercard | 10 | 623% | 95% | 830% |
| Colgate-Palmolive | 59 | 34% | 95% | 92% |
| Novartis | 25 | 523% | 98% | 69% |
| Allianz SE | 2 | NA | NA | NA |
| Carlisle Companies | 45 | 44% | 77% | 38% |
| Alphabet | NA | 87% | 67% | 74% |
| PPG Industries | 50 | 32% | 87% | 42% |
| Enbridge | 27 | NA | NA | NA |
| Realty Income | 27 | NA | NA | NA |
| UGI Corp | 34 | NA | NA | NA |
| Average | 33.8 Dividend Aristocrat | 196.4% | 86.6% Wide Moat | 167.4% Stable Moat |
(Source: DK Research Terminal)
Return on capital is pre-tax profit/operating capital (the money it takes to run the business).
- Joel Greenblatt’s gold standard proxy for quality and moatiness
The S&P 500’s 2021 ROC was 14.6%.
- On average, it takes the typical S&P company about 7 years to recoup investments they make
The average return on capital for these Ultra SWANs is 196%.
- Average investment recouped in 6 months
- 13x higher quality than the average S&P 500 company according to one of the greatest investors in history
These Ultra SWANs’ ROC is in the top 13% of their industries, confirming a wide moat.
ROC is 30% higher than their 13-year median, confirming a stable or improving moat.
OK, so now that you know why you can trust these 11 amazing blue-chips, here’s why you should consider buying them today.
Wonderful Companies At Wonderful Prices
For context, let’s first consider the S&P 500’s valuation.
S&P 500 Valuation Profile
| Year | EPS Consensus | YOY Growth | Forward PE | Blended PE | Overvaluation (Forward PE) |
Overvaluation (Blended PE) |
| 2021 | $206.17 | 50.20% | 20.7 | 21.8 | 20% | 24% |
| 2022 | $226.13 | 9.68% | 19.6 | 20.1 | 14% | 14% |
| 2023 | $248.93 | 10.08% | 17.8 | 18.7 | 3% | 6% |
| 2024 | $275.29 | 10.59% | 16.1 | 16.9 | -6% | -4% |
| 12-Month forward EPS | 12-Month Forward PE | Historical Overvaluation | PEG | 25-Year Average PEG | S&P 500 Dividend Yield |
25-Year Average Dividend Yield |
| $234.18 | 19.074 | 13.20% | 2.24 | 3.62 | 1.42% | 2.01% |
(Source: DK S&P 500 Valuation And Total Return Tool)
The S&P 500 is historically 13% overvalued based on the historical average forward PE of 16.9
- over the last 45 years
- over the last 25 years
- over the last 10 years (modern low rate era)
Statistically speaking, there is a 97% probability that the fair value of the stock market is about 17X forward earnings.
And that’s for average quality companies.
| Company | Discount To Fair Value | PE/EBITDA/FFO 2022 | Earnings Yield 2022 | 12-Month Consensus Total Return Potential | 12-Month Fundamentally Justified Upside Total Return Potential |
| Lowe’s | 25.2% | 15.4 | 6.5% | 35.6% | 35.4% |
| Mastercard | 0.6% | 34.7 | 2.9% | 21.8% | 1.1% |
| Colgate-Palmolive | 0.2% | 24.9 | 4.0% | 8.6% | 2.5% |
| Novartis | 13.1% | 14.9 | 6.7% | 7.0% | 18.7% |
| Allianz SE | 11.5% | 9.7 | 10.3% | 19.2% | 17.9% |
| Carlisle Companies | 18.8% | 16.9 | 5.9% | 18.8% | 24.0% |
| Alphabet | 17.5% | 22.3 | 4.5% | 33.9% | 21.2% |
| PPG Industries | 16.3% | 17.7 | 5.6% | 31.4% | 21.2% |
| Enbridge | 11.6% | 9.4 | 10.6% | 4.9% | 19.1% |
| Realty Income | 0.5% | 18.3 | 5.5% | 7.7% | 4.7% |
| UGI Corp | 31.5% | 11.9 | 8.4% | 39.7% | 49.9% |
| Average | 13.4% | 17.8 | 6.5% | 20.8% | 19.6% |
(Source: DK Research Terminal)
Here we have 11 of the world’s best companies trading at 17.8X forward earnings, a 13% historical discount.
- the mirror image of the S&P 500’s overvaluation
Analysts expect this portfolio to deliver 21% total returns in the next 12 months, a forecast that is justified by their fundamentals and valuations.
But I’m not trying to get you a potential 20% gain in a year, my goal is to help you retire in safety and splendor.
Long-Term Return Fundamentals That Can Help You Retire In Safety And Splendor
| Company | Yield | FactSet Long-Term Consensus Growth Rate | LT Consensus Total Return Potential | LT Risk-Adjusted Expected Return |
| Lowe’s | 1.6% | 20.5% | 22.1% | 15.4% |
| Mastercard | 0.6% | 19.5% | 20.1% | 14.0% |
| Colgate-Palmolive | 2.3% | 5.9% | 8.2% | 5.8% |
| Novartis | 3.6% | 5.0% | 8.6% | 6.0% |
| Allianz SE | 4.9% | 6.0% | 10.9% | 7.7% |
| Carlisle Companies | 0.9% | 15.0% | 15.9% | 11.1% |
| Alphabet | 0.0% | 15.9% | 15.9% | 11.1% |
| PPG Industries | 1.8% | 12.1% | 13.9% | 9.7% |
| Enbridge | 6.0% | 6.0% | 12.0% | 8.4% |
| Realty Income | 4.1% | 5.2% | 9.3% | 6.5% |
| UGI Corp | 3.8% | 7.5% | 11.3% | 7.9% |
| Average | 2.7% | 10.8% | 13.5% | 9.4% |
(Source: DK Research Terminal)
These Ultra SWANs were only selected for pure safety and quality and yet offer a relatively attractive yield that nearly matches Vanguard’s high-yield ETF.
| Investment Strategy | Yield | LT Consensus Growth | LT Consensus Total Return Potential | Long-Term Risk-Adjusted Expected Return | Long-Term Inflation And Risk-Adjusted Expected Returns | Years To Double Your Inflation & Risk-Adjusted Wealth |
10 Year Inflation And Risk-Adjusted Return |
| Adam’s Planned Correction Buys | 4.0% | 18.9% | 22.9% | 16.0% | 13.5% | 5.3 | 3.56 |
| High-Yield | 2.8% | 11.3% | 14.1% | 9.9% | 7.4% | 9.8 | 2.04 |
| Ultimate Recession-Resistant Ultra SWANs | 2.7% | 10.8% | 13.5% | 9.5% | 7.0% | 10.3 | 1.96 |
| Dividend Aristocrats | 2.2% | 8.9% | 11.1% | 7.8% | 5.3% | 13.6 | 1.67 |
| S&P 500 | 1.4% | 8.5% | 9.9% | 7.0% | 4.5% | 16.1 | 1.55 |
(Sources: Morningstar, FactSet, Ycharts)
They also offer far better yield than the dividend aristocrats and S&P, plus much strong long-term return potential.
- you can reasonably expect these Ultra SWANs to double your inflation-adjusted wealth every decade
What does that potentially mean for you?
Inflation-Adjusted Consensus Total Return Potential: $1,000 Initial Investment
| Time Frame (Years) | 7.4% CAGR Inflation-Adjusted S&P Consensus | 8.6% Inflation-Adjusted Aristocrat Consensus | 11.0% CAGR Inflation-Adjusted Ultimate SWAN Portfolio Consensus | Difference Between Inflation Adjusted Ultimate SWAN Portfolio Consensus And S&P Consensus |
| 5 | $1,429.63 | $1,511.29 | $1,685.82 | $174.52 |
| 10 | $2,043.84 | $2,284.01 | $2,841.98 | $557.97 |
| 15 | $2,921.94 | $3,451.81 | $4,791.06 | $1,339.25 |
| 20 | $4,177.29 | $5,216.70 | $8,076.85 | $2,860.15 |
| 25 | $5,971.97 | $7,883.98 | $13,616.09 | $5,732.12 |
| 30 | $8,537.71 | $11,915.01 | $22,954.25 | $11,039.24 |
(Source: DK Research Terminal, FactSet)
Analysts think these Ultra SWANs could potentially deliver 23X inflation-adjusted returns over the next 30 years.
| Time Frame (Years) | Ratio Aristocrats/S&P | Ratio Inflation-Adjusted UGI Consensus And S&P Consensus |
| 5 | 1.06 | 1.18 |
| 10 | 1.12 | 1.39 |
| 15 | 1.18 | 1.64 |
| 20 | 1.25 | 1.93 |
| 25 | 1.32 | 2.28 |
| 30 | 1.40 | 2.69 |
(Source: DK Research Terminal, FactSet)
As well as potentially double the aristocrats and nearly triple the returns of the S&P 500.
What proof is there that this Ultra SWAN portfolio can actually deliver 13% to 14% long-term returns?
Historical Returns Since January 2007 (Annual Rebalancing)
“The future doesn’t repeat, but it often rhymes.” – Mark Twain
Past performance is no guarantee of future results, but studies show that blue-chips with relatively stable fundamentals over time offer predictable returns based on yield, growth, and valuation mean reversion.
Bank of America So let’s take a look at how these Ultra SWANs have performed over the last 15 years when 91% of total returns were the result of fundamentals, not luck. (Source: Portfolio Visualizer Premium)
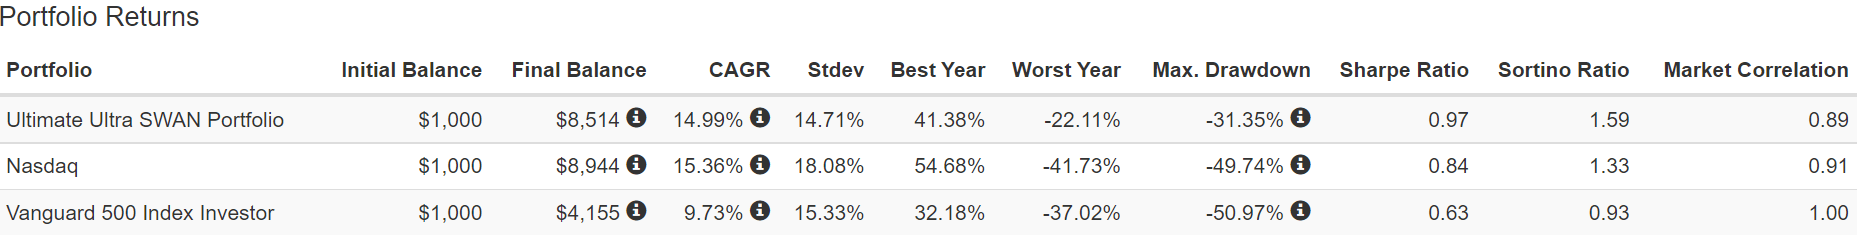
These Ultra SWANs not only delivered close to the 13.5% long-term returns expect in the future, but they outperformed the S&P by over 5% per year.
They even kept up with the Nasdaq during one of the greatest tech-fueled bull markets in US history.
But while the Nasdaq and S&P crashed 50% during the Great Recession, this Ultra SWAN portfolio fell just 31%.
- the same as a 60/40 retirement portfolio
- but with zero bond exposure
- 20% better Sortino ratio than the Nasdaq
- 71% better than the S&P 500
- Sortino ratio = excess total return (compared to risk-free treasuries) divided by negative volatility (the only kind anyone cares about)
(Source: Portfolio Visualizer Premium)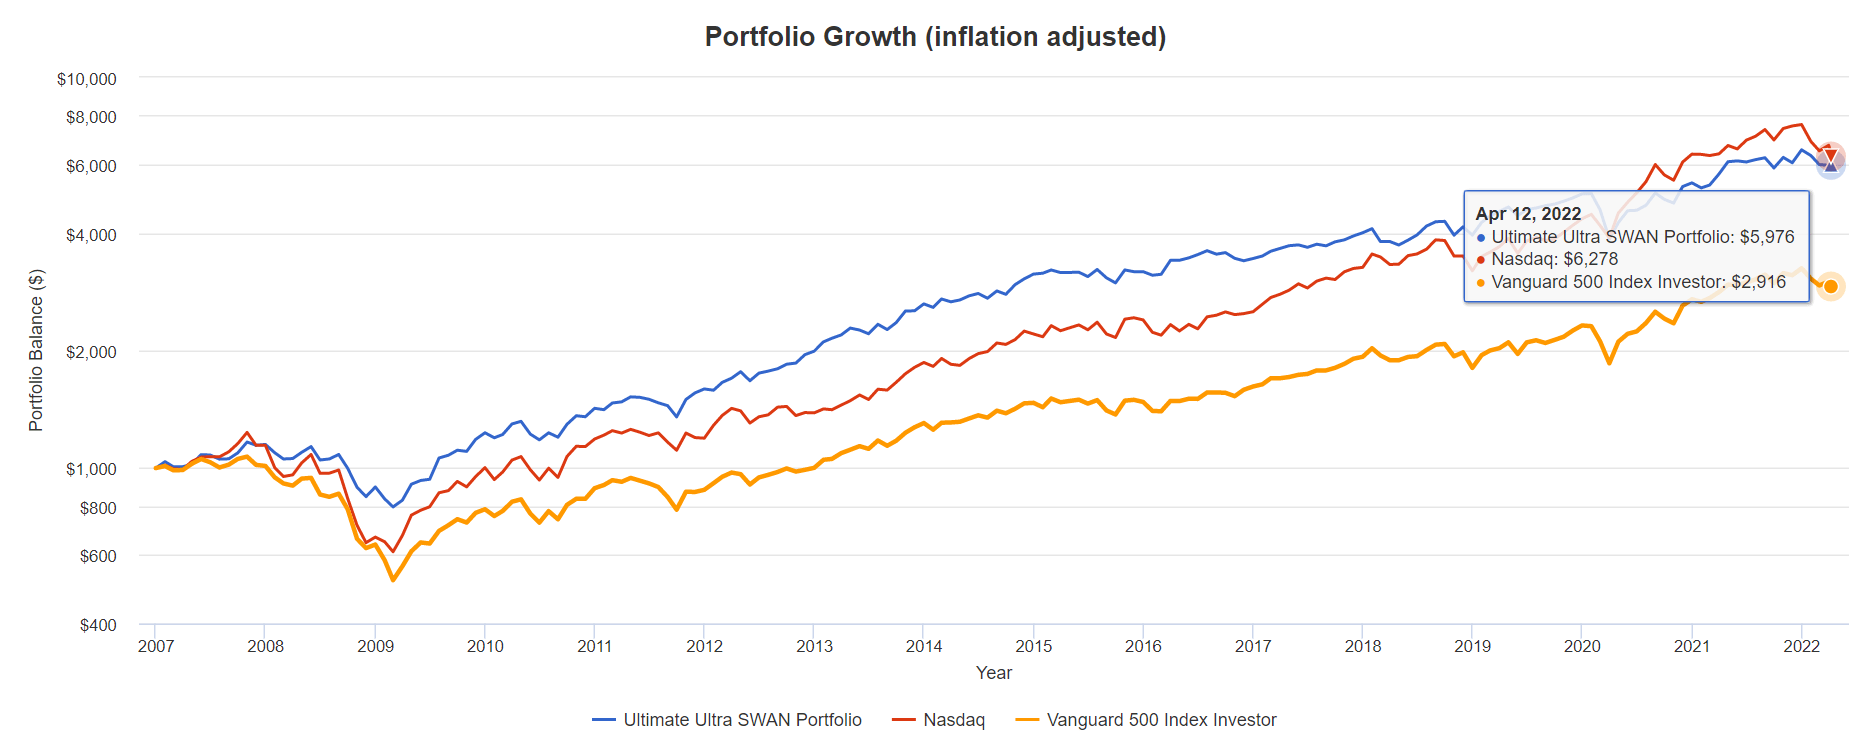
5% better annual returns than the S&P 500 for 15 years resulted in 6X inflation-adjusted turns, more than double that of the S&P 500.
(Source: Portfolio Visualizer Premium)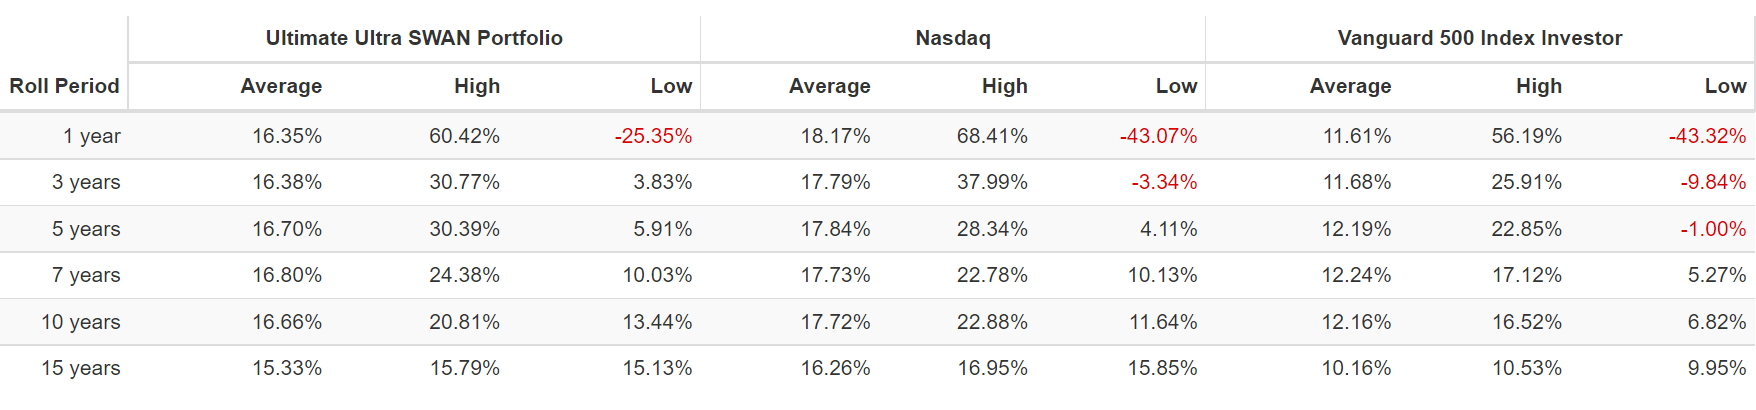
The power of superior quality can be seen by these impressive rolling returns.
| Portfolio | Worst 1 Year Total Return | Worst 3 Year Total Return | Worst 5 Year Total Return |
| Ultimate Ultra SWANs | -25.4% | 11.9% | 33.3% |
| Nasdaq | -43.1% | -9.7% | 22.31% |
| S&P | -43.3% | -24.2% | -4.9% |
(Source: Portfolio Visualizer)
And let’s not forget about dividends.
| Portfolio | 2007 Income Per $1,000 Investment | 2021 Income Per $1,000 Investment | Annual Income Growth | Starting Yield | 2021 Yield On Cost |
| S&P | $19 | $54 | 7.75% | 1.9% | 5.4% |
| Nasdaq | $3 | $45 | 21.34% | 0.3% | 4.5% |
| Ultimate Ultra SWANs | $22 | $195 | 16.87% | 2.2% | 19.5% |
(Source: Portfolio Visualizer)
This Ultra SWAN portfolio delivered 17% annual income growth over the last 14 years, turning a 2.2% starting yield into an impressive 19.5% yield on cost.
What about the future?
| Time Frame | S&P Inflation-Adjusted Dividend Growth | S&P Inflation-Adjusted Earnings Growth |
| 1871-2021 | 1.6% | 2.1% |
| 1945-2021 | 2.4% | 3.5% |
| 1981-2021 (Modern Falling Rate Era) | 2.8% | 3.8% |
| 2008-2021 (Modern Low Rate Era) | 3.5% | 6.2% |
| FactSet Future Consensus | 2.0% | 5.2% |
(Sources: S&P, FactSet, Multipl.com)
In the future higher inflation is expected to result in 2% real S&P 500 dividend growth, at least for the next few years.
That’s slightly lower than the market’s longer-term 3% or so rate of true income growth.
| Analyst Consensus Income Growth Forecast | Risk-Adjusted Expected Income Growth | Risk And Tax-Adjusted Expected Income Growth |
Risk, Inflation, And Tax Adjusted Income Growth Consensus |
| 15.2% | 10.6% | 9.0% | 6.5% |
(Sources: DK Research Terminal, FactSet)
In contrast, analysts expect 15% long-term income growth from this portfolio.
Adjusting for the risk of these companies not growing as expected, taxes, and inflation, 6.5% is a more reasonable expectation.
- more than 3X what analysts expect from the S&P 500
- FactSet consensus is for 0.5% inflation-adjusted income growth from a 60/40
- these Ultra SWANs have 13X the real income growth potential of a 60/40
How To Turn These 10 Ultra SWANs Into The Ultimate Sleep Well At Night Retirement Portfolio
While it’s not unreasonable or dangerous to put all your money into an 11-company Ultra SWAN aristocrat portfolio exposed to every sector, most investors wouldn’t be comfortable doing so for one big reason.
(Source: Portfolio Visualizer)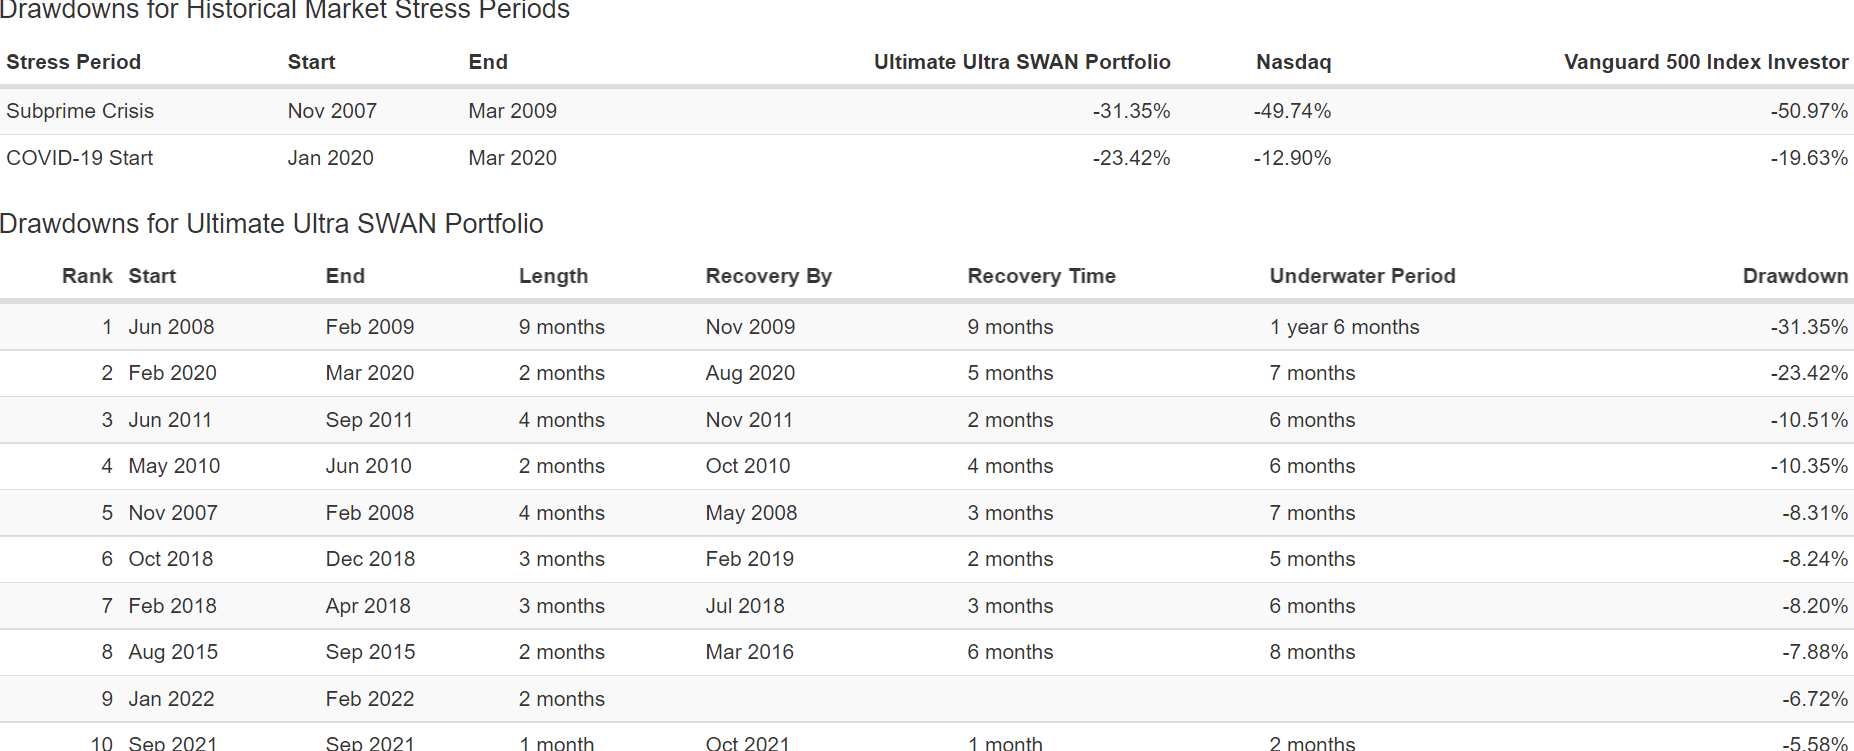
Inevitable corrections and even bear markets are more than most people can stand without losing sleep, panic selling, or both.
So let me show you 3 quick and easy ways to create a Zen Ultra SWAN Retirement portfolio.
- 65/35 stock/bond (and cash)
- 80/20 stock/bond (and cash)
- 50/50 stock/bond (and cash)
Using Vanguard’s High-Yield ETF (VYM), we can boost long-term returns a bit as well as achieve even greater diversification.
- 30% allocation in the 80/20
- 15% in the 65/35
- 0% in the 50/50
Using Vanguard’s Extended Duration US Treasury ETF (EDV) we can gain recession hedging power with zero fundamental risk.
- 15% allocation in the 80/20
- 30% in the 65/35
- 45% in the 50/50
- 5% of both portfolios are cash (BIL, SGOV, SCHO, VGSH, high-yield savings, anything will do)
These Ultra SWANs are then
- 50% of the portfolio in the 80/20
- 50% of the portfolio in the 65/35
- 50% of the portfolio in the 50/50
In a future “Preparing for Recession” video I’ll explain in detail why 35% bond and cash allocation is the optimal allocation for most blue-chip portfolios.
- whose goal is to minimize bear market declines
- and achieve good long-term returns
- and maximize negative volatility-adjusted returns (Sortino ratio)
- what I call a “recession optimized” retirement portfolio
First, let’s take a look at their historical returns to see the power of diversification and prudent risk-management asset allocation.
Historical Returns Since January 2008 (Annual Rebalancing)
(Source: Portfolio Visualizer Premium)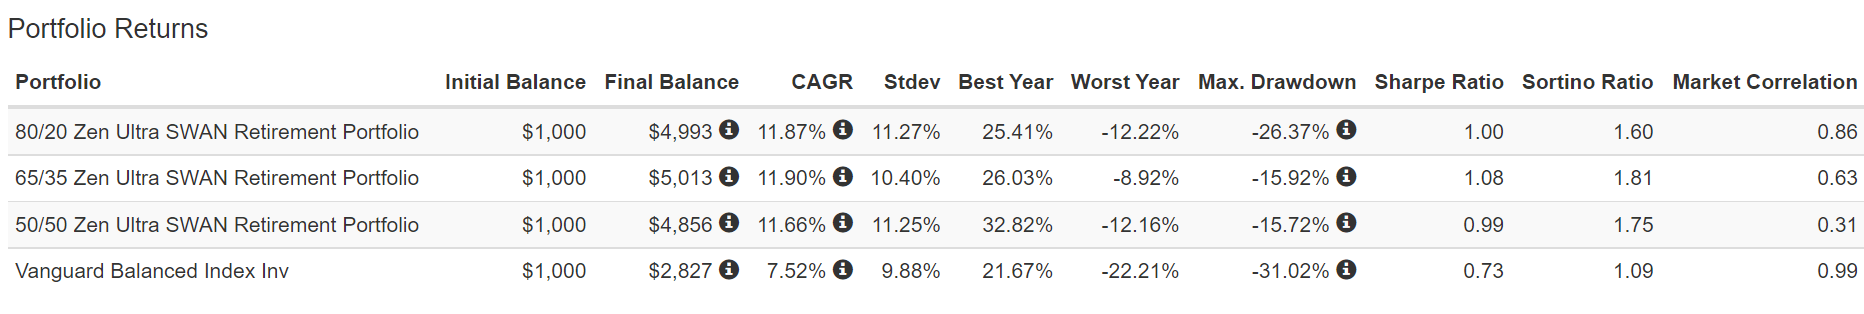
A more stock-heavy portfolio will perform better over time unless you start out right before the 2nd worst market crash in US history.
This is why all three portfolios delivered similar 12% annual returns over the last 14 years, which was almost 2X more than a 60/40 retirement portfolio.
You might think a 50/50 portfolio would be the least volatile but that’s not the case.
- interest rate volatility can cause bonds to sometimes add to volatility, not subtract it
In fact, the 65/35 portfolio was the least volatile, with just 10.4% average annual volatility, very similar to the 60/40’s 9.9%.
- but with 71% better annual returns
- and thus 66% better negative volatility-adjusted total returns
Most impressively, the 65/35 matched the 50/50 version of this portfolio by falling just 16% in the Great Recession.
- 50% smaller decline than a 60/40
- 100% pure stock version of this portfolio also fell 31%, just like a 60/40
So why would very conservative investors potentially choose a 50/50 version of this portfolio?
(Source: Portfolio Visualizer Premium)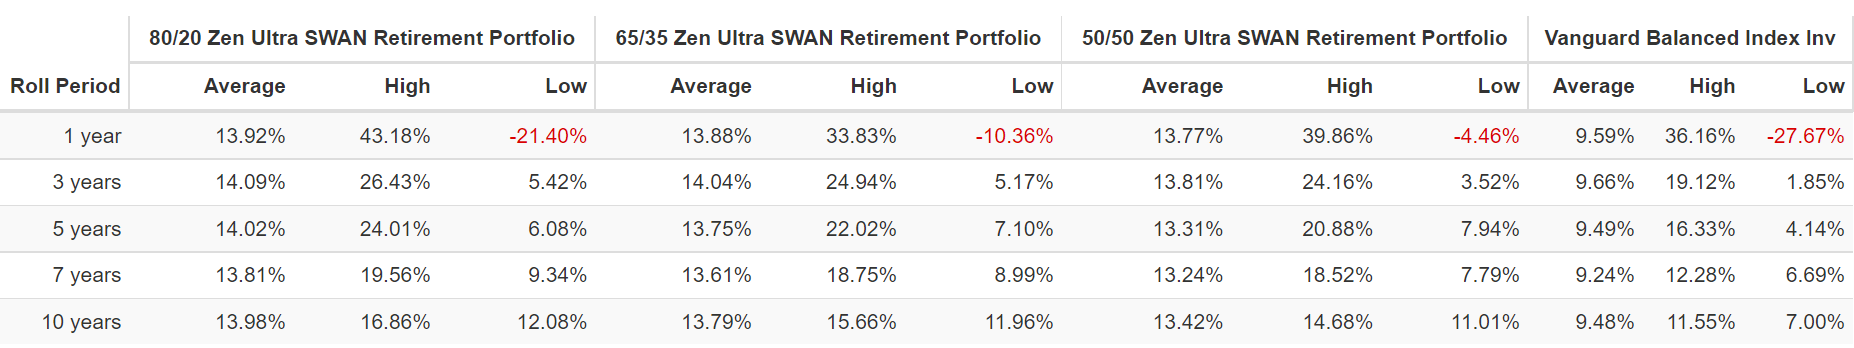
Because extra bond exposure can help minimize short-term pain and even boost returns during periods of extreme market stress.
| Portfolio | Worst 1 Year Total Return | Worst 3 Year Total Return | Worst 5 Year Total Return |
| 80/20 Zen Ultra SWAN | -21.4% | 17.2% | 38.9% |
| 65/35 Zen Ultra SWAN | -10.4% | 16.3% | 40.90% |
| 50/50 Zen Ultra SWAN | -4.5% | 10.9% | 46.5% |
| Standard 60/40 Retirement Portfolio | -27.7% | 5.7% | 22.5% |
(Source: Portfolio Visualizer Premium)
As you’d expect the most stock-heavy version of this portfolio delivered the highest worst 3-year return.
But the 50/50 version suffered no worse than a 4.5% 12-month return and actually delivered the highest worst 3-year return.
Why You Might Want To Consider The 50/50 Zen Ultra SWAN Portfolio
Let’s use a 75-year Monte Carlo simulator and 5,000 statistical simulations of this portfolio.
- to simulate the most extreme likely bear markets and likely inflation-adjusted returns in the future
- this 14 years of data include the 2 worst recessions in over 75 years
- unless you think we’re likely to face more extreme economic cataclysms than the Great Recession and Pandemic this is a very useful risk-management technique
- assuming the top marginal tax rate
- and after-tax returns
- and the worst 10 years of returns first
- the realistic worst-case scenario (lost decade upfront)
- and the 3% safe withdrawal rate analysts currently estimate for this portfolio
- starting with the median retired couple’s $555K nest-egg
75-Year Monte Carlo Simulation: Worst Case-Scenario
Portfolio Visualizer Premium
Even in the most extreme worst-case scenario, a 44% bear market that is just a 10% probability over the next 75 years, this portfolio never runs out of money.
In fact, there is a 90% statistical probability that you could withdraw 6.5% of this portfolio every year, adjusted for inflation, and never run out of money.
75-Year Monte Carlo Simulation: Base Case-Scenario
Portfolio Visualizer Premium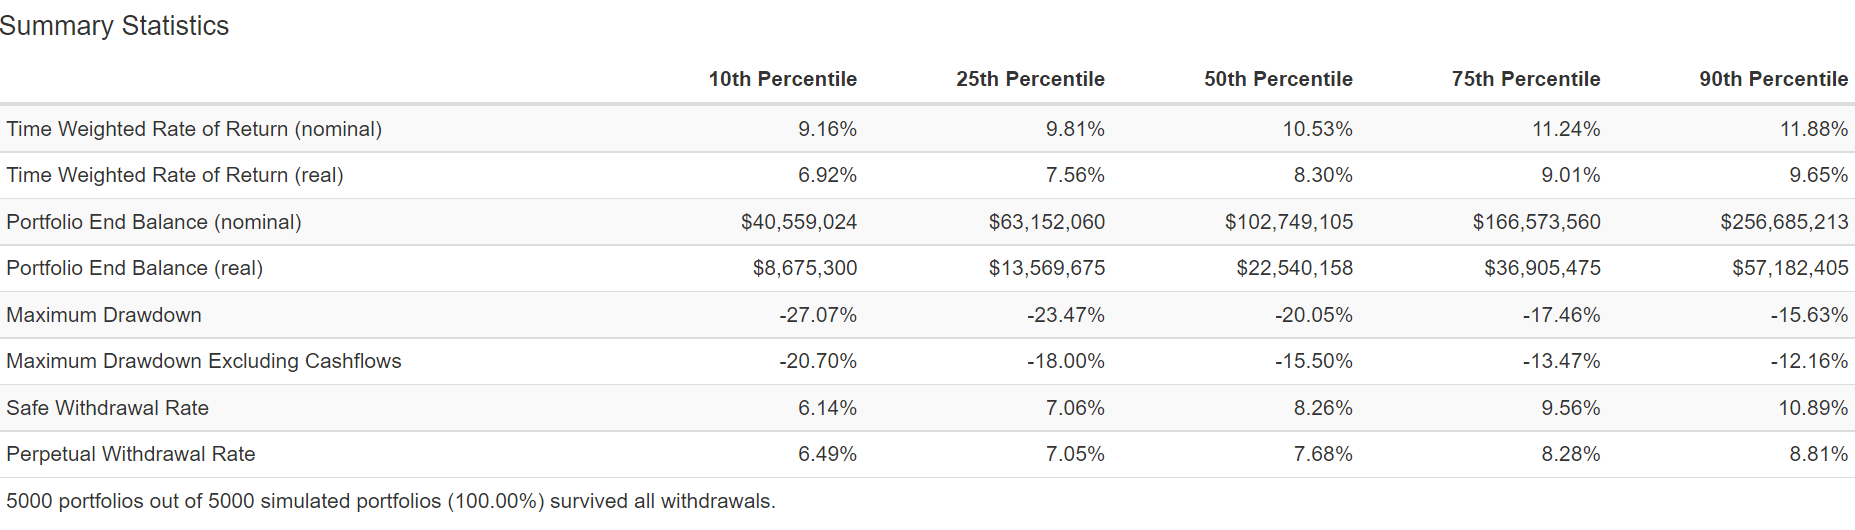
Assuming we don’t experience a lost decade in the 2020s, there is approximately an 80% chance that this portfolio, not counting the 3% annual withdrawal, never suffers a bear market.
- not even over numerous economic cycles for the next 75 years
And I’m sure your children, grandchildren, or favorite charities would appreciate you turning $555K into potentially $8.7 million to $57.2 million over the decades.
Future Retirement Income Growth Potential
What about income growth?
| Portfolio | 2008 Income Per $1,000 Investment | 2021 Income Per $1,000 Investment | Annual Income Growth | Starting Yield | 2021 Yield On Cost |
| 80/20 Zen Ultra SWAN | $27 | $118 | 12.01% | 2.7% | 11.8% |
| 65/35 Zen Ultra SWAN | $29 | $116 | 11.25% | 2.9% | 11.6% |
| 50/50 Zen Ultra SWAN | $31 | $110 | 10.23% | 3.1% | 11.0% |
(Source: Portfolio Visualizer Premium)
Each of these Zen Ultra SWAN portfolios delivered double-digit income growth, and here’s what analysts expect in the future.
80/20 Zen Ultra SWAN Consensus Long-Term Income Growth Forecast
| Analyst Consensus Income Growth Forecast | Risk-Adjusted Expected Income Growth | Risk And Tax-Adjusted Expected Income Growth |
Risk, Inflation, And Tax Adjusted Income Growth Consensus |
| 11.2% | 7.9% | 6.7% | 4.2% |
(Sources: DK Research Terminal, FactSet)
65/35 Zen Ultra SWAN Consensus Long-Term Income Growth Forecast
| Analyst Consensus Income Growth Forecast | Risk-Adjusted Expected Income Growth | Risk And Tax-Adjusted Expected Income Growth |
Risk, Inflation, And Tax Adjusted Income Growth Consensus |
| 9.0% | 6.3% | 5.3% | 2.9% |
(Sources: DK Research Terminal, FactSet)
50/50 Zen Ultra SWAN Consensus Long-Term Income Growth Forecast
| Analyst Consensus Income Growth Forecast | Risk-Adjusted Expected Income Growth | Risk And Tax-Adjusted Expected Income Growth |
Risk, Inflation, And Tax Adjusted Income Growth Consensus |
| 6.9% | 4.9% | 4.1% | 1.6% |
(Sources: DK Research Terminal, FactSet)
- 60/40 consensus is 0.5% long-term inflation and tax-adjusted income growth
- these Zen Ultra SWAN retirement portfolios offer 3X to 8.5X more real income growth potential than a 60/40
Superior Fundamentals Lead To Potentially Life-Changing Long-Term Results
| Metric | 60/40 | 80/20 Zen Ultra SWAN | 65/35 Zen Ultra SWAN |
50/50 Zen Ultra SWAN |
| Yield | 2.1% | 2.6% | 2.5% | 2.5% |
| Growth Consensus | 5.1% | 8.5% | 7.0% | 5.4% |
| LT Consensus Total Return | 7.2% | 11.1% | 9.5% | 7.9% |
| Risk-Adjusted Expected Return | 5.1% | 7.8% | 6.7% | 5.5% |
| Safe Withdrawal Rate | 2.6% | 5.3% | 4.2% | 3.0% |
(Sources: DK Research Terminal, FactSet)
While a 3% withdrawal rate might not be much, it’s better than a 60/40, and as we’ve seen 50% bond exposure tends to lead to a far smaller peak declines.
- 4.5% was the worst 12-month return for the 50/50 Zen Ultra SWAN portfolio
In fact, the 50/50 version of this portfolio is expected to deliver 0.7% better annual returns than a 60/40, with far less volatility over time.
Inflation-Adjusted Consensus Total Return Forecast: $555K Median Retired Couple’s Savings
| Time Frame (Years) | 4.7% CAGR Inflation-Adjusted 60/40 | 5.4% Inflation And Risk-Adjusted 50/50 Zen Ultra SWAN Retirement Portfolio | Difference Between 50/50 Zen Ultra SWAN and 60/40 |
| 5 | $698,608.36 | $722,274.11 | $23,665.75 |
| 10 | $879,375.94 | $939,963.77 | $60,587.83 |
| 15 | $1,106,917.81 | $1,223,263.97 | $116,346.15 |
| 20 | $1,393,337.02 | $1,591,949.36 | $198,612.35 |
| 25 | $1,753,868.28 | $2,071,754.62 | $317,886.34 |
| 30 | $2,207,688.38 | $2,696,170.69 | $488,482.31 |
(Sources: DK Research Terminal, FactSet)
That 0.7% higher annual return potential could result in an extra half-million in inflation-adjusted wealth and turn a $555K median retired couple’s savings into $2.7 million over 30 years.
And the 80/20 version? Well, that could be the ticket to your rich retirement dreams.
Inflation-Adjusted Consensus Total Return Forecast: $555K Median Retired Couple’s Savings
| Time Frame (Years) | 4.7% CAGR Inflation-Adjusted 60/40 | 8.6% Inflation And Risk-Adjusted 80/20 Zen Ultra SWAN Retirement Portfolio | Difference Between 80/20 Zen Ultra SWAN and 60/40 |
| 5 | $698,608.36 | $838,768.38 | $140,160.02 |
| 10 | $879,375.94 | $1,267,625.95 | $388,250.01 |
| 15 | $1,106,917.81 | $1,915,755.97 | $808,838.16 |
| 20 | $1,393,337.02 | $2,895,271.24 | $1,501,934.23 |
| 25 | $1,753,868.28 | $4,375,607.17 | $2,621,738.89 |
| 30 | $2,207,688.38 | $6,612,830.55 | $4,405,142.17 |
(Sources: DK Research Terminal, FactSet)
What does potentially double the returns of a 60/40 get you over 30 years?
Potentially an extra $4.4 million in inflation-adjusted wealth and could turn a $555K portfolio into $6.6 million in today’s money.
But here’s the real power of superior quality companies offering superior long-term yield and income growth potential.
This Is How You Retire Rich And Stay Rich In Retirement
Motley Fool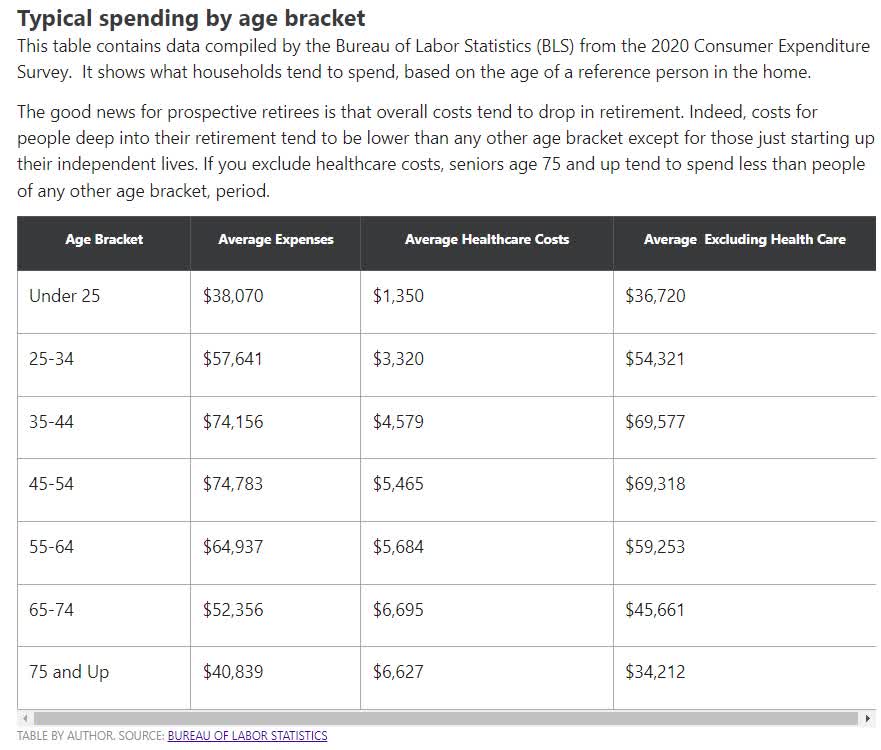
For context, the average retired couple starts out spending $52K per year and ends up spending just under $41K by the age of 75.
Now let’s see how the 80/20 Zen Ultra SWAN retirement portfolio can help the typical retired couple not just retire in comfort but in safety and splendor.
| Annual Income Year 1 (80/20 Zen Ultra SWAN) | $14,432.24 | Annual Income Year 30 (80/20 Zen Ultra SWAN) | $49,506.56 | ||
| Annual Social Security | $39,768 | Extra Income In Year 1 | $555.09 | Extra Inflation-Adjusted Income In Year 30 | $32,729.84 |
| Annual Income Year 1 | $54,200 | Extra Monthly Income In Year 1 | $46.26 | Extra Inflation-Adjusted Monthly Income In Year 30 | $2,727.49 |
(Sources: DK Research Terminal, FactSet)
Including the average couple’s Social Security, year one retirement income is $54,200 with a marginally higher income compared to a 60/40.
But by year 30 of retirement, the inflation-adjusted extra income could be $33,000, or almost $3K more per month.
| Total Inflation-Adjusted Income Over 30 Years ($555K Median Retirement Savings) | Average Inflation-Adjusted Annual Retirement Income | Average Monthly Inflation-Adjusted Annual Retirement Income | Average Daily Inflation-Adjusted Annual Retirement Income |
| $959,081.89 | $31,969.40 | $2,664.12 | $87.59 |
| Total Inflation-Adjusted Income Over 30 Years ($555K Median Retirement Savings) Including Social Security | Average Annual Income (Including Social Security) | Average Monthly Income (Including Social Security) | Average Daily Inflation-Adjusted Annual Retirement Income |
| $2,152,121.89 | $71,737.40 | $5,978.12 | $196.54 |
(Sources: DK Research Terminal, FactSet)
Over 30 years this portfolio could deliver almost $1 million in inflation-adjusted retirement income all on its own, and with Social Security average $71K in inflation-adjusted annual income.
- almost 2X what the average retired couple age 75+ actually spends
| Extra Inflation-Adjusted Income Over 30 Years Vs 60/40 | Average Extra Annual Income | Extra Average Monthly Income |
Extra Average Daily Income |
| $499,273.84 | $16,642.46 | $1,387 | $45.60 |
(Sources: DK Research Terminal, FactSet)
This means, compared to a 60/40, potentially an extra $500,000 in inflation-adjusted retirement income, an extra $1,400 per month.
Bottom Line: Recession Is Coming At Some Point But These 10 Amazing Blue-Chip Bargains Mean You Don’t Have To Worry
“Nobody can predict interest rates, the future direction of the economy or the stock market. Dismiss all such forecasts and concentrate on what’s actually happening to the companies in which you’ve invested.” — Peter Lynch
I don’t have a crystal ball and I can’t tell you when the next recession or bear market will start.
What I can tell you is that at some point we will have a recession and a bear market.
Daily Shot 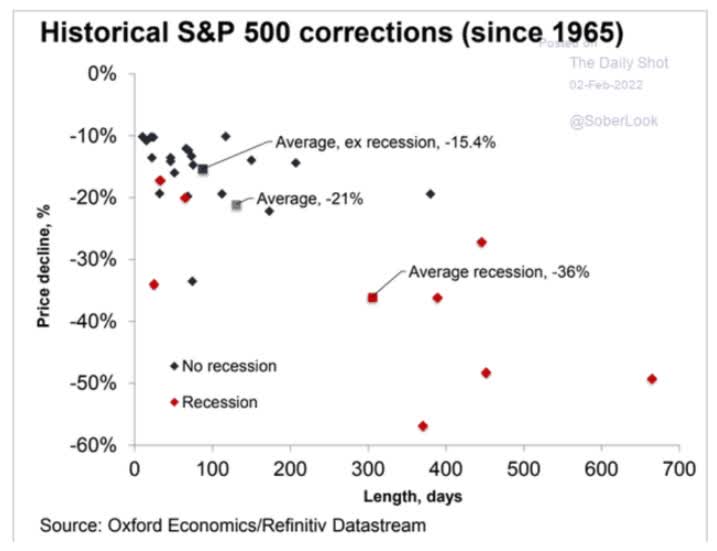
And the average historical recessionary bear market is a 36% peak decline.
If you think you can time the market and avoid this coming 30% to 40% decline, which is inevitable over the coming decades, you are wrong.
JPMorgan Asset Management 
Market timing is the 2nd most dangerous thing investors can try, responsible for 0.8% real returns for the typical portfolio over the past 20 years.
- 17% real return vs S&P 500’s 186%
- 110% real return for a 40/60 stock/bond portfolio
- 91% reduction in inflation-adjusted returns compared to the S&P
- 85% reduction in inflation-adjusted returns compared to a 40/60 portfolio
According to Fidelity, 98% of market timers lose money, and here’s why.
- According to JPMorgan 80% of the market’s single best days come within 2 weeks of its worst days
Dalbar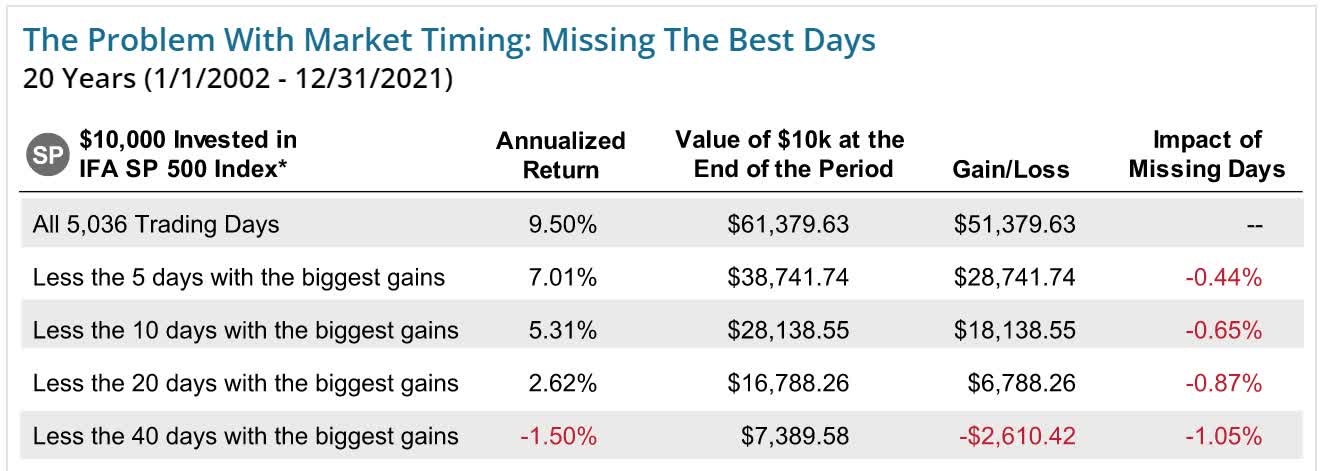
And missing just 40 of the market’s single best days over the last 20 years turns a 413% total return into a 26% loss…not adjusting for inflation.
Do you want to know why market timing is so dangerous?
- according to Bank of America since 1926, 99.9% of the market’s long-term returns came from just its 10 single best days each decade
- buy and hold investor returns in the S&P 500 1,150X adjusted for inflation
- missing just 10 of the best days each decade turned that into a 94% loss
Market timing is like playing a casino game where the odds of winning are 2%.
Buying quality blue-chips at attractive prices within a diversified and prudently risk-managed portfolio and holding for decades, is as close as you can get to a 100% certainty of retiring rich.
Charlie Bilello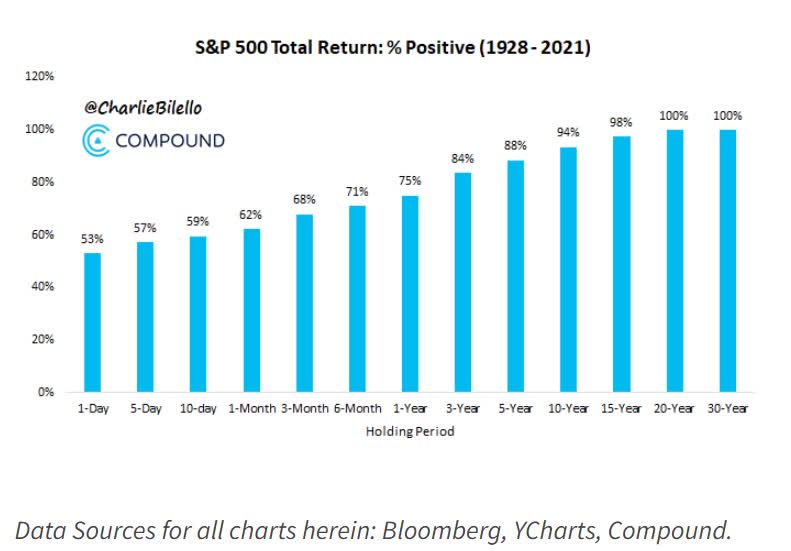
In fact, including dividends, the S&P has never failed to deliver positive returns over 20 years, even buying in 1929 at the market peak right before the Great Depression.
Market timing is great in theory, and nowhere else.
Prudent risk-management through the construction of Ultra SWAN recession-resistant bunker portfolios is the best chance most of us have for achieving our rich retirement dreams.
And that’s where LOW, MA, CL, NVS, ALIZY, CSL, GOOG, PPG, ENB, UGI, and O can help you.
These Ultra SWAN aristocrats are 14% undervalued, yielding a very safe 2.7%, and analysts expect 13.5% long-term returns.
- vs 11.2% aristocrats
- 9.9% S&P
And for anyone looking to sleep well at night in the next recession, you’ll be very happy to know that these 11 Ultra SWANs fell 31% during the Great Recession, the same as a 60/40 retirement portfolio.
And with the right low-cost ETFs, creating a reasonable and prudent allocation to stock/bonds/cash that’s right for your needs, you can turn the world’s best blue-chips into the ultimate Ultra SWAN retirement portfolio.
In fact, with just 2 or 3 ETFs you can turn these 11 Ultra SWAN bargains into a Zen Ultra SWAN retirement portfolio that can potentially help the typical retired couple
- generate an extra $500,000 million in inflation-adjusted retirement income over 30 years compared to a 60/40 retirement portfolio
- deliver $4.4 million more inflation-adjusted wealth over 30 years than a 60/40 retirement portfolio
- turn $555,000 in median retirement savings into $6.6 million inflation-adjusted wealth after 30 years more than a 60/40 retirement portfolio
- a more conservative version of this portfolio fell just 16% during the Great Recession, 50% less than a 60/40 portfolio and its worst 12-month return over the last 14 years was -4.5%
“I make millionaires, it’s what I do.” – Shark Tank’s Lori Greiner
I’m not just here to give you reasonable and prudent blue-chip stock ideas, though I love doing that.
I’m not here to give you 11 Ultra SWANs that analysts expect to deliver 20% gains in the next 12 months, though that’s exactly what these 11 blue-chips could fundamentally achieve.
I’m not here to sell you some pie in the sky speculative company or strategy to try to score fast gains or get rich quick.
“Fortunes are made by buying right and holding on.” – Thom Phelps, 100 To 1 In The Stock Market
I’m here to teach you not just how to find great companies, Buffett-style “wonderful companies at fair prices” but how to be a better long-term investor.
My goal is to turn you into a stock market genius.
To paraphrase Napoleon, the definition of a stock market genius is
The investor who can do the average thing when everyone else around him/her is losing their mind.”
That way whenever the next bear market comes, you won’t panic, but stay calm, rational, and stick to your sensible long-term investing plan.
This is how you practice disciplined financial science.
This is how you stop gambling and start investing for your future.
This is how you take charge of your financial destiny and start making your own luck on Wall Street.
This is how you retire in safety and splendor, by focusing on safety and quality first, and reasonable valuation and sound risk-management always.
Be the first to comment